Abstract
Although members of the p63 family of transcription factors are known for their role in the development and differentiation of epithelial surfaces, their function in cancer is less clear. Here, we show that depletion of the ΔNp63α and β isoforms, leaving only ΔNp63γ, results in epithelial to mesenchymal transition (EMT) in the normal breast cell line MCF10A. EMT can be rescued by the expression of the ΔNp63α isoform. We also show that ΔNp63γ expressed in a background where all the other ΔNp63 are knocked down causes EMT with an increase in TGFβ-1, -2, and -3 and downstream effectors Smads2/3/4. In addition, a p63 binding site in intron 1 of TGFβ was identified. Inhibition of the TGFβ response with a specific inhibitor results in reversion of EMT in ΔNp63α- and β-depleted cells. In summary, we show that p63 is involved in inhibiting EMT and reduction of certain p63 isoforms may be important in the development of epithelial cancers.
Keywords: Adenoviruses, Cell Junctions, Cellular Regulation, p63, Retrovirus, Site-directed Mutagenesis, EMT, MCF10A, UTR, Isoforms
Introduction
The transcription factor p63 is a member of the p53 gene family. At least six isoforms are expressed as a result of two alternative promoters giving rise to transactivating (TA)2 isoforms, containing a transactivation domain at the amino terminus and ΔN isoforms that lack this domain (1, 2). There are also 3′ splicing events giving rise to α, β, and γ variants. All isoforms contain a DNA binding domain (DBD), but different p63 isoforms have different functional properties. TA variants can bind to p53-responsive elements to activate p53 target genes, and the ΔN variants can act as dominant negative inhibitors of this transcriptional activity (1, 4). In addition, the ΔNp63 isoforms, particularly γ, have been shown to activate certain genes (5). p63 is essential for the development and differentiation of stratified squamous epithelium (5–7). Mice null for the p63 gene show a lack of stratified epithelium and epidermal appendages, as well as absence of lachrymal, salivary, and mammary glands (1, 8). The p63 gene has been implicated in cancer and tumor progression and can act as an oncogene (9, 10) or a tumor suppressor (11–13), depending on the cellular context. Knockdown of p63 has been shown to lead to a loss of cell adhesion, cellular arrest (14, 15), invasion, and metastasis (15), of which the latter are important steps in tumor progression.
A process that has been significantly linked to tumor progression and metastasis in cancer is epithelial to mesenchymal transition (EMT; 16–18). EMT is the process in which immotile epithelial cells transition into motile fibroblastic-like cells. A hallmark event in EMT is the loss of E-cadherin that leads to the disassembly of tight junction complexes, along with rearrangement of the actin cytoskeleton (16, 17). EMT is involved in normal embryogenesis and tissue morphogenesis, and in adults it is required for the maintenance of the epithelium, through wound healing and tissue repair (19). However, aberrant activation of EMT can cause cellular invasion and metastasis in cancer. A variety of specific growth and differentiation factors, such as Wnt and Notch proteins, as well as cytokines, have been shown to induce this EMT (16).
TGFβ, a cytokine that has been highlighted as a potent inducer of EMT, also plays a role in normal development, cellular differentiation, and survival. It is involved in inhibition of cell cycle progression and in rearrangement of components of the cytoskeleton, both of which are essential for EMT (16, 20). Here we show a role for ΔNp63γ in EMT of normal breast cells through the regulation of TGFβ. This EMT can be rescued by the expression of ΔNp63α, suggesting that the levels of ΔNp63α and γ are critical for the maintenance of the epithelial phenotype.
EXPERIMENTAL PROCEDURES
Constructs and Site-directed Mutagenesis
TAp63α, TAp63γ, ΔNp63α, and ΔNp63γ constructs were a gift from Kurt Engeland (University of Leipzig, Germany), and the TAp63β and ΔNp63β constructs were a gift from Gerry Melino (Medical Research Council Toxicology Unit, Leicester, UK). p-Super retroviral constructs expressing short hairpin RNAs against the 3′-UTR of p63 (p63-UTR), the p63 DNA binding domain (p63-DBD), and p53 were generated by ligating annealed oligonucleotides (supplemental Table 1) containing 21-mer targeting sequences into p-Super constructs (puromycin) according to the manufacturer's guidelines (Oligoengine, Seattle, WA); a scrambled control targeting no annotated gene has been described previously (shSCRAM) (21). Snail expression was analyzed using a Snail overexpression construct and a puromycin retroviral construct expressing short hairpin RNA against Snail (Origene, Rockville, MD). An adenoviral construct expressing ΔNp63α was generated by amplifying ΔNp63α with primers incorporating an HA tag at the carboxyl terminus (supplemental Table 2). This sequence was then TA-cloned into pcDNA3.1V5HisTOPO, according to the manufacturer's guidelines (Invitrogen, Paisley, UK). Site-directed mutagenesis for four silent point mutations (supplemental Table 3) were introduced into the DBD of the ΔNp63γ isoform, using a QuikChange II-E Site-directed Mutagenesis kit according to the manufacturer's guidelines (Stratagene, Wokingham, UK). The ΔNp63α sequence and the ΔNp63γ mutated sequence were subcloned into the pENTR 11 construct (Invitrogen) and recombined into the adenoviral construct p-Ad/CMV/V5dest, using Gateway® LR Clonase® II enzyme mix (Invitrogen, Paisley, UK). All plasmid constructs were sequenced prior to utilization.
Cell Culture, Transfection, and Transduction
The MCF10A, human mammary epithelial cell line 1 (HME-1), H1299, and phoenix-GP cells were cultured as described previously (21, 23–25). Cell lines were obtained from American Type Culture Collection and passed for no longer than 3 months before obtaining a fresh early pass cells. H1299 cells were transfected using GeneJuice (Merck, Whitehouse Station, NJ) according to the manufacturer's instructions. MCF10A cells were transfected using Oligofectamine (Invitrogen, Paisley, UK), according to the manufacturer's instructions. siRNA targeted to the 3′-UTR of p63 (UTRsi) and a scrambled control were added to cells for 24 h at a concentration of 50 nm and then cultured for 72 h (supplemental Table 4). p-Super MCF10A cells were transfected with 5 μg of the Snail construct or control vector pCMV-Tag 2B using polyethylenimine (Polysciences, Inc., Eppelheim, Germany) for 24 h.
Retroviral production in phoenix-GP cells has been described previously (21). Stable MCF10A and HME-1 cells were selected using 1 μg/ml−1 and 3 μg/ml−1 puromycin, respectively, and then maintained in medium containing 0.5 μg/ml−1 puromycin. Stable SCR and UTR MCF10A cells with a knockdown of Snail or with control vector (p-GFP-V-RS) were selected.
p-Super MCF10A cells were transfected with 5 μg of the Snail construct (Addgene, Plasmid 16218: FLAG Snail WT) or control vector pCMV-Tag 2B using polyethylenimine (Polysciences Inc., Warrington, PA) for 24 h. p-Super MCF10A cells with a knockdown of Snail (product number TG309226; Origene, Rockville, MD) were generated by retroviral production in phoenix-GP cells, which has been previously described (21). Stable cell lines were selected using 7 μg/ml−1 puromycin and maintained in 1 μg/ml−1.
Acini Culture
Acini were cultured from the p-Super retroviral MCF10A cell lines as described previously (26). The acini were cultured for a period of 14 days and maintained in medium containing 2% Matrigel and 0.5 μg/ml−1 puromycin.
Invasion Assay
Invasion chambers were prepared by coating cell culture inserts (PCF, 12-mm diameter, 12-μm pore size Millicell) with 100 μg/cm2 of Matrigel. Assays were conducted using 5 × 10⁵ cells/well (p-Super retroviral MCF10A cell lines), as described previously (27). Cells were resuspended in serum-free MCF10A growth medium, and MCF10A full growth medium was used for the chemotactic gradient.
ALK 5(TGFβ-R1) Inhibitor (SB-431542)
Solid anhydrous SB-431542, a gift from Dr. Gareth Inman, University of Dundee, was dissolved in dimethyl sulfoxide to a stock concentration of 10 mm. SB-431542 was added to p-Super MCF10A retroviral cell lines at a concentration of 10 μm for 48 h. Images were captured using a Nikon Eclipse Ti inverted microscope (×10 objective lens; Phase-1) and NIS-Elements BR 3.0 software.
Reverse Transcription-PCR Analysis
RNA was harvested using TRIzol® (Invitrogen, Paisley, UK) according to the manufacturer's guidelines, and reverse transcription was performed using the transcriptor high fidelity cDNA synthesis kit (Roche Applied Science, Burgess Hill, UK), according to the manufacturer's guidelines. PCR analysis was carried out using SYBR Green (Roche Applied Science, Burgess Hill, UK). Primer sets were used for p63α, β, and γ isoforms; TGFβ-1, TGFβ-2, TGFβ-3, Slug, Snail, and Twist are described in supplemental Table 5. RPLPO (human large ribosomal protein) primers were used as a control.
Western Blot Analysis
Protein lysates at a concentration of 50 μg were used for all blots, as described previously (28). The following primary antibodies were used in this study: mouse monoclonal anti-p63 4A4 (1:1,000; Santa Cruz Biotechnology, Heidelberg, Germany), mouse monoclonals for anti-p53 and anti-E-cadherin (BD Biosciences, Oxford, UK), mouse monoclonal anti-β-actin (1:10,000; Sigma), goat polyclonal anti-Smad2 (1:500; Santa Cruz Biotechnology, Santa Cruz, CA), rabbit polyclonals for anti-TGFβ (recognizing human recombinant TGFβ1, 2, and 3 and their precursor proteins pan-TGFβ), anti-Smad3, anti-Smad4, anti-phospho-Smad2, anti-phospho-Smad3, anti-Smad2/3, and Slug (1:1,000; Cell Signaling, Hertfordshire, UK), rabbit polyclonals for anti-p63α, anti-p63γ, and anti-β-actin (1:1,000; Santa Cruz Biotechnology, Santa Cruz, CA), anti-Snail and anti-Twist (1:100; Santa Cruz Biotechnology, Santa Cruz, CA), and rabbit polyclonal for anti-vimentin (1:1,000; Thermo Scientific, Waltham, MA). Secondary antibodies used in this study were goat anti-rabbit HRP, goat anti-mouse HRP, and donkey anti-goat HRP (1:2,000; Santa Cruz Biotechnology, Santa Cruz, CA). Protein loading was determined against β-actin. All Western blots were developed using West Femto (Thermo Scientific, Waltham, MA), apart from those shown in Fig. 2B (all panels) and Fig. 5C (p63 4A4 panel).
FIGURE 2.
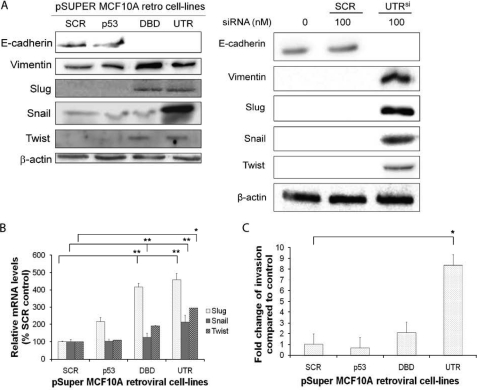
Knockdown of p63α and β isoforms results in an increase in markers of EMT and invasion. A, protein levels of E-cadherin, vimentin, Slug, Snail, and Twist in p-Super retroviral MCF10A cells depleted of p53, all p63 isoforms (DBD) or p63α and β (UTR) using retroviral transduced shRNA (right panel) or depleted p63α and β using siRNA (UTRsi, right panel). Protein loading: mouse anti-actin antibody. B, qRT-PCR analysis of Slug, Snail, and Twist mRNA expression levels. C, invasion analysis of MCF10A retroviral transduced cell lines, showing significant increase in invasion in cells with UTR shRNA. All experiments were carried out in triplicate, and three independent studies were performed. Paired t tests were performed (B and C), and significant differences with respect to the control, SCR, are shown (*, p < 0.05; **, p < 0.001).
FIGURE 5.
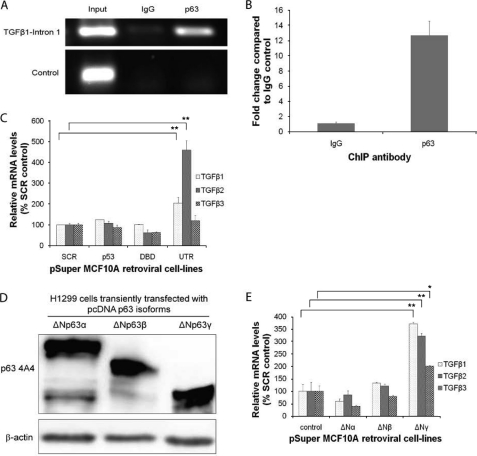
Transcriptional control of TGFβ by the ΔNp63γ isoform. A, ChIP for p63 binding to TGFβ-1 intron 1. B, qRT-PCR analysis of p63 chromatin-immunoprecipitates from MCF10A cells. C, qRT-PCR analysis of TGFβ-1, TGFβ-2, and TGFβ-3 mRNA expression levels in MCF10A cells depleted of p53, all isoforms of p63 (DBD) or only p63α and β (UTR). D, Western blotting of H1299 cells transiently transfected with pΔN63 isoforms, showing expression of pΔN63 isoforms (protein loading, mouse anti-actin antibody). E, qRT-PCR analysis of TGFβ-1, TGFβ-2, and TGFβ-3 mRNA expression levels in H1299 cells transiently transfected with different ΔNp63 isoforms, showing that only ΔNp63γ transcriptionally activated the TGFβ promoters. All experiments were carried out in triplicate, and three independent studies were performed. Paired t tests were performed (C and E), and significant differences with respect to the control, SCR, are shown (*, p < 0.05; **, p < 0.001).
Immunostaining of p-Super Retroviral MCF10A Cells
p-Super retroviral-infected MCF10A cells were grown as a monolayer and fixed using 4% paraformaldehyde for 20 min. The cells were then immunostained as described previously (29) with phospho-Smad2/3 antibody (1:100; Cell Signaling) and with anti-rabbit conjugated to fluorophore 488 (1:200; Molecular Probes, Paisley, UK). Prolong® Antifade reagent with DAPI (Invitrogen) was used as mounting agent. Immunofluorescent images were captured using a Leica AF6000 inverted microscope and Leica AF imaging software.
Immunostaining of Acini and Confocal Microscopy
Acini were indirectly stained as described previously (26). The following antibodies were used in this study: rabbit laminin V (1:100; Thermo Scientific, Waltham, MA), mouse E-cadherin and P-cadherin (1:100; BD Biosciences), mouse vimentin (1:100; Thermo Scientific, Waltham, MA), and anti-rabbit or anti-mouse conjugated to fluorophore 488 (1:200; Molecular Probes). Cell nuclei were stained using 1 μg/ml−1 Hoechst 33342 (Invitrogen, Paisley, UK) for 5 min. The Hoechst stain was removed by washing the chamber slide in PBS for 5 min. Slides were mounted with Prolong® Antifade reagent without DAPI. Images were captured with a confocal Nikon C1 imaging system mounted on a Nikon Eclipse 90i microscope. Three objective lenses were used as follows: ×10 Plan Apo N.A. 0.45, ×20 Plan Apo N.A. 0.75, and ×60 WI (water immersion) N.A 1.20. Fluorophores were imaged sequentially to minimize bleed-through, and images were collected to photomultiplier tubes through appropriate emission filter sets. Image acquisition and analysis were carried out using Nikon EZ-C1 3.90 software.
Chromatin Immunoprecipitation (ChIP) Assays
ChIP assays were carried out by fixing ∼2 × 10⁶ MCF10A cells with 1.5% formaldehyde for 10 min, washed twice in ice-cold PBS, pelleted at 2,000 × g, and serially resuspended in NCP1 (10 mm EDTA, 0.5 mm EGTA, 10 mm HEPES pH 6.5, 0.25% Triton X-100) and NCP2 (1 mm EDTA, 0.5 mm EGTA, 10 mm HEPES, pH 6.5, 200 mm NaCl) to isolate nuclei. Lysis was carried out in 1 ml of SDS-lysis buffer (1% SDS, 10 mm EDTA, 50 mm Tris-HCl, pH 8.0) supplemented with complete protease inhibitor mixture (Roche, Burgess Hill, UK) by sonication for 2 × 15 min (15 s on, 15 s off) using a bioruptor. Chromatin samples were incubated overnight at 4 °C with 2 μg of primary antibody, 25 μl of pre-blocked Dynabeads® protein G (Invitrogen, Paisley, UK) made up to a 1-ml final volume with IP buffer (final concentration 1% Triton X-100, 0.1% sodium deoxycholate, 10 mm EDTA, 50 mm Tris-HCl, pH 8.0). Precipitated complexes were washed six times with radioimmune precipitation assay buffer (50 mm HEPES, pH 8.0, 1 mm EDTA, pH 8.0, 1% Nonidet P-40, 0.7% sodium deoxycholate, 0.5 m lithium chloride, protease inhibitors), washed, eluted (10 mm Tris, pH 8.0, 1 mm EDTA, 10% SDS) and cross-linking reversed by incubating the samples at 65 °C for 16 h. DNA was purified using QIAquick PCR purification kit (Qiagen, Crawley, UK). Antibodies used for ChIP were monoclonal pan-p63 (clone 4A4; Santa Cruz Biotechnology, Heidelberg, Germany) or control immunoglobulin G (IgG). Primers were designed to the p63 binding site identified by chip-seq (Chr19:135369537:135369789) in intron 1 of TGFβ and an un-enriched region on chromosome 5 as a negative control. Semi-quantitative PCR of ChIP enriched DNA was carried out as described above for 36 cycles and products confirmed by visualization in a 2% agarose gel containing ethidium bromide.
Analysis of Public Available Microarray Data
Raw.cel files were retrieved using GEO (CSE 3744), and the raw data were analyzed using Partek software (rma normalized). ANOVA was used to compare groups.
RESULTS
Knockdown of p63α and β Isoforms Results in an EMT Phenotype
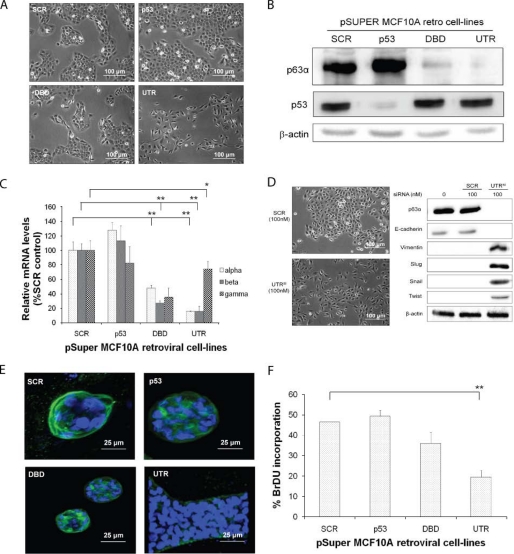
The p63 isoforms expressed in MCF10A cells were determined by real time PCR and the estimated copy number of each of p63α, β and γ isoforms was 846, 23 and 3 per 10 ηg of RNA compared with linearized plasmid standards. The ΔNp63 isoforms have been shown to be highly expressed in MCF10A cells (14), and these particular isoforms were detected in MCF10A cells using Western blotting (supplemental Fig. S1A). To determine the effect of p63 depletion, MCF10A cells were retrovirally transduced with shRNAs targeting the 3′-UTR of p63α and β, the DBD of all p63 isoforms, p53 (p53) or a scrambled control (SCR). Depletion of the ΔNp63α and β isoforms resulted in a change in morphology of MCF10A cells reminiscent of EMT (Fig. 1A, UTR). In contrast, knockdown of all of the ΔNp63 isoforms or p53 caused no phenotypic changes (Fig. 1A, DBD and p53, respectively). Decreased mRNA and protein levels were verified by Western blotting and real time PCR (Fig. 1, B and C; supplemental Fig. S1A). A siRNA molecule (UTRsi), to a different region of the UTR of p63α and β, was also used and produced a similar change in epithelial phenotype compared with a scrambled control (Fig. 1D). We also investigated the ability of these cells to form acini in Matrigel. Control cells and those with a knockdown of p53 were able to form acini, which expressed E-cadherin and lacked vimentin (supplemental Fig. S2). A phenotypic change in acini formation was seen in cells depleted of ΔNp63α and β (Fig. 1E, UTR), where the cells formed elongated structures without a lumen and expressed vimentin and lacked E-cadherin expression (Fig. 1F and supplemental Fig. S2). However, cells depleted of all the ΔNp63 isoforms (DBD) formed normal smaller acini (Fig. 1E, DBD), but did not express E-cadherin. However, they did express P-cadherin and vimentin (supplemental Fig. S2). In addition, knockdown of p63 isoforms resulted in a reduction in proliferation, particularly with knockdown of p63α and β (Fig. 1F and supplemental Fig. S1B).
FIGURE 1.
Knockdown of p63α and β isoforms results in a change of epithelial phenotype MCF10A retroviral cell lines. A, phase-contrast images of the control (SCR), p53-depleted (p53), all p63 isoforms depleted (DBD), and p63α and β isoform-depleted (UTR), showing EMT change in cells with UTR shRNA. B, p63 and p53 protein levels determined by Western blotting (β-actin detected using the mouse anti-actin antibody). C, qRT-PCR analysis of the p63α, β, and γ isoform mRNA expression levels. D, phase-contrast images of MCF10A cells, with knockdown of p63α and β isoforms, using a siRNA targeting a different sequence to the UTR (UTRsi) from that shown in A and B (β-actin detected using the mouse anti-actin antibody). E, confocal microscopy images of MCF10A retroviral cell lines. Blue DAPI nuclear staining and green Alexa Fluor 488 for laminin staining are shown. F, BrDU incorporation of MCF10A retroviral transduced cell lines, showing reduced proliferation of cells with DBD and UTR shRNA. All experiments were carried out in triplicate, and three independent studies were performed. Paired t tests were performed (Fig. 1, C and E), and significant differences with respect to the control, SCR, are shown (*, p < 0.05; **, p < 0.001).
To investigate the observed EMT phenotype, the abundance and expression of markers for EMT were examined by Western blotting and quantitative PCR (qRT-PCR). Cells depleted of ΔNp63α and β exhibited a complete loss of E-cadherin and increased vimentin, Slug, Snail, and Twist levels (Fig. 2A, left panel). A siRNA molecule (UTRsi), to a different region of the UTR of ΔNp63α and β, was also used, and this showed a similar change in epithelial phenotype compared with a scrambled control (Fig. 2A, right panel). Cells depleted of all ΔNp63 isoforms showed increases in some of the EMT-associated factors, but no increase in Snail (Fig. 2A, left panel). Similar results were observed in HME-1, when ΔNp63α and β were depleted (supplemental Fig. S3A). qRT-PCR, of mRNA from MCF10A cell lines, correlated with Western blotting, for Slug, Snail, and Twist, with Snail only increased in UTR cells (Fig. 2B). Because EMT has been shown to increase invasive potential, invasion assays were performed and showed that depletion of p53 had no effect on invasion, whereas cells depleted of all ΔNp63 isoforms exhibited a 2-fold increase in the level of invasion (Fig. 2C). However, cells depleted of just ΔNp63α and β were shown to have a 7-fold greater level of invasion compared with control cells (Fig. 2C). A similar trend of invasion was shown in HME-1 cells (supplemental Fig. S3B).
EMT Phenotype Is Maintained by the TGFβ-Smad2/3-dependent Signaling Complex
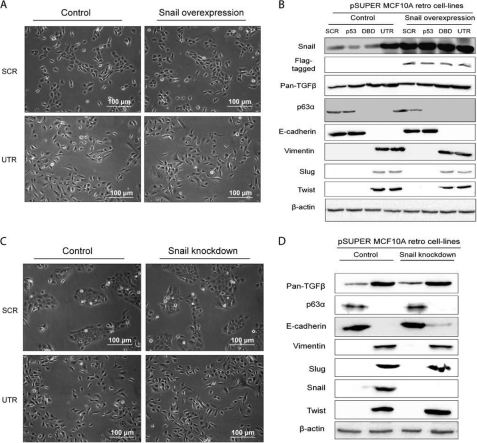
Because the EMT marker Snail was highly expressed in the UTR cells compared with SCR, p53, or DBD cells (Fig. 2A), we investigated further the role of Snail in the EMT phenotype. Snail was exogenously expressed in MCF10A cells depleted of p53 and p63, but no change in morphology was observed (Fig. 3A and supplemental Fig. S4). There was no difference in the level of pan-TGF, ΔNp63α, vimentin, Slug, and Twist as measured by Western blotting, although there was a small increase in E-cadherin (Fig. 3B), perhaps suggesting that some aspects of EMT were affected by expression of Snail. In addition, depletion of Snail in all cells showed similar results, suggesting that either Snail is not a major component of the EMT observed in p63α- and β-depleted cells or that Slug and Twist may maintain the EMT phenotype (Fig. 3, C and D).
FIGURE 3.
Snail is not involved in the EMT phenotype. A, phase-contrast images of SCR and UTR control cells and cells overexpressing Snail, showing that there is no change in phenotype. B, protein levels of pan-TGFβ, E-cadherin, vimentin, Slug, Snail, and Twist analyzed by Western blotting in cells from A. The levels showed no change in morphology when Snail was exogenously expressed. C, phase-contrast images of SCR and UTR control cells and cells with a knockdown in Snail, showing that there is no difference in phenotype. D, protein levels of pan-TGFβ, E-cadherin, vimentin, Slug, Snail, and Twist analyzed by Western blotting, in cells from C. There was no change in morphology when Snail was depleted (β-actin detected using the mouse anti-actin antibody). All experiments were carried out in triplicate, and three independent studies were performed.
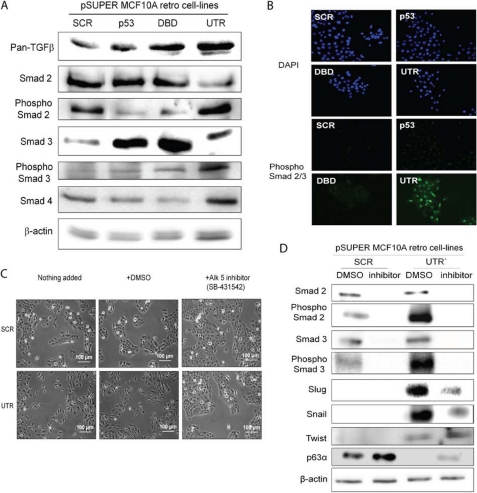
The TGFβ pathway is commonly associated with Smad activation, but it can also be Smad-independent (16, 20); therefore, we examined levels of TGFβ, Smad2, phospho-Smad2-, Smad3-, phospho-Smad3-, and Smad4-depleted cell lines. TGFβ protein was present in all MCF10A cells, but was increased in cells depleted of the ΔNp63α and β and all of the ΔNp63 isoforms (Fig. 4A). Similar results were also observed in HME-1 cells (supplemental Fig. S5A). Importantly, in both MCF10A and HME-1 cells with ΔNp63α and β isoforms depleted, Smad2 and 3 were activated, as determined by the phosphorylation status. In addition, Smad4, which forms a complex with Smad2/3 and facilitates transport into the nucleus, was increased at the protein level (Fig. 4A and supplemental Fig. S5A). In contrast, no increased activation of Smad2 or 3 was observed in cells where all the ΔNp63 isoforms were depleted (DBD). Further, immunohistochemistry staining for phospho-Smad2/3 in MCF10A cells depleted of all ΔNp63 isoforms, ΔNp63α and β only or p53, showed that only in cells depleted of ΔNp63α and β was the phospho-Smad2/3 complex found in the nucleus, indicating an active transcriptional complex (Fig. 4B).
FIGURE 4.
TGFβ pathway is involved in the EMT phenotype in MCF10A retroviral cells. A, pan-TGFβ, total Smads2/3/4, and phospho-Smad2/3 protein levels were analyzed using Western blotting and showed that phospho-Smad2/3 is increased in UTR containing cell only (β-actin detected using the rabbit anti-actin antibody). B, immunohistochemistry of phospho-Smad2/3 complex in control cells and cells depleted of p63α and β (UTR) shows that only in UTR-containing cells is the Smad2/3 phosphorylated in the nucleus. C, phase-contrast images of MCF10A cells with SCR and UTR shRNA, with and without the addition of the TGFβ pathway inhibitor SB-431542, show a rescue of the epithelial cell phenotype. D, protein levels of total Smad2 and 3, phospho-Smad2 and 3, Slug, Snail, and Twist were analyzed by Western blotting, in SCR and UTR cells with and without TGFβ inhibitor and showed that inhibition reduced phospho-Smad2/3 levels as well as total levels of Slug and Snail. All experiments were carried out in triplicate, and three independent studies were performed.
To determine whether the TGFβ pathway and not the BMP pathway was involved in the MCF10A EMT phenotype in ΔNp63α- and β-depleted cells (UTR), a specific inhibitor (SB-431542) of the TGFβ pathway (inhibits ALK5/TGFβ-1 receptor activation for Smad2/3-dependent signaling) was added to control and ΔNp63α- and β-depleted cells. No change in phenotype was observed in control cells; however, the inhibitor partially rescued the EMT phenotype of ΔNp63α and β cells from single fibroblastic-like cells back to the cobblestone appearance of epithelial cells (Fig. 4C). Slug and Snail were also reduced in these cells as well as the Smad2/3 levels (Fig. 4D).
Because protein levels of TGFβ were increased in DBD and UTR cells, we were interested in determining which isoform of p63 could transcriptionally activate the TGFβ promoter. In addition, we independently identified a p63 binding site in intron 1 of the TGFβ-1 gene using ChIP-seq in human foreskin keratinocytes.3 This site was found to be enriched in p63 ChIPs from MCF10A cells compared with an IgG control by semiquantitative (Fig. 5A) and qRT-PCR (Fig. 5B). There was no enrichment of a nonspecific region of chromosome 5.
TGFβ-1, TGFβ-2, and TGFβ-3 mRNA expression levels were determined in control, UTR, and DBD cells. The three TGFβ isoforms were present in all MCF10A cells, but were only increased in cells depleted of the ΔNp63α and β and not when all p63 isoforms were depleted (Fig. 5C). To ascertain which p63 isoform can induce TGFβ-1, TGFβ-2, and TGFβ-3 signaling, ΔNp63 isoforms were transfected into H1299 cells (Fig. 5D). Only the ΔNp63γ isoform transcriptionally increased all TGFβ isoforms (Fig. 5E), suggesting that p63 binds to a region in intron 1 of TGFβ-1 and enhances its transcription.
Rescue and Induction of EMT Phenotype by p63 Isoforms
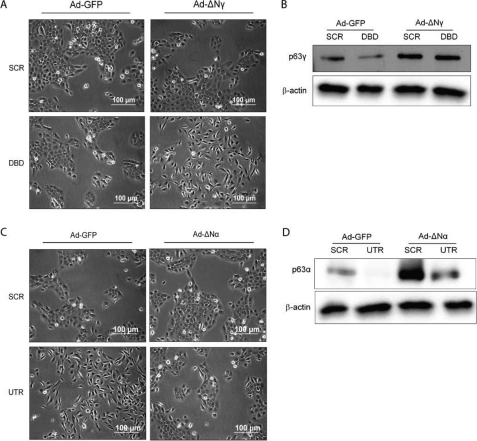
Because our data indicate that depleting only ΔNp63α and β results in EMT, they imply that the remaining isoform, ΔNp63γ, up-regulates TGFβ and is required for the EMT phenotype. To determine whether ΔNp63γ can induce the observed EMT, ΔNp63γ was expressed in control (SCR) and cells depleted of all ΔNp63 isoforms (DBD), using an adenovirus expressing ΔNp63γ with silent mutations in the shRNA recognition site. Results indicated that ΔNp63γ expressed in the background of depletion of all the ΔNp63 isoforms results in an EMT phenotype with cells losing their tight cobblestone appearance and exhibiting isolated spindly growth (Fig. 6A, bottom panels, and B). Expression of ΔNp63γ in the control background where all p63 isoforms are expressed had no effect on cell morphology (Fig. 6A, top panels), probably due to the high level of expression of ΔNp63α in MCF10A cells. Therefore, repression of ΔNp63α and β, with only ΔNp63γ expressed, results in EMT.
FIGURE 6.
Rescue of epithelial phenotype by reexpression of p63α. A, phase-contrast images of SCR and DBD with and without addition of adenoviral expressing ΔNp63γ (ΔNγ) isoform, showing that ΔNp63γ can induce an EMT phenotype. B, protein levels of Slug, Snail, and Twist analyzed by Western blotting in cells from A. C, phase-contrast images of SCR and UTR cells with and without addition of adenoviral ΔNp63α (ΔNα) isoform, showing that ΔNp63α can rescue an epithelial phenotype. D, protein levels of Slug, Snail, and Twist analyzed by Western blotting, in cells from C. β-Actin was detected using the mouse anti-actin antibody. All experiments were carried out in triplicate, and three independent studies were performed.
To establish whether the EMT phenotype was reversible, ΔNp63α or control GFP was exogenously expressed using an adenovirus transducted into SCR control cells or cells depleted of ΔNp63α and β (Fig. 6, C and D). Although the control virus had no effect on the phenotype (Fig. 6C, top panels), the adenovirus expressing ΔNp63α reversed the EMT phenotype (Fig. 6C, bottom panels).
TGFβ1 and p63 Levels in Breast Cancers
To determine whether the results presented here are relevant to the situation in breast cancer, we mined a publically available dataset (30). This dataset included 18 basal, 21 nonbasal breast carcinomas, and 7 normal tissues. The results indicate that p63 is down-regulated in basal and nonbasal breast cancer types (Fig. 7A), whereas TGFβ is increased significantly in the nonbasal, but not basal cancers compared with normal tissue (Fig. 7B). However, it is not clear whether all or some of the p63 isoforms are reduced because it is difficult to determine the expression of the individual isoforms from the microarray data.
FIGURE 7.
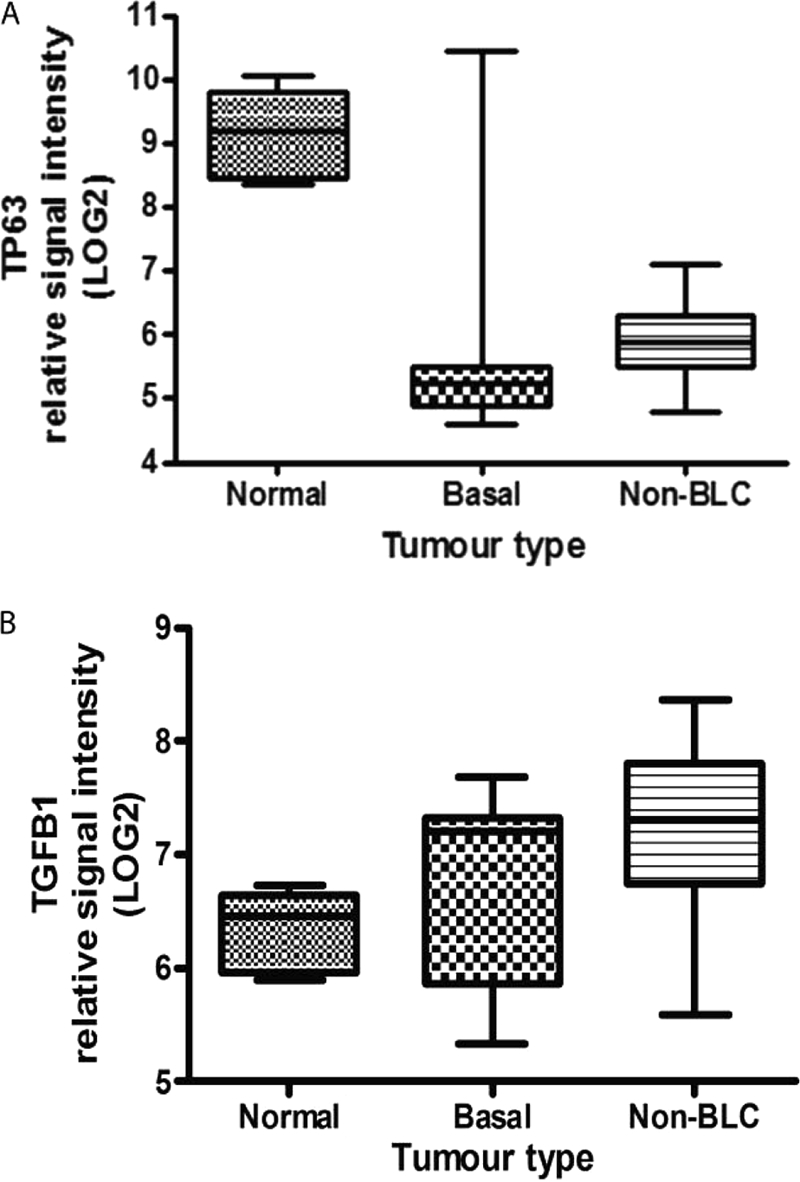
p63 and TGFβ levels in basal and nonbasal breast cancers. A, p63 levels in normal breast, nonbasal-like, and basal-like breasts tumors, from publically available microarray data (30). There is a significant difference in p63 expression between normal and both basal and non-BLC, p < 0.001. B, TGFβ levels in normal breast, non-basal like and basal like breasts tumors, from the same data set. There is a significance difference between normal and non-BLC, p < 0.006, but no significant difference between normal and basal. Error bars, S.E.
DISCUSSION
Approximately 90% of cancers occur in cells of epithelial origin (31), therefore a greater understanding of the sequence of events that allows for epithelial cells to progress along a tumorogenic pathway, is required. The p63 gene has been shown to have a central role in the development of stratified epithelium, and p63 also plays a role in cancer. Breast cancer nonbasal tumors and basal tumors have been shown to have down-regulation of p63, and this can affect other pathways such as BRCA1 and TGFβ (15, 30). However, the role of p63 in cancer has been further complicated by the lack of information on the different p63 isoforms expressed and their functions in cancers. Nevertheless, this complexity is being resolved, and various studies have emerged that focus on the signaling pathways that are regulated by the p63 isoforms and how these p63 isoforms activate and repress transcription (31–33).
Here we report on the gain and loss of expression of the ΔNp63 isoforms, using the MCF10A normal human breast epithelial cell line as a model system. We investigated the ΔNp63 isoforms because these were, and have been shown previously (14, 32), to be the predominant isoforms in MCF10A cells. We demonstrate that the loss of ΔNp63α and β isoforms (UTR) led to an EMT phenotype with loss of E-cadherin and an increase in the abundance of the EMT markers. The phenotype was reversible upon reintroduction of ΔNp63α alone. Knockdown of ΔNp63α and β isoforms also prevented the cells from forming acini and enhanced invasion activity in vitro. These findings are supported by recent studies, performed in human squamous cell carcinoma where they found that down-regulation of ΔNp63α leads to a more invasive phenotype with the expression of markers of EMT (34, 35). They also showed that Snail was able to down-regulate ΔNp63α by reducing the CAAT/enhancer-binding protein on the ΔNp63α promoter, suggesting that loss of ΔNp63α is an important contribution to cancer progression. The results from this study would imply that although the ΔNp63γ isoform induces EMT and up-regulates Snail, EMT is through the TGFβ pathway and is independent of expression of Snail. Indeed, we demonstrate that the ΔNp63γ isoform when expressed alone in a p63-depleted background produced an EMT phenotype linked to the induction of the TGFβ-Smad2/3 pathway, and there are numerous reports on the involvement of TGFβ in EMT (17, 20). Our results also show that expression of the ΔNp63γ isoform can increase TGFβ-1, TGFβ-2, and TGFβ-3 at a message and protein level. In addition, we show that ΔNp63α can reverse the EMT phenotype, suggesting that the balance between the isoforms is important for maintaining the epithelial state.
Signaling by BMP, part of the TGFβ superfamily, has been previously shown to be regulated by p63, in human keratinocytes, where p63 can suppress transcription of the inhibitory Smad7, increase BMP7, and sustain BMP signaling (36). However, the BMP pathway appeared not to be involved in this EMT phenotype, as we used a potent, specific inhibitor of ALK4, 5, and 7 (SB-431542) (3), which is specific for the TGFβ pathway, and this reversed the phenotype and caused a reduction in markers of EMT. However, absolute proof that the BMP pathway is not involved would require further work. Interestingly, knockdown of all p63 isoforms (DBD) resulted in no EMT phenotype, although these cells did have a reduction in E-cadherin levels and had increased levels of vimentin, Slug, and Twist. However, Smad signaling requires the phosphorylation of Smad2/3 complex that then partners with Smad4, and this complex translocates to the nucleus where it exerts effects on target genes (37). The DBD cells showed only a slight increase in phosphorylated Smad3, but they also showed a significant reduction in Smad4. Therefore, in these cells the Smad complex may not be able to affect transcription of target genes, thus we do not observe a total loss of E-cadherin expression in addition to a lack of EMT phenotype.
In conclusion, we have shown that EMT is induced by the ΔNp63γ isoform, in a background of low expression of ΔNp63α in MCF10A cells and coupled with increased TFGβ signaling, leads to a more invasive phenotype. Therefore, determination of the levels of each of the p63 isoforms in breast cancer tissue would be an important step in elucidating the importance of p63 in various cancers.
Supplementary Material
Acknowledgments
We thank Drs. Suzanne McFarlane and Ashleigh McClatchey (Queen's University Belfast) for help with invasion assays and Dr. Gareth Inman (Beatson Institute, Glasgow University, UK), for the ALK5 inhibitor SB-431542.
The work was supported by Medical Research Council Grant MRC G0700754.

The on-line version of this article (available at http://www.jbc.org) contains supplemental Tables 1–5 and Figs. S1–S5.
S. S. McDade and D. J. McCance, unpublished observations.
- TA
- transactivating
- BMP
- bone morphogenetic protein
- DBD
- DNA binding domain
- EMT
- epithelial to mesenchymal transition
- HME-1
- human mammary epithelial cell line 1
- qRT-PCR
- quantitative RT-PCR.
REFERENCES
- 1. Yang A., Kaghad M., Wang Y., Gillett E., Fleming M. D., Dötsch V., Andrews N. C., Caput D., McKeon F. (1998) Mol. Cell 2, 305–316 [DOI] [PubMed] [Google Scholar]
- 2. McDade S. S., McCance D. J. (2010) Biochem. Soc. Trans. 38, 223–228 [DOI] [PubMed] [Google Scholar]
- 3. Inman G. J., Nicolás F. J., Callahan J. F., Harling J. D., Gaster L. M., Reith A. D., Laping N. J., Hill C. S. (2002) Mol. Pharmacol. 62, 65–74 [DOI] [PubMed] [Google Scholar]
- 4. Serber Z., Lai H. C., Yang A., Ou H. D., Sigal M. S., Kelly A. E., Darimont B. D., Duijf P. H., Van Bokhoven H., McKeon F., Dötsch V. (2002) Mol. Cell. Biol. 22, 8601–8611 [DOI] [PMC free article] [PubMed] [Google Scholar]
- 5. Ghioni P., Bolognese F., Duijf P. H., Van Bokhoven H., Mantovani R., Guerrini L. (2002) Mol. Cell. Biol. 22, 8659–8668 [DOI] [PMC free article] [PubMed] [Google Scholar]
- 6. Candi E., Cipollone R., Rivetti di Val Cervo P., Gonfloni S., Melino G., Knight R. (2008) Cell. Mol. Life Sci. 65, 3126–3133 [DOI] [PMC free article] [PubMed] [Google Scholar]
- 7. Crum C. P., McKeon F. D. (2010) Annu. Rev. Pathol. 5, 349–371 [DOI] [PubMed] [Google Scholar]
- 8. Mills A. A., Zheng B., Wang X. J., Vogel H., Roop D. R., Bradley A. (1999) Nature 398, 708–713 [DOI] [PubMed] [Google Scholar]
- 9. Crook T., Nicholls J. M., Brooks L., O'Nions J., Allday M. J. (2000) Oncogene 19, 3439–3444 [DOI] [PubMed] [Google Scholar]
- 10. Senoo M., Tsuchiya I., Matsumura Y., Mori T., Saito Y., Kato H., Okamoto T., Habu S. (2001) Br. J. Cancer 84, 1235–1241 [DOI] [PMC free article] [PubMed] [Google Scholar]
- 11. Wang X., Mori I., Tang W., Nakamura M., Nakamura Y., Sato M., Sakurai T., Kakudo K. (2002) Breast Cancer 9, 216–219 [DOI] [PubMed] [Google Scholar]
- 12. Park B. J., Lee S. J., Kim J. I., Lee S. J., Lee C. H., Chang S. G., Park J. H., Chi S. G. (2000) Cancer Res. 60, 3370–3374 [PubMed] [Google Scholar]
- 13. Urist M. J., Di Como C. J., Lu M. L., Charytonowicz E., Verbel D., Crum C. P., Ince T. A., McKeon F. D., Cordon-Cardo C. (2002) Am. J. Pathol. 161, 1199–1206 [DOI] [PMC free article] [PubMed] [Google Scholar]
- 14. Carroll D. K., Carroll J. S., Leong C. O., Cheng F., Brown M., Mills A. A., Brugge J. S., Ellisen L. W. (2006) Nat. Cell Biol. 8, 551–561 [DOI] [PubMed] [Google Scholar]
- 15. Adorno M., Cordenonsi M., Montagner M., Dupont S., Wong C., Hann B., Solari A., Bobisse S., Rondina M. B., Guzzardo V., Parenti A. R., Rosato A., Bicciato S., Balmain A., Piccolo S. (2009) Cell 137, 87–98 [DOI] [PubMed] [Google Scholar]
- 16. Moustakas A., Heldin C. H. (2007) Cancer Sci. 98, 1512–1520 [DOI] [PMC free article] [PubMed] [Google Scholar]
- 17. Zavadil J., Böttinger E. P. (2005) Oncogene 24, 5764–5774 [DOI] [PubMed] [Google Scholar]
- 18. Thiery J. P. (2003) Curr. Opin. Cell Biol. 15, 740–746 [DOI] [PubMed] [Google Scholar]
- 19. Hay E. D. (1995) Acta Anat. 154, 8–20 [DOI] [PubMed] [Google Scholar]
- 20. Wendt M. K., Allington T. M., Schiemann W. P. (2009) Future Oncol. 5, 1145–1168 [DOI] [PMC free article] [PubMed] [Google Scholar]
- 21. Incassati A., Patel D., McCance D. J. (2006) Oncogene 25, 2444–2451 [DOI] [PubMed] [Google Scholar]
- 22. Deleted in proof.
- 23. Soule H. D., Maloney T. M., Wolman S. R., Peterson W. D., Jr., Brenz R., McGrath C. M., Russo J., Pauley R. J., Jones R. F., Brooks S. C. (1990) Cancer Res. 50, 6075–6086 [PubMed] [Google Scholar]
- 24. Van der Haegen B. A., Shay J. W. (1993) In Vitro Cell Dev. Biol. 29A, 180–182 [DOI] [PubMed] [Google Scholar]
- 25. Carney D. N., Gazdar A. F., Bepler G., Guccion J. G., Marangos P. J., Moody T. W., Zweig M. H., Minna J. D. (1985) Cancer Res. 45, 2913–2923 [PubMed] [Google Scholar]
- 26. Debnath J., Muthuswamy S. K., Brugge J. S. (2003) Methods 30, 256–268 [DOI] [PubMed] [Google Scholar]
- 27. Draffin J. E., McFarlane S., Hill A., Johnston P. G., Waugh D. J. (2004) Cancer Res. 64, 5702–5711 [DOI] [PubMed] [Google Scholar]
- 28. Nguyen D. X., Baglia L. A., Huang S. M., Baker C. M., McCance D. J. (2004) EMBO J. 23, 1609–1618 [DOI] [PMC free article] [PubMed] [Google Scholar]
- 29. Menges C. W., Baglia L. A., Lapoint R., McCance D. J. (2006) Cancer Res. 66, 5555–5559 [DOI] [PMC free article] [PubMed] [Google Scholar]
- 30. Richardson A. L., Wang Z. C., De Nicolo A., Lu X., Brown M., Miron A., Liao X., Iglehart J. D., Livingston D. M., Ganesan G. (2006) Cancer Cell 9, 121–132 [DOI] [PubMed] [Google Scholar]
- 31. Wu G., Osada M., Guo Z., Fomenkov A., Begum S., Zhao M., Upadhyay S., Xing M., Wu F., Moon C., Westra W. H., Koch W. M., Mantovani R., Califano J. A., Ratovitski E., Sidransky D., Trink B. (2005) Cancer Res. 65, 758–766 [PubMed] [Google Scholar]
- 32. Lin Y. L., Sengupta S., Gurdziel K., Bell G. W., Jacks T., Flores E. R. (2009) PLoS Genet 5, e1000680. [DOI] [PMC free article] [PubMed] [Google Scholar] [Retracted]
- 33. Nylander K., Vojtesek B., Nenutil R., Lindgren B., Roos G., Zhanxiang W., Sjöström B., Dahlqvist A., Coates P. J. (2002) J. Pathol. 198, 417–427 [DOI] [PubMed] [Google Scholar]
- 34. Herfs M., Hubert P., Suarez-Carmona M., Reschner A., Saussez S., Berx G., Savagner P., Boniver J., Delvenne P. (2010) Am. J. Pathol. 176, 1941–1949 [DOI] [PMC free article] [PubMed] [Google Scholar]
- 35. Higashikawa K., Yoneda S., Tobiume K., Saitoh M., Taki M., Mitani Y., Shigeishi H., Ono S., Kamata N. (2009) Int. J. Cancer 124, 2837–2844 [DOI] [PubMed] [Google Scholar]
- 36. De Rosa L., Antonini D., Ferone G., Russo M. T., Yu P. B., Han R., Missero C. (2009) J. Biol. Chem. 284, 30574–30582 [DOI] [PMC free article] [PubMed] [Google Scholar]
- 37. Xu J., Lamouille S., Derynck R. (2009) Cell Res. 19, 156–172 [DOI] [PMC free article] [PubMed] [Google Scholar]
Associated Data
This section collects any data citations, data availability statements, or supplementary materials included in this article.


