

Abstract
Voltage-gated proton currents regulate generation of reactive oxygen species (ROS) in phagocytic cells. In B cells, stimulation of the B cell antigen receptor (BCR) results in the production of ROS that participate in B cell activation, but the involvement of proton channels is unknown. We report here that the voltage-gated proton channel HVCN1 associated with the BCR complex and was internalized together with the BCR after activation. BCR-induced generation of ROS was lower in HVCN1-deficient B cells, which resulted in attenuated BCR signaling via impaired BCR-dependent oxidation of the tyrosine phosphatase SHP-1. This resulted in less activation of the kinases Syk and Akt, impaired mitochondrial respiration and glycolysis, and diminished antibody responses in vivo. Our findings identify unanticipated functions for proton channels in B cells and demonstrate the importance of ROS in BCR signaling and downstream metabolism.
The strength of B cell antigen receptor (BCR) signaling is critical for the commitment of B cells to proliferation and differentiation into plasma cells1,2. BCR crosslinking by antigen results in the activation of receptor proximal protein tyrosine kinases, such as Syk (A000040) and the Src-family kinase Lyn, and the rapid phosphorylation of several protein tyrosine kinase substrate proteins, including Btk, phospholipase-Cγ2 and phosphatidylinositol-3-OH kinase, which propagate signaling through protein kinase C, the kinase Akt (A000249) and Ca2+ mobilization3,4. However, BCR stimulation also results in recruitment of negative regulators such as the tyrosine phosphatase SHP-1 (A002156), which binds to phosphorylated immunoreceptor tyrosine-based inhibitory motifs on CD22 (ref. 3). SHP-1 activity counterbalances protein kinase activity and is important for regulating BCR signaling, as exemplified by the hyper-reactive phenotype of SHP-1-mutant mice5. Therefore, initiation and transmission of the BCR signaling cascade requires not only activation of kinases but also inhibition of protein tyrosine phosphatases (PTPs)6. PTPs have a cysteine residue in their catalytic site that can be reversibly oxidized by reactive oxygen species (ROS)6, such as oxygen anions and radicals (O2•− and OH•), or milder oxidants, such as hydrogen peroxide (H2O2). ROS are actively produced by B lymphocytes after BCR stimulation7–9, and their production is similar to the oxidative burst of phagocytic cells required for microbial killing, although it is at most one-tenth the amplitude in phagocytes7–11. ROS are produced in B lymphocytes by the same enzymatic complex as in granulocytes, NADPH oxidase; in support of this are the findings that ROS production in B cells is diminished by the NADPH oxidase inhibitor diphenyleneiodonium (DPI)8 and that B cells from patients with chronic granulomatous disease, characterized by inherited mutations in genes encoding NADPH oxidase components, show the same defect in ROS production as their granulocytic cells do12. B lymphocytes express all components of the NADPH oxidase found in granulocytes: gp91phox, p22Pphox, p47phox, p67phox and p21rac (ref. 13). ROS have been shown to induce sustained tyrosine phosphorylation and subsequent B cell activation in vitro11,14, but evidence for a direct role for ROS in B cell activation in vivo has been lacking.
HVCN1 was identified as a mammalian voltage-gated proton channel through database homology searches15,16. It belongs to a family of voltage-sensor proteins17 that contain the voltage-sensor domain of voltage-gated ion channels but lack a pore-forming domain. Voltage-sensitive proton conductance is required for the oxidative burst of phagocytic cells, as the electrogenic action of the transmembrane NADPH oxidase complex consumes NADPH and oxygen to generate superoxide. The prevailing view is that without the charge compensation provided by proton currents, the transport of electrons from intracellular NADPH to extracellular or phagosomal superoxide would rapidly depolarize the membrane and inhibit NADPH activity18. Ho wever, a large spike of acidification has been identified during phagocytosis in human and mouse neutrophils, and recovery from this requires functional HVCN1 (ref. 19). When proton channels are inhibited with Zn2+ in human neutrophils, or in HVCN1-deficient mouse phagocytes, the cytoplasmic pH drops to values that directly inhibit NADPH oxidase. This result raises the possibility that, independently of compensating charge, proton channels are required to keep the pH in a range that allows NADPH oxidase activity.
Voltage-gated proton currents have been recorded in B lymphocytes20, but their role in these cells has remained elusive. In the present study we show that HVCN1 is expressed in B lymphocytes but not in T lymphocytes and has a role in B cell activation in vivo. HVCN1 associated with the BCR complex and was phosphorylated by protein kinase C after BCR stimulation. HVCN1-deficient B cells showed a defect in ROS production, which caused less signal transduction through impaired BCR-dependent oxidation of SHP-1. Although Ca2+ mobilization and activation of the mitogen-activated protein kinase Erk were not diminished, activation of Syk and Akt was impaired, thus resulting in lower metabolism and proliferation. In vivo antibody responses in HVCN1-deficient mice were impaired, and the generation of chimeric mice confirmed a B cell–autonomous defect. This work demonstrates the importance of ROS in regulating BCR signal strength and elucidates a new role for voltage-gated proton channels in B cell function.
RESULTS
Expression of HVCN1 in B lymphocytes
HVCN1 was identified as a transmembrane protein during a proteomic study of plasma membranes purified from mantle cell lymphoma cells21. We observed abundant HVCN1 expression in resting, normal human peripheral blood B cells, similar to HVCN1 expression in granulocytes (Fig. 1a). No expression was detectable by immunoblot analysis or immunohistochemistry in T cells (Fig. 1a,b, left) or in CD68+ macrophages in germinal centers (GCs; Fig. 1b, right). Expression was similar in resting, peripheral naive and memory B cells (Fig. 1c). However, primary B cells activated by CD154 in the presence of interleukin 4 (IL-4) downregulated HVCN1 within 24 h (Fig. 1d). Similarly, human tonsils showed HVCN1 expression in naive, resting B cells in the follicular mantle but downregulated HVCN1 expression in proliferating cells in GCs (Fig. 1e). We also found strong HVCN1 expression in a subset of diffuse large B cell lymphoma associated with lower proliferation (Supplementary Fig. 1a and data not shown) and in all cases of chronic lymphocytic leukemia (Supplementary Fig. 1b). Together these data illustrate that HVCN1 expression correlates with a nonproliferative status in B cells, which suggests a requirement for HVCN1 during the initial phases of B cell activation.
Figure 1.

HVCN1 protein expression in B cells. (a) Immunoblot analysis of HVCN1 expression in human peripheral granulocytes (G), B cells (B) and T cells (T) with a rabbit polyclonal antibody that recognizes a sequence in the amino-terminal domain of HVCN1 (amino acids 26–46; antibody confirmation, Supplementary Fig. 1c,d). β-actin serves as loading control throughout. Right margin, molecular sizes in kilodaltons (kDa). (b) Confocal images of paraffin-embedded tonsil sections stained with anti-HVCN1 (green) and anti-CD3 (red; T cells; left) or with anti-HVCN1 (green) and anti-CD68 (red; GC macrophages; right). Original magnification, ×20. (c,d) HVCN1 expression in human peripheral blood naive (CD27−) B cells and memory (CD27+) B cells (c) and in B cells activated on L cells expressing CD154 in the presence of IL-4 (10 ng/ml) for 24 h (d). (e) Immunohistochemistry of paraffin-embedded tonsil sections stained with anti-HVCN1 (left) or with anti-HVCN1 (green) and anti-CD20 (red; all B cells; right). FM, follicular mantle. Original magnification, ×20. Data are representative of three (a,b,e), two (c) or four (d) experiments.
Association of HVCN1 with the BCR
As HVCN1 was found on the surface of B cells21, we sought to determine whether it was associated with the BCR, first assessing if they localized together in response to BCR stimulation by confocal microscopy, electron microscopy and subcellular fractionation methods. Antigen binding to the BCR, which can be mimicked by BCR crosslinking, results in receptor capping and subsequent internalization. Internalized antigen translocates to late endosomes–early lysosomes containing major histocompatibility complex class II molecules, called major histocompatibility complex class II loading compartments (MIICs). We crosslinked surface immunoglobulin M (IgM) on primary human B cells with fluorescein isothiocyanate–labeled F(ab′)2 antibody to IgM (anti-IgM) and analyzed the subcellular localization of HVCN1 during BCR internalization by confocal microscopy. We monitored receptor internalization over 60 min looking at specific markers for MIICs, including the lysosome-associated marker LAMP-1, HLA-DR and HLA-DM. In resting B cells, HVCN1 partially localized together with the BCR on the plasma membrane (Fig. 2a). We also detected the channel in the cytosol, but at this stage, it did not localize together with markers for endosomes (EEA1; data not shown) or late endosomes-lysosomes (LAMP-1; Fig. 2a). At 5 min after stimulation, BCR and HVCN1 were capped together on the plasma membrane (Supplementary Fig. 2a). By 60 min, the BCR had internalized together with HVCN1 to MIICs, as indicated by colocalization with LAMP-1, HLA-DR and HLA-DM (Fig. 2a).
Figure 2.

Association of HVCN1 with the BCR. (a) Confocal images (left) of human peripheral blood B cells stained for LAMP-1 (blue), IgM (green) and HVCN1 (red) before activation with fluorescein isothiocyanate–conjugated F(ab′)2 anti-IgM (Time 0; top) and colocalization of IgM and HVCN1 with markers for MIICs at 60 min after activation (bottom). Original magnification, ×100. Right, quantification of colocalization coefficients (n = 39 cells), presented in a range from 0 (no colocalization) to 1 (total colocalization)53. P, Pearson's coefficient (total value of colocalization); M(x) and M(y), extent of overlap of signal x with signal y and vice versa, where x is either HVCN1 or LAMP1 and y is IgM. Each symbol represents an individual cell; small horizontal lines indicate the mean. (b) Coimmunoprecipitation of overexpressed HVCN1 and endogenous immunoglobulin-associated-β (Ig-β) in the A20 D1.3 cell line23 in nonreducing conditions with (+HEL) or without (−HEL) 30 min of stimulation with 5 μM HEL (far left) or in LK35.2 HyHEL10 cells23 in nonreducing conditions (left middle), and coimmunoprecipitation of endogenous HVCN1 and immunoglobulin-associated-β in human peripheral blood CD19+ cells in nonreducing conditions (right middle) or in the mantle cell line GRANTA 519 in reducing conditions (far right). IN, input cell lysate; IgG, negative control beads conjugated to rat IgG; IP, immunoprecipitation; IB, immunoblot; B, negative control beads; FT, flow-through (protein lysate after immunoprecipitation with immunoglobulin-associated-β). CD20, membrane protein (negative control). Data are representative of two (a) or five (b) experiments.
We also confirmed translocation of HVCN1 to MIICs by electron microscopy with overexpressed HVCN1 in B cell lymphoma cells (Supplementary Fig. 2b). To confirm that HVCN1 was translocating to MIIC compartments after BCR stimulation, we subjected Namalwa Burkitt lymphoma cells overexpressing HVCN1 to subcellular fractionation on a sucrose density gradient by ultra-centrifugation after IgM crosslinking (Supplementary Fig. 2c). This fractionation separates different organelles on the basis of their density. The less dense fractions contain endosomes (EEA1+), followed by plasma membrane, lysosomes and then mitochondria, Golgi and endoplasmic reticulum (distribution of LAMP-1 and HLA-DM in Namalwa cells at steady state, Supplementary Fig. 2c, top). These fractions did not correspond to HVCN1-containing fractions, as previously observed by confocal microscopy (Fig. 2a). However, after BCR crosslinking and receptor internalization (Supplementary Fig. 2c, bottom), the lysosomal fractions containing the majority of LAMP-1 and HLA-DM corresponded to the fractions also containing HVCN1 (Supplementary Fig. 2c, red rectangle).
As we observed simultaneous translocation of HVCN1 and the BCR, we sought to determine whether there was an association between HVCN1 and the BCR complex. The BCR complex is composed of a membrane-bound immunoglobulin molecule and the immunoglobulin-associated-α–immunoglobulin-associated-β heterodimer, functioning as signaling subunit22. We initially analyzed the coimmunoprecipitation of HVCN1 and immunoglobulin-associated-β (CD79B) in mouse B cell lines expressing transgenic IgM receptors specific for hen egg lysozyme (HEL)23 and overexpressing exogenous human HVCN1. Both HVCN1 immunoprecipitation (Fig. 2b, far left) and the reciprocal immunoprecipitation with immunoglobulin-associated-β (Fig. 2b, center left) confirmed an association between the two molecules. Stimulation of A20 B lymphoma cells expressing the D1.3 BCR (A20 D1.3 cells) with HEL did not alter the HVCN1–immunoglobulin-associated-β interaction observed at steady state (Fig. 2b, far left). We confirmed the association of HVCN1 and BCR by mass-spectrometry analysis of proteins coimmunoprecipitated with exogenous HVCN1, which included both immunoglobulin-associated-β and IgM (Supplementary Table 1). Endogenous HVCN1 interacted with immunoglobulin-associated-β in human primary B cells (Fig. 2b, center right) and the human mantle cell lymphoma line GRANTA 519 (Fig. 2b, far right), as shown by coimmunoprecipitation. The coimmunoprecipitation was specific for HVCN1, as another abundant transmembrane protein, CD20, was not associated with immunoglobulin-associated-β (Fig. 2b, far right). B cell stimulation results in the activation of downstream signaling pathways24. A pivotal step is the activation of protein kinase C24. Exogenous HVCN1 expressed in the mouse B cell line LK35.2 HyHEL10 was phosphorylated in a protein kinase C–dependent manner after BCR crosslinking with the specific antigen HEL (Supplementary Fig. 3a). Together these data suggested physical and functional interactions between HVCN1 and components of BCR signaling.
Impaired ROS production in HVCN1-deficient B cells
To investigate the function of HVCN1 in B cells in vivo, we studied a gene-trap mouse line lacking HVCN1 transcription25,26 (Supplementary Fig. 4a–c). Notably, HVCN1-deficient B cells lacked proton currents (Supplementary Fig. 4d). HVCN1-deficient mice showed no overt abnormalities in either B cell development or steady-state serum immunoglobulin titers (Supplementary Fig. 5 and data not shown), consistent with absent or low HVCN1 expression during early stages of B cell development27 (Supplementary Fig. 4c,e).
As ROS are produced after BCR activation and proton channels are involved in NADPH oxidase–dependent ROS production18, we assessed whether ROS generation was impaired in B cells lacking HVCN1. Unexpectedly, HVCN1-deficient B cells had more basal ROS than did wild-type B cells (Supplementary Fig. 6a). An inhibitor of the electron-transport chain, rotenone, diminished basal ROS in HVCN1-deficient cells to amounts similar to those seen in wild-type cells (Supplementary Fig. 6a), which suggested a mitochondrial source. In contrast, an inhibitor of NADPH oxidase, DPI, did not diminish basal ROS (Supplementary Fig. 6a), which confirmed that NADPH oxidase is not active in unstimulated B cells7–11. After stimulation, ROS production in HVCN1-deficient cells stimulated with phorbol 12-myristate 13-acetate was 70% lower than that in wild-type cells, and ROS production in HVCN1-deficient cells stimulated with F(ab′)2 anti-IgM was 60% lower than that in wild-type cells (Fig. 3a).
Figure 3.

BCR stimulation results in less BCR-dependent production of ROS and SHP-1 oxidation in the absence of HVCN1. (a) Chemiluminescent measurement of ROS after stimulation of splenic B cells with 1 μM phorbol 12-myristate 13-acetate (PMA (left); n = 5 mice) or F(ab′)2 anti-IgM (20 μg/ml (right); n = 4 mice). (b) Flow cytometry (left) of HVCN1-deficient B cells (gray line) and wild-type B cells (black line) 5 min after activation with F(ab′)2 anti-IgM conjugated to DCFDA (20 μg/ml). Gray filled histogram, antibody-labeled cells left on ice to prevent activation. Right, quantification of results at left. MFI, mean fluorescent intensity. P values, Student's t-test. (c) Measurement of ROS (assessed as DCFDA fluorescence) in wild-type and HVCN1-deficient B cells stimulated with F(ab′)2 anti-IgM conjugated to DCFDA (20 μg/ml), with (+ DPI; dashed lines) or without (solid lines) pretreatment of cells with 10 μM DPI before activation. (d) Immunoprecipitation of oxidized SHP-1 (left) from splenic B cells activated with F(ab′)2 anti-IgM (20 μg/ml). Arrow indicates biotinylated antibody heavy chains. Numbers below lanes, densitometry of streptavidin–horseradish peroxidase bands versus SHP-1 bands. Right, SHP-1 oxidation, presented relative to oxidation before stimulation. P values, Student's t-test. Data are representative of four experiments (a; mean ± s.e.m.), four separate experiments (b; average and s.d.), three experiments (c; mean ± s.e.m. of five mice), five separate experiments (d; mean and s.e.m.).
To assess whether BCR-dependent ROS were generated in the vicinity of the BCR and thus locally affected the redox state of phosphatases involved in BCR signaling, we stimulated wild-type and HVCN1-deficient B cells with an F(ab′)2 anti-IgM conjugated to the ROS-sensitive fluorescent dye DCFDA. We detected no signal in either wild-type or HVCN1-deficient B cells before stimulation. However, the DCFDA signal after stimulation was 62% lower in HVCN1-deficient cells than in wild-type cells (Fig. 3b). To confirm that NADPH oxidase was responsible for BCR-dependent generation of ROS, we treated cells with DPI before activating them with DCFDA conjugated to F(ab′)2 anti-IgM. We observed a lower signal in the presence of DPI in both wild-type and HVCN1-deficient cells (Fig. 3c), which confirmed that ROS produced locally at the BCR were generated by NADPH oxidase. To further confirm that ROS required in BCR signaling were produced by NADPH oxidase, we treated B cells with DPI before BCR stimulation and assessed protein tyrosine phosphorylation. BCR-dependent tyrosine phosphorylation was much lower when NADPH oxidase was inhibited (Supplementary Fig. 6b). Together these data indicate that HVCN1 is needed to sustain NADPH oxidase–dependent production of ROS after BCR stimulation.
Impaired BCR signaling in HVCN1-deficient B cells
The initiation of signaling cascades downstream of the BCR requires inhibition of PTPs through ROS-dependent oxidation of their catalytic site6. Because the PTP SHP-1 is recruited to the BCR after activation28, we assessed SHP-1 oxidation in wild-type and HVCN1-deficient B cells after IgM crosslinking29. Oxidation of SHP-1 was augmented in response to BCR stimulation in wild-type cells, whereas we observed no notable increase in HVCN1-deficient cells (Fig. 3d). Impaired SHP-1 inhibition was accompanied by an overall decrease in protein tyrosine phosphorylation, which was `rescued' by the SHP-1 inhibitor sodium stibogluconate30 (Fig. 4a). This compound shows selectivity for SHP-1, SHP-2 and PTP1B, although the activity is different, as 99% inhibition of SHP-1 activity is obtained at a concentration of 13.4 μM, whereas similar degrees of inhibition of SHP-2 and PTP1B require a concentration of 134 μM (ref. 30). As 99% inhibition of SHP-1 is achieved at a concentration of 13.4 μM, we used a lower dose of 5 μM to highlight differences between wild-type and HVCN1-deficient cells. Sodium stibogluconate did not affect ROS production (Supplementary Fig. 6c). To confirm that impaired BCR signaling was not due to altered pH in the endosomes after loss of HVCN1, we assessed the pH of BCR-containing endosomes; both wild-type and HVCN1-deficient cells showed a similar time frame and extent of acidification (Supplementary Fig. 7a).
Figure 4.

Absence of HVCN1 results in less tyrosine phosphorylation and impaired activation of Syk and Akt. (a) Immunoblot analysis (left) of phosphorylated tyrosine (p-Tyr) in splenic B cells activated with F(ab′)2 anti-IgM (20 μg/ml) in the absence (−SS) or presence (+SS) of 5 μM sodium stibogluconate (an inhibitor of SHP-1). Right, densitometry analysis of bands at left. Data represent the average of four separate experiments (mean and s.e.m.). (b) Immunoblot analysis of Syk phosphorylated at Tyr519 and Tyr520 (p-Syk (Y519,Y520)) in splenic B cells activated with F(ab′)2 anti-IgM (20 μg/ml) in the presence or absence of 5 μM sodium stibogluconate; below, reprobing of blots to detect total Syk. Numbers below lanes indicate densitometry of phosphorylated Syk bands versus total Syk bands. Right, Syk phosphorylation, presented relative to phosphorylation before stimulation. Data represent the average of four independent experiments (mean and s.e.m.). (c) Ca2+ mobilization in response to BCR stimulation with F(ab′)2 anti-IgM (20 μg/ml (top) or 1.5 μg/ml (bottom)), presented as the increase in intracellular Ca2+ (vertical axis) as a function of time (horizontal axis). Data are representative of seven independent experiments (reported in Supplementary Fig. 7b). (d) Immunoblot analysis of Erk phosphorylated at Thr202 and Tyr204 (p-Erk (T202,Y204)) in splenic B cells stimulated with F(ab′)2 anti-IgM (20 μg/ml (top) or 1.5 μg/ml (bottom)). Data represent three independent experiments. (e) Immunoblot analysis of Akt phosphorylated at Ser473 (p-Akt (S473)) after BCR stimulation in the presence or absence of sodium stibogluconate. Numbers below lanes indicate densitometry of phosphorylated Akt bands versus total Akt bands. Right, Akt phosphorylation, presented relative to phosphorylation before stimulation. Data represent the average of four separate experiments (mean and s.e.m.). P values, Student's t-test.
Lower SHP-1 inhibition was also accompanied by less activation of a chief SHP-1 target, the tyrosine kinase Syk31 (Fig. 4b, top); this effect was also `rescued' by sodium stibogluconate (Fig. 4b, bottom). Syk is involved in many signaling pathways downstream of BCR, leading to Ca2+ mobilization and activation of the GTPase Ras and phosphatidylinositol-3-OH kinase32,33. However, there was no decrease in Ca2+ mobilization (Fig. 4c and Supplementary Fig. 7b), and activation of Erk was normal or even greater in the absence of HVCN1 (Fig. 4d), which suggested either different thresholds for activation of this pathway or the existence of compensatory signals.
In contrast, activation of Akt was severely impaired in HVCN1-deficient cells and was also restored by treatment with sodium stibogluconate (Fig. 4e). Akt controls cell-cycle progression as well as cellular metabolism, which allows greater metabolic demands in quickly proliferating cells to be met by greater energy production and synthesis of metabolites34,35. We assessed mitochondrial respiration and glycolysis in B cells activated for 24 h with F(ab′)2 anti-IgM, using the rates of oxygen consumption and extracellular acidification, a process dependent on the extrusion of lactic acid, as an indicator of glycolysis36. After BCR stimulation, cells lacking HVCN1 showed less oxygen consumption and lactic acid production than did wild-type cells (Fig. 5a), which indicated impaired energy production in the absence of HVCN1. In contrast, stimulation with lipopolysaccharide or anti-CD40 did not produce any difference (Supplementary Fig. 7c,d) and did not induce ROS production in splenic B cells (Supplementary Fig. 7e). Consistent with a defect in cellular metabolism, HVCN1-deficient B cells showed less proliferation in vitro after stimulation with F(ab′)2 anti-IgM, as assessed by staining with the cytosolic dye CFSE (Fig. 5b,c). In contrast, there were no differences in cells stimulated with lipopolysaccharide or with anti-CD40 plus IL-4 (Supplementary Fig. 8). These results suggest a role for HVCN1 in supporting proliferation and metabolism in BCR-dependent B cell activation.
Figure 5.
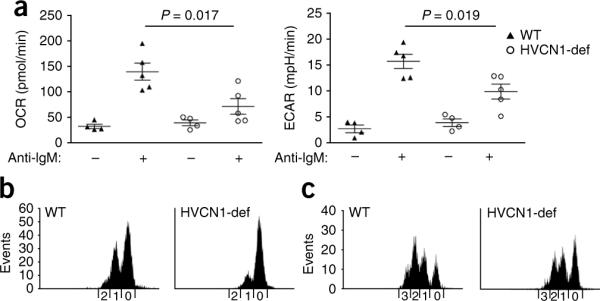
HVCN1 deficiency results in impaired cellular metabolism and proliferation in vitro. (a) Metabolic rates in wild-type and HVCN1-deficient B cells before (−) and after (+) stimulation for 24 h with F(ab′)2 anti-IgM (20 μg/ml), presented as the oxygen consumption rate (OCR) and extracellular acidification rate (ECAR; assesses lactic acid production or glycolysis). Each symbol represents an individual mouse; longer horizontal lines indicate the mean and small horizontal lines indicate the standard error. P values, Student's t-test. Data are representative of three experiments with four mice (time 0) or five mice (24 h). (b,c) CFSE staining of splenic B cells stimulated for 48 h (b) or 72 h (c) with F(ab′)2 anti-IgM (1 μg/ml) and IL-4 (20 ng/ml). Numbers along horizontal axes indicate the number of cell divisions. Data are representative of three separate experiments with similar results.
Defective antibody responses in HVCN1-deficient mice
The impaired in vitro activation of HVCN1-deficient cells suggested a defect in B cell function in vivo. Although B cell development was not affected in the absence of HVCN1, an in vivo defect in B cell responses was demonstrated in HVCN1-deficient mice challenged with two different immunogens. Antigen-specific immunoglobulin titers were lower in HVCN1-deficient mice than in their wild-type counterparts after immunization with the T cell–independent type 2 antigen NP-Ficoll (4-hydroxy-3-nitrophenylacetyl linked to the polysaccharide Ficoll) or the T cell–dependent antigen NP-KLH (4-hydroxy-3-nitrophenylacetyl linked to keyhole limpet hemocyanin; Fig. 6). The former specifically induces an extrafollicular plasmablast response, whereas the latter induces GCs as well as extrafollicular plasmablasts. The response to NP-Ficoll was lower in HVCN1-deficient mice, in serum titers of both IgM and IgG3 (Fig. 6a). The NP-KLH response showed defective isotype class-switch responses at all time points investigated (Fig. 6b,c), whereas antigen-specific IgM titers were unaffected (Fig. 6b, left). Isotype class-switching in this type of T cell–dependent response can occur both in GCs and during an extrafollicular response. Conversely, antibody affinity maturation was not impaired in HVCN1-deficient mice (Fig. 6d), which indicated that the immunoglobulin variable-region gene hypermutation and selection of high-affinity B cells that take place in the GCs37 occurred normally in the absence of HVCN1. Quantitative immunohistology of spleens from mice immunized with NP-KLH showed a diminished extrafollicular response but confirmed the unaltered numbers and sizes of NP-specific GCs (Fig. 6e), which further indicated that GC formation was not affected by the absence of HVCN1.
Figure 6.

Impaired antibody responses in HVCN1-deficient mice. (a) Anti-NP titers in mice (n = 9) immunized with 100 μg NP-Ficoll, presented in relative units (RU) as serial dilution of serum relative to antibody end-point titers. P < 0.0001, IgM, and P = 0.024, IgG3 (Mann-Whitney), and P < 0.0001, IgM, and P = 0.0054, IgG3 (two-way analysis of variance). Data are representative of QQ experiments. (b) Anti-NP titers in mice (n = 5) immunized with 100 μg NP-KLH. P < 0.05, IgG2b and IgG3 (Mann-Whitney test), and P < 0.0001, IgG2b, and P = 0.0002, IgG3 (two-way analysis of variance). Data are representative of experiments repeated twice. (c) Anti-NP IgG1 titers in mice (n = 5) immunized with 100 μg NP-KLH. P < 0.05 (Mann-Whitney test), P = 0.0002 (two-way analysis of variance). Data are representative of experiments repeated twice. (d) Affinity of IgG1 antibodies, presented as the ratio of IgG1 titers detected with NP3-BSA to those detected with NP18-BSA. Data are representative of two experiments. Each symbol (a–d) represents an individual mouse; small horizontal lines indicate the mean. (e) Immunohistochemistry (left) of serial spleen sections stained with anti-NP (blue) and anti-IgD (brown) 12 d after immunization with NP-KLH, showing NP-specific GC and extrafollicular foci of plasmacytoid cells (PC; plasmablasts and plasma cells). Original magnification, ×5. Right, quantification of plasmacytoid cells (top) and GCs (bottom). Each symbol represents an individual mouse; longer horizontal lines indicate the mean and small horizontal lines indicate the standard error. Data are representative of three experiments.
B cell-autonomous defect in antibody responses
As HVCN1 expression was not restricted to B cells in the gene-trap line, we addressed whether impaired antibody production was intrinsic to B cells by generating chimeric mice; for this, we transferred either wild-type or HVCN1-deficient bone marrow cells (20%) along with μMT bone marrow cells (80%) into lethally irradiated μMT mice (whose μMT mutation prevents the generation of B cells)38. Both groups of chimeras had similar proportions and numbers of B cells, CD4+ T cells and CD8+ T cells (data not shown), which confirmed the lack of effect of HVCN1 deficiency on early B cell development. In response to NP-KLH, HVCN1-deficient–plus–μMT chimeras had lower production of IgG1 and IgG2b antibodies than did wild-type–plus–μMT chimeras (Fig. 7a) and had fewer antigen-specific IgG1 plasmablasts in the spleen (Fig. 7b), which confirmed a B cell–autonomous defect characterized by a diminished extrafollicular response. The strength of BCR stimulation regulates whether B cells develop into extrafollicular plasma cells or form GCs2 and hence the selective loss of the extrafollicular response to NP-KLH in HVCN1-deficient mice and HVCN1-deficient–plus–μMT chimeras is consistent with the finding that HVCN1-deficient B cells are less responsive to BCR crosslinking than are their wild-type counterparts.
Figure 7.

B cell–autonomous impaired antibody responses in HVCN1-deficient mice. (a) Antibody responses to immunization with 100 μg NP-KLH in chimeric mice. Each symbol represents an individual mouse; small horizontal lines indicate the mean. P = 0.0008, IgG1, and P < 0.0001, IgG2b (Student's t-test). Data are representative of two experiments with eight wild-type mice and seven HVCN1-deficient mice. (b) Enzyme-linked immunospot analysis of splenic NP-specific IgG1 antibody–forming cells (AFC). Each symbol represents an individual mouse; longer horizontal lines indicate the mean and small horizontal lines indicate the standard error. Data are representative of two experiments with eight wild-type mice and seven HVCN1-deficient mice.
DISCUSSION
Voltage-gated proton channels have high expression in phagocytic cells, where they are necessary for NADPH oxidase–mediated production of ROS18. The generation of ROS in phagocytes is required for microbial killing and takes place at the plasma membrane; ROS are first released into the extracellular milieu, then are subsequently released in the phagosome once the microbial particle has been internalized. A similar process of antigenic internalization takes place in B cells when the BCR is engaged; this involves BCR crosslinking, followed by internalization to endosomal compartments. Like phagocytic cells, B cells show NADPH oxidase–dependent production of ROS after stimulation7,8,12. There is increasing evidence that ROS are required in signaling downstream of BCRs as well as other receptors39.
We have reported here the expression and function of the voltage-gated proton channel HVCN1, which we have shown to control ROS production after BCR stimulation in mature B cells positive for surface immunoglobulin. HVCN1 is associated with the BCR; however, the precise physical nature of the association of HVCN1 with the BCR remains unknown. We cannot exclude the possibility that the involvement of HVCN1 in B cell signaling includes interactions beyond proton permeation. Additional functions have been observed for other voltage-gated ion channels40, and further studies are needed to address this point for HVCN1. HVCN1 modulates the amount of ROS produced in B cells subsequent to BCR activation, and this has profound effects on downstream activation events. ROS have been shown to oxidize the cysteine residue (-SH) in the catalytic site of phosphatases that negatively regulate signaling41. This transient oxidation to a sulfenic acid (-SOH) allows a shift in the balance between kinases and phosphatases in favor of kinases, which permits initiation and/or propagation of the signaling cascade6. Given the results of our study, it seems that oxidation is needed to sustain signaling activation, as exemplified by the lower activation of Syk and Akt by 5 min after BCR crosslinking. The initial phases of BCR activation were probably not affected in the absence of HVCN1, as phosphatases such as SHP-1 need to be recruited to the membrane. Furthermore, some BCR-dependent production of ROS did take place in HVCN1-deficient B cells. This production allowed some initial oxidation of phosphatases and initiation of signaling, but lack of HVCN1 resulted in loss of sustained oxidation or inhibition, ultimately resulting in less overall signaling.
A difficulty in understanding the effect of ROS on phosphatases is the broad distribution of ROS in the cell, which makes it difficult to distinguish BCR-dependent production of ROS from other sources, such as mitochondria. Unexpectedly, HVCN1-deficient B cells had more total basal ROS. The considerable decrease in basal ROS after treatment with rotenone, an inhibitor of the mitochondrial electron-transport chain, suggested a mitochondrial origin. Because of the higher basal ROS in HVCN1-deficient cells, we designed a new strategy to assess ROS production locally in the vicinity of BCR, using an F(ab′)2 anti-IgM conjugated to DCFDA to stimulate the cells. The area of diffusion of these ROS is probably restricted because of the scavenging activities of glutathione, thioredoxin and reducing enzymes in the cytosol42. This localized production of ROS would then exert an effect only on phosphatases present at the BCR. Using this reagent, we did not observe any increase in steady-state ROS in HVCN1-deficient cells, which confirmed that the observed higher total basal ROS was not related to BCR-dependent generation of ROS.
SHP-1 is recruited to the BCR through interaction with CD22, where it becomes oxidized; its oxidation was lower in HVCN1-deficient cells after BCR stimulation. We also observed greater basal SHP-1 oxidation in HVCN1-deficient cells. As the source of the greater basal ROS was probably mitochondrial, the oxidized SHP-1 observed in HVCN1-deficient cells may have represented the pool of cytosolic SHP-1 exposed to this source, whereas SHP-1 recruited to the membrane after stimulation was not affected, as indicated by the finding that the initial strength of BCR activation (phosphorylated tyrosine, Syk and Akt at the 1-minute time point) was identical in both wild-type and HVCN1-deficient cells. Downstream of SHP-1, there was severe impairment in the activation of Syk and Akt in HVCN1-deficient cells. However, not all Syk downstream signaling pathways were equally impaired. Ca2+ mobilization and Erk activation were not impaired in the absence of HVCN1, possibly indicating that different thresholds of activation exist for different pathways downstream of Syk. Activation of Erk and Ca2+ can be impaired in the presence of normal Syk activation43, which suggests that other components along the pathways contribute to their overall activation. We observed more phosphorylated Erk in HVCN1-deficient cells at low concentrations of anti-IgM; however, this did not `rescue' the defect in B cell activation. Akt is known to inhibit the Raf-Erk axis44, and phosphatidylinositol-3-OH kinase inhibition results in more Erk phosphorylation, at least in certain conditions45. Akt activation stimulates both glycolysis and mitochondrial respiration46 and has been shown to regulate glycolysis in activated B lymphocytes35, but little is known about the precise molecular mechanism of this regulation and further studies are needed to clarify the role that oxidative phosphorylation might have in B lymphocyte activation. Metabolic processes are emerging as new potential targets for the treatment of cancer, including lymphoid malignancies47. Inhibition of HVCN1 and the downstream consequences on cellular metabolism might therefore constitute a new strategy for targeting BCR-dependent lymphoid tumors as well as autoimmune diseases characterized by hyper-reactive BCR signaling.
In conclusion, our data have identified a central role for the voltage-gated proton channel HVCN1 in modulating not only BCR signaling but also downstream B cell metabolism. Our data constitute the first evidence to our knowledge that proton currents are required for the generation of B cell responses in vivo. HVCN1 regulation of BCR-mediated production of ROS allows sustained activation of Syk and Akt downstream of BCR, through SHP-1 oxidative inhibition, which results in more mitochondrial respiration and glycolysis. HVCN1 may therefore represent a new therapeutic target for B cell malignancies dependent on continued signaling via the BCR48.
ONLINE METHODS
Mice and cell lines
The mouse strain used in this study was C57BL/6; 129P2-Hvcn1Gt(RRN293)Byg/Mmcd (15990-UCD; from the Mutant Mouse Regional Resource Center (a strain repository funded by the National Center for Research Resources of the National Institutes of Health) and donated to the Mutant Mouse Regional Resource Center by the BayGenomics project funded by the National Heart, Lung and Blood Institute). The exogenous gene-trap vector sequence, containing an in-frame splice-acceptor site followed by coding sequence for a β-galactosidase–neomycin fusion protein, was inserted into a large intron of 17 kilobases at approximately 12 kilobases after exon 2, which contains the first translation initiation codon. Chimeric male mice were derived from sequence-verified RRN293 gene-trap embryonic stem cells and were used to establish heterozygous WT/RRN293 founders; homozygous offspring were generated from heterozygous mating pairs. Experiments used mice with a mixed background and mice backcrossed to the C57BL/6 strain for five generations. No substantial difference was detected between mixed and C57BL/6-backcrossed mice. Experimental procedures and husbandry were carried out according to the regulations of the Home Office Scientific Procedures Act, UK (1986), with prior Home Office approval.
For the generation of mixed chimeras, lethally irradiated μMT mice received a mixture of 80% bone marrow cells of μMT origin and 20% wild-type or HVCN1-deficient bone marrow cells38. The μMT mutation prevents the generation of B cells, so the B cells in the mice that received HVCN1-deficient marrow would be HVCN1 deficient, whereas the recipients of wild-type marrow would have wild-type B cells. The 20/80 ratio favored reconstitution of all the other hematopoietic lineages from wild-type precursors.
The B lymphoma lines LK35.2 HyHEL10 (IgG2a, κ-chain; H-2kxd) and A20 D1.3 (IgG2a, κ-chain; H-2d) overexpressing recombinant mouse IgM receptors were a gift from F. Batista.
Mouse immunization
For analysis of T cell-independent responses, HVCN1-deficient and wild-type mice 8–12 weeks of age were injected intraperitoneally with 100 μg NP23-Ficoll (Biosearch Technologies). For analysis of T cell–dependent responses, 100 μg alum-precipitated NP23-KLH (Biosearch Technologies) was injected subcutaneously at the base of the tail. The μMT chimeric mice were immunized intraperitoneally with 100 μg alum-precipitated NP23-KLH at 8 weeks after bone marrow reconstitution.
Enzyme-linked immunosorbent assay
NP-specific antibodies were detected by enzyme-linked immunosorbent assay, and antibody end-point titers were used as a measure of relative concentration. For this assay, 96-well plates were coated overnight at 4 °C with NP18-BSA or NP3-BSA (10 μg/ml). Plates were then washed with 0.005% (vol/vol) Tween-20 in PBS, then they were blocked for 1 h at 37 °C with 2% (wt/vol) BSA in PBS. After washes, serially diluted serum samples were loaded onto the plates and incubated at for 1 h at 37 °C. NP-specific immunoglobulin subclasses were detected with alkaline phosphatase–conjugated secondary antibodies to IgM (1020-04), IgA (1040-04), IgG1 (1070-04), IgG2b (1090-04) and IgG3 (1100-04) and p-nitrophenyl phosphate substrate (all from Southern Biotech).
Immunohistology
Staining of NP and IgD was detected as described49. IgD was detected with sheep anti-IgD (PC013; The Binding Site) and NP-binding cells were identified with NP conjugated to rabbit IgG49. The proportion of spleen sections occupied by GCs or plasmacytoid cells was determined by a published point-counting technique50. NP-specific plasmacytoid and GC cells per mm2 were counted at a magnification of ×100 with serial sweeps of each spleen section by means of a 1-cm2 eyepiece graticule divided into areas of 100 mm2 to define the section area being counted.
Enzyme-linked immunospot assay
NP-specific antibody-forming cells were detected by enzyme-linked immunospot assay as described51.
Purification and stimulation of mouse and human B cells
B cells were purified from spleens of 8- to 12-week-old mice either by negative selection with anti-CD43 magnetic beads, with a purity of ~95%, or by positive selection with anti-B220 and anti-CD19 magnetic beads (all from Miltenyi Biotech), with a purity of ~98%. Cells were cultured in RPMI complete medium containing 10% (vol/vol) FCS, penicillin and streptomycin, L-Glutamax and 50 μM 2-mercaptoethanol.
Splenic B cells were stimulated for various times at 37 °C with goat anti-mouse IgM F(ab′)2 fragment (20 μg/ml; 115-005-075; Jackson Immunoresearch). For inhibition with DPI or sodium stibogluconate, cells were incubated at 20 °C with 5 μM DPI (Sigma Aldrich) or sodium stibogluconate (Calbiochem) before being activated with anti–mouse IgM F(ab′)2 fragment. Whole-cell lysates were sonicated briefly, then were resolved and analyzed by immunoblot with antibody to phosphorylated tyrosine (4G10; Millipore) and anti-actin (AC-15; (Sigma Aldrich) as a loading control. Antibodies to phosphorylated Syk (C87C1), Akt (D9E) and Erk (E10), and to total Syk (2712) and total Erk (L34F12), were from Cell Signaling Technology; anti-Akt (C20) was from Santa Cruz Biotechnology. Human peripheral B cells were obtained from buffy coat provided by the Sheffield Blood Bank with approval from the ethical committee of University Hospitals Leicester. Human B cells were purified from peripheral blood mononuclear cells obtained by Ficoll centrifugation of whole blood. B cells were purified by either negative selection or CD19 positive selection with magnetic beads (Miltenyi Biotech). Human CD27− and CD27+ B cells were separated with CD27 magnetic beads (Miltenyi Biotech) from B cells previously isolated by negative selection.
Mouse B cell proliferation
Cells were stimulated with the following: anti-IgM F(ab′)2 (1–20 μg/ml), anti-CD40 (2 μg/ml; HM40-3; BD Biosciences), mouse IL-4 (20 ng/ml; Peprotech) or lipopolysaccharide (10 μg/ml; Sigma Aldrich). Purified B cells were labeled for 5 min with CFSE (carboxyfluorescein diacetate succinimidyl ester; Invitrogen) and were cultured for various times thereafter. Cells were then analyzed on a FACSCanto (BD) with DIVA software.
Generation of antiserum to HVCN1
The HVCN1-specific antibody (generated by CovalAb) was a polyclonal antiserum raised in rabbits immunized with a peptide from the amino-terminal domain of human HVCN1 (amino acids 26–46). The 21-amino acid peptide has 86% homology with the mouse sequence; therefore, the antibody is expected to recognize both species, albeit with a lower affinity for the mouse homolog. For immunoblot and immuno-fluorescence analysis, anti-HVCN1 was affinity-purified from rabbit serum (specificity control, Supplementary Fig. 1).
Tissue and cell immunostaining
Tonsil tissue was cleared of paraffin and rehydrated by incubation in xylene and then was placed in industrial methylated spirits, followed by distilled water. Slides were subjected to heat-induced epitope retrieval in Tris-EDTA buffer (16 mM Tris and 6 mM EDTA, pH 9.0) and were allowed to cool gradually in ultrapure H2O. Tissue was blocked for 10 min in 3% (vol/vol) H2O2 and was washed in PBS. Antibodies applied to the sections were anti-HVCN1; anti-CD20 and anti-CD3 (LP1 and F7.2.38, respectively; both from Dako Cytomation); and anti-CD68 (generated by the K. Pulford laboratory). Slides were analyzed with a Zeiss laser-capture microscope. Use of human tissue was with approval from the ethical committee of University Hospitals Leicester.
For immunostaining of purified human B cells, cells were washed in ice-cold PBS after activation at 37 °C and were allowed to adhere to poly-L-lysine-coated slides for a few minutes before fixation in 4% (vol/vol) paraformaldehyde. After being washed, cells were incubated with primary antibodies (rabbit polyclonal anti-HVCN1 (generated in-house) and anti-EEA1 (610456), anti-HLA-DR (G46-6) and anti-HLA-DM (MaP.DM1; BD Pharmingen)) in PBS containing 10% (vol/vol) rat serum and 0.1% (wt/vol) saponin and then fluorescence-labeled secondary antibodies (Invitrogen). The DNA-intercalating dye DAPI (4,6-diamidino-2-phenylindole) was used to label nuclei before samples were mounted with ProLong Gold antifade reagent (Invitrogen). Cells were analyzed on a Zeiss laser-capture microscope at a magnification of ×100.
Flow cytometry analysis and flow sorting
Mouse cells were collected from the spleen, inguinal lymph nodes, bone marrow and peritoneal cavity. Cell phenotype was assessed by staining of cells for 1 h on ice with the following antibodies: fluorescein isothiocyanate-conjugated anti-CD21 (eBio8D9), anti-CD5 (53-7.3), anti-IgM (II/41) and anti-IgD (11–26); phycoerythrin-indotricarbocyanine-conjugated anti-CD23 (B3B4); and phycoerythrin-conjugated anti-IgM (II/41) and anti-B220 (RA3-6B2; all from eBioscience). Stained cells were analyzed on a FACSCanto (BD) with DIVA software. For analysis of HVCN1 protein expression, B cell populations were sorted on a BD FACSAria II (BD). Pro-B cell, pre-B cell and immature B cell populations were sorted from bone marrow cells purified with anti-CD19 microbeads and were stained for IgD, IgM, B220 and CD25. IgD+IgM+ mature B cells were excluded. Marginal zone cells were sorted from splenic cells purified with anti-CD19 microbeads and were stained for CD21 and CD23. B-1a cells were sorted from peritoneal cavity cells purified with anti-CD19 microbeads and were stained for IgM and CD5.
Immunoprecipitation
Cells were lysed for 15 min on ice in a solution of 1% (wt/vol) CHAPS (3-[(3-cholamidopropyl)-dimethylammonio]-1-propane sulfonate hydrate), 20 mM HEPES, pH 7.6, 137 mM NaCl, 2.5 mM NaF, 1 mM Na3O4, 2 mM EDTA and a protease inhibitor `cocktail' (Sigma Aldrich). After pelleting of nuclei and cell debris, supernatants were cleared with protein G Sepharose beads (GE Healthcare) and/or protein G Sepharose beads conjugated to mouse or rat IgG (Santa Cruz Biotechnology) before being incubated with anti-Myc (9E10; Cell Signaling Technology) or antibody to immunoglobulin-associated-β (AT107-2; Serotec) conjugated to protein G Sepharose beads. Beads were washed extensively with lysis buffer before being resuspended in 2× Laemmli buffer and analyzed by immunoblot. Nonreducing conditions were used to avoid overlap of immunoglobulin-associated-β and HVCN1 bands with light chains derived from the antibodies used for the immunoprecipitation.
Detection of ROS
Mouse B cells were prewarmed at 37 °C before addition of the chemiluminescent reagent Diogenes (National Diagnostics). After 10 min of incubation at 37 °C, phorbol 12-myristate 13-acetate (1 μM) or anti-IgM F(ab′)2 (20 μg/ml; Jackson Immunoresearch) was added to the cells and luminescence was monitored on a luminometer at 5-minute intervals. Alternatively, total ROS were measured by incubation of cells for 20 min at 20 °C in the dark with 10 μM DCFDA (2′,7′-dichlorodihydrofluorescein diacetate; Invitrogen). ROS emission was measured at 488 nm on a FACSCanto (BD) with DIVA software. For treatment with rotenone and DPI, cells were incubated with these reagents for 10 min at 20 °C before DCFDA staining. ROS production in the vicinity of BCR was detected by conjugation of an anti-IgM F(ab′)2 fragment to OxyBURST Green H2DCFDA, succinimidyl ester, according to the manufacturer's instructions (Invitrogen). Cells were then incubated for 30 min on ice with F(ab′)2 anti-IgM (20 μg/ml), then were washed and allowed to become activated at 37 °C. ROS emission was measured at 488 nm on a FACSCanto (BD) with DIVA software.
Ca2+ measurement
Ca2+ mobilization in splenic wild-type and HVCN1-deficient B cells was measured as described52.
Oxidation of SHP-1
SHP-1 oxidation was analyzed as described29, except in place of incubation with pervanadate for 1 h at 4 °C, samples were incubated with 0.4 mM PEO-iodoacetyl–biotin (PEO-IAA; Pierce). Oxidized immunoprecipitated SHP-1 was detected with horseradish peroxidase–streptavidin (GE Healthcare).
Oxygen consumption and glycolysis
The oxygen consumption rate and extracellular acidification rate were measured with a XF24 analyzer36 according to the manufacturer's recommendations (Seahorse Bioscience). Cells were activated for 24 h with F(ab′)2 anti-IgM and were cultured in a humidified incubator at 37 °C.
Statistical analysis
Student's t-test was used for statistical analysis unless otherwise specified. The software GraphPad Prism 5 was used for this analysis.
Supplementary Material
ACKNOWLEDGMENTS
We thank U. Klein for discussions; S.-D. Zhang for assistance with statistical analysis; the laboratories of P. Nicotera, G. Cohen, P. Salomoni (Medical Research Council Toxicology Unit) for reagents and discussions; K. Young for help in the acquisition and analysis of data; A. Tobin, I. Forsythe, E. Tulchinsky, M. Kriajevska, E. Raven, J. Basran and K. Brown (University of Leicester) for reagents and use of equipment; F. Batista (Cancer Research UK) and A. Knight (University of Newcastle) for the HEL-specific B cell lines A20 D1.3 and LK35.2 HyHEL10; R. Snowden and K. Topping for assistance with flow cytometry and sorting; and the Medical Research Council (G0802524) for sorter funding. Supported by the Medical Research Council, the Lymphoma Research Foundation (USA), Philip Morris and the US National Institutes of Health (HL-61437).
Footnotes
Accession codes UCSD-Nature Signaling Gateway (http://www.signaling-gateway.org): A000040, A000249 and A002156.
Note: Supplementary information is available on the Nature Immunology website.
COMPETING INTERESTS STATEMENT The authors declare no competing financial interests.
References
- 1.Batista FD, Neuberger MS. Affinity dependence of the B cell response to antigen: a threshold, a ceiling, and the importance of off-rate. Immunity. 1998;8:751–759. doi: 10.1016/s1074-7613(00)80580-4. [DOI] [PubMed] [Google Scholar]
- 2.Paus D, et al. Antigen recognition strength regulates the choice between extrafollicular plasma cell and germinal center B cell differentiation. J. Exp. Med. 2006;203:1081–1091. doi: 10.1084/jem.20060087. [DOI] [PMC free article] [PubMed] [Google Scholar]
- 3.Reth M, Brummer T. Feedback regulation of lymphocyte signalling. Nat. Rev. Immunol. 2004;4:269–277. doi: 10.1038/nri1335. [DOI] [PubMed] [Google Scholar]
- 4.Okkenhaug K, Vanhaesebroeck B. PI3K in lymphocyte development, differentiation and activation. Nat. Rev. Immunol. 2003;3:317–330. doi: 10.1038/nri1056. [DOI] [PubMed] [Google Scholar]
- 5.Zhang J, Somani AK, Siminovitch KA. Roles of the SHP-1 tyrosine phosphatase in the negative regulation of cell signalling. Semin. Immunol. 2000;12:361–378. doi: 10.1006/smim.2000.0223. [DOI] [PubMed] [Google Scholar]
- 6.Reth M. Hydrogen peroxide as second messenger in lymphocyte activation. Nat. Immunol. 2002;3:1129–1134. doi: 10.1038/ni1202-1129. [DOI] [PubMed] [Google Scholar]
- 7.Maly FE, et al. The superoxide generating system of B cell lines. Structural homology with the phagocytic oxidase and triggering via surface Ig. J. Immunol. 1988;140:2334–2339. [PubMed] [Google Scholar]
- 8.Maly FE, et al. Superoxide-dependent nitroblue tetrazolium reduction and expression of cytochrome b-245 components by human tonsillar B lymphocytes and B cell lines. J. Immunol. 1989;142:1260–1267. [PubMed] [Google Scholar]
- 9.Leca G, et al. Respiratory burst in human B lymphocytes. Triggering of surface Ig receptors induces modulation of chemiluminescence signal. J. Immunol. 1991;146:3542–3549. [PubMed] [Google Scholar]
- 10.Maly FE, et al. Oxidative burst in human Epstein-Barr virus-transformed B-cell lines triggered by immobilized specific antigen. Scand. J. Immunol. 1990;32:661–667. doi: 10.1111/j.1365-3083.1990.tb03208.x. [DOI] [PubMed] [Google Scholar]
- 11.Singh DK, et al. The strength of receptor signaling is centrally controlled through a cooperative loop between Ca2+ and an oxidant signal. Cell. 2005;121:281–293. doi: 10.1016/j.cell.2005.02.036. [DOI] [PubMed] [Google Scholar]
- 12.Volkman DJ, Buescher ES, Gallin JI, Fauci AS. B cell lines as models for inherited phagocytic diseases: abnormal superoxide generation in chronic granulomatous disease and giant granules in Chediak-Higashi syndrome. J. Immunol. 1984;133:3006–3009. [PubMed] [Google Scholar]
- 13.Jones OTG, Jones SA, Wood JD. Expression of components of the superoxide generating NADPH oxidase by human leucocytes and other cells. Protoplasma. 1995;184:1–4. [Google Scholar]
- 14.Wienands J, Larbolette O, Reth M. Evidence for a preformed transducer complex organized by the B cell antigen receptor. Proc. Natl. Acad. Sci. USA. 1996;93:7865–7870. doi: 10.1073/pnas.93.15.7865. [DOI] [PMC free article] [PubMed] [Google Scholar]
- 15.Ramsey IS, Moran MM, Chong JA, Clapham DE. A voltage-gated proton-selective channel lacking the pore domain. Nature. 2006;440:1213–1216. doi: 10.1038/nature04700. [DOI] [PMC free article] [PubMed] [Google Scholar]
- 16.Sasaki M, Takagi M, Okamura Y. A voltage sensor-domain protein is a voltage-gated proton channel. Science. 2006;312:589–592. doi: 10.1126/science.1122352. [DOI] [PubMed] [Google Scholar]
- 17.Murata Y, Iwasaki H, Sasaki M, Inaba K, Okamura Y. Phosphoinositide phosphatase activity coupled to an intrinsic voltage sensor. Nature. 2005;435:1239–1243. doi: 10.1038/nature03650. [DOI] [PubMed] [Google Scholar]
- 18.DeCoursey TE, Morgan D, Cherny VV. The voltage dependence of NADPH oxidase reveals why phagocytes need proton channels. Nature. 2003;422:531–534. doi: 10.1038/nature01523. [DOI] [PubMed] [Google Scholar]
- 19.Morgan D, et al. Voltage-gated proton channels maintain pH in human neutrophils during phagocytosis. Proc. Natl. Acad. Sci. USA. 2009;106:18022–18027. doi: 10.1073/pnas.0905565106. [DOI] [PMC free article] [PubMed] [Google Scholar]
- 20.Schilling T, Gratopp A, DeCoursey TE, Eder C. Voltage-activated proton currents in human lymphocytes. J. Physiol. (Lond.) 2002;545:93–105. doi: 10.1113/jphysiol.2002.028878. [DOI] [PMC free article] [PubMed] [Google Scholar]
- 21.Boyd RS, et al. Protein profiling of plasma membranes defines aberrant signaling pathways in mantle cell lymphoma. Mol. Cell. Proteomics. 2009;8:1501–1515. doi: 10.1074/mcp.M800515-MCP200. [DOI] [PMC free article] [PubMed] [Google Scholar]
- 22.Rolli V, et al. Amplification of B cell antigen receptor signaling by a Syk/ITAM positive feedback loop. Mol. Cell. 2002;10:1057–1069. doi: 10.1016/s1097-2765(02)00739-6. [DOI] [PubMed] [Google Scholar]
- 23.Batista FD, Neuberger MS. B cells extract and present immobilized antigen: implications for affinity discrimination. EMBO J. 2000;19:513–520. doi: 10.1093/emboj/19.4.513. [DOI] [PMC free article] [PubMed] [Google Scholar]
- 24.Weiss A, Littman DR. Signal transduction by lymphocyte antigen receptors. Cell. 1994;76:263–274. doi: 10.1016/0092-8674(94)90334-4. [DOI] [PubMed] [Google Scholar]
- 25.Okochi Y, Sasaki M, Iwasaki H, Okamura Y. Voltage-gated proton channel is expressed on phagosomes. Biochem. Biophys. Res. Commun. 2009;382:274–279. doi: 10.1016/j.bbrc.2009.03.036. [DOI] [PubMed] [Google Scholar]
- 26.Ramsey IS, Ruchti E, Kaczmarek JS, Clapham DE. Hv1 proton channels are required for high-level NADPH oxidase-dependent superoxide production during the phagocyte respiratory burst. Proc. Natl. Acad. Sci. USA. 2009;106:7642–7647. doi: 10.1073/pnas.0902761106. [DOI] [PMC free article] [PubMed] [Google Scholar]
- 27.Hystad ME, et al. Characterization of early stages of human B cell development by gene expression profiling. J. Immunol. 2007;179:3662–3671. doi: 10.4049/jimmunol.179.6.3662. [DOI] [PubMed] [Google Scholar]
- 28.Cornall RJ, et al. Polygenic autoimmune traits: Lyn, CD22, and SHP-1 are limiting elements of a biochemical pathway regulating BCR signaling and selection. Immunity. 1998;8:497–508. doi: 10.1016/s1074-7613(00)80554-3. [DOI] [PubMed] [Google Scholar]
- 29.Persson C, et al. Preferential oxidation of the second phosphatase domain of receptor-like PTP-α revealed by an antibody against oxidized protein tyrosine phosphatases. Proc. Natl. Acad. Sci. USA. 2004;101:1886–1891. doi: 10.1073/pnas.0304403101. [DOI] [PMC free article] [PubMed] [Google Scholar]
- 30.Pathak MK, Yi T. Sodium stibogluconate is a potent inhibitor of protein tyrosine phosphatases and augments cytokine responses in hemopoietic cell lines. J. Immunol. 2001;167:3391–3397. doi: 10.4049/jimmunol.167.6.3391. [DOI] [PubMed] [Google Scholar]
- 31.Dustin LB, et al. Expression of dominant-negative src-homology domain 2-containing protein tyrosine phosphatase-1 results in increased Syk tyrosine kinase activity and B cell activation. J. Immunol. 1999;162:2717–2724. [PubMed] [Google Scholar]
- 32.Kurosaki T. Molecular mechanisms in B cell antigen receptor signaling. Curr. Opin. Immunol. 1997;9:309–318. doi: 10.1016/s0952-7915(97)80075-1. [DOI] [PubMed] [Google Scholar]
- 33.Beitz LO, Fruman DA, Kurosaki T, Cantley LC, Scharenberg AM. SYK is upstream of phosphoinositide 3-kinase in B cell receptor signaling. J. Biol. Chem. 1999;274:32662–32666. doi: 10.1074/jbc.274.46.32662. [DOI] [PubMed] [Google Scholar]
- 34.Fox CJ, Hammerman PS, Thompson CB. Fuel feeds function: energy metabolism and the T-cell response. Nat. Rev. Immunol. 2005;5:844–852. doi: 10.1038/nri1710. [DOI] [PubMed] [Google Scholar]
- 35.Doughty CA, et al. Antigen receptor-mediated changes in glucose metabolism in B lymphocytes: role of phosphatidylinositol 3-kinase signaling in the glycolytic control of growth. Blood. 2006;107:4458–4465. doi: 10.1182/blood-2005-12-4788. [DOI] [PMC free article] [PubMed] [Google Scholar]
- 36.Wu M, et al. Multiparameter metabolic analysis reveals a close link between attenuated mitochondrial bioenergetic function and enhanced glycolysis dependency in human tumor cells. Am. J. Physiol. Cell Physiol. 2007;292:C125–C136. doi: 10.1152/ajpcell.00247.2006. [DOI] [PubMed] [Google Scholar]
- 37.MacLennan IC. Germinal centers. Annu. Rev. Immunol. 1994;12:117–139. doi: 10.1146/annurev.iy.12.040194.001001. [DOI] [PubMed] [Google Scholar]
- 38.Fillatreau S, Gray D. T cell accumulation in B cell follicles is regulated by dendritic cells and is independent of B cell activation. J. Exp. Med. 2003;197:195–206. doi: 10.1084/jem.20021750. [DOI] [PMC free article] [PubMed] [Google Scholar]
- 39.Finkel T. Oxidant signals and oxidative stress. Curr. Opin. Cell Biol. 2003;15:247–254. doi: 10.1016/s0955-0674(03)00002-4. [DOI] [PubMed] [Google Scholar]
- 40.Kaczmarek LK. Non-conducting functions of voltage-gated ion channels. Nat. Rev. Neurosci. 2006;7:761–771. doi: 10.1038/nrn1988. [DOI] [PubMed] [Google Scholar]
- 41.Meng TC, Fukada T, Tonks NK. Reversible oxidation and inactivation of protein tyrosine phosphatases in vivo. Mol. Cell. 2002;9:387–399. doi: 10.1016/s1097-2765(02)00445-8. [DOI] [PubMed] [Google Scholar]
- 42.Lopez-Mirabal HR, Winther JR. Redox characteristics of the eukaryotic cytosol. Biochim. Biophys. Acta. 2008;1783:629–640. doi: 10.1016/j.bbamcr.2007.10.013. [DOI] [PubMed] [Google Scholar]
- 43.Patterson HC, Kraus M, Kim YM, Ploegh H, Rajewsky K. The B cell receptor promotes B cell activation and proliferation through a non-ITAM tyrosine in the Igα cytoplasmic domain. Immunity. 2006;25:55–65. doi: 10.1016/j.immuni.2006.04.014. [DOI] [PubMed] [Google Scholar]
- 44.Zimmermann S, Moelling K. Phosphorylation and regulation of Raf by Akt (protein kinase B) Science. 1999;286:1741–1744. doi: 10.1126/science.286.5445.1741. [DOI] [PubMed] [Google Scholar]
- 45.Kodiha M, Banski P, Stochaj U. Interplay between MEK and PI3 kinase signaling regulates the subcellular localization of protein kinases ERK1/2 and Akt upon oxidative stress. FEBS Lett. 2009;583:1987–1993. doi: 10.1016/j.febslet.2009.05.011. [DOI] [PubMed] [Google Scholar]
- 46.Gottlob K, et al. Inhibition of early apoptotic events by Akt/PKB is dependent on the first committed step of glycolysis and mitochondrial hexokinase. Genes Dev. 2001;15:1406–1418. doi: 10.1101/gad.889901. [DOI] [PMC free article] [PubMed] [Google Scholar]
- 47.Jones RG, Thompson CB. Tumor suppressors and cell metabolism: a recipe for cancer growth. Genes Dev. 2009;23:537–548. doi: 10.1101/gad.1756509. [DOI] [PMC free article] [PubMed] [Google Scholar]
- 48.Kuppers R. Mechanisms of B-cell lymphoma pathogenesis. Nat. Rev. Cancer. 2005;5:251–262. doi: 10.1038/nrc1589. [DOI] [PubMed] [Google Scholar]
- 49.Luther SA, Gulbranson-Judge A, Acha-Orbea H, MacLennan IC. Viral superantigen drives extrafollicular and follicular B cell differentiation leading to virus-specific antibody production. J. Exp. Med. 1997;185:551–562. doi: 10.1084/jem.185.3.551. [DOI] [PMC free article] [PubMed] [Google Scholar]
- 50.Weibel E. Principles and methods for the morphometric study of the lung and other organs. Lab. Invest. 1963;12:131–155. [PubMed] [Google Scholar]
- 51.Xiang Z, et al. FcγRIIb controls bone marrow plasma cell persistence and apoptosis. Nat. Immunol. 2007;8:419–429. doi: 10.1038/ni1440. [DOI] [PubMed] [Google Scholar]
- 52.Chen J, et al. CD22 attenuates calcium signaling by potentiating plasma membrane calcium-ATPase activity. Nat. Immunol. 2004;5:651–657. doi: 10.1038/ni1072. [DOI] [PubMed] [Google Scholar]
- 53.Manders MM, Verbeek PJ, Aten JA. Measurement of co-localization of objects in dual color confocal images. J. Microsc. 1993;169:375–382. doi: 10.1111/j.1365-2818.1993.tb03313.x. [DOI] [PubMed] [Google Scholar]
Associated Data
This section collects any data citations, data availability statements, or supplementary materials included in this article.