Abstract
Müller cells serve many functions including the regulation of extracellular glutamate levels. The product of two genes, Slc1a3 [aka solute carrier family 1 (glial high affinity glutamate transporter), member 3] and Glul (aka glutamine synthetase) are the primary role players that transport glutamate into the Müller cell and convert it into glutamine. In this study, we sought to identify the genetic regulation of both genes. Given their tightly coupled biological functions, we predicted that they would be similarly regulated. Using an array of 75 recombinant inbred strains of mice, we determined that Slc1a3 and Glul are differentially regulated by distinct chromosomal regions. Interestingly, despite their independent regulation, gene ontology analysis of tightly correlated genes reveals that the enriched and statistically significant molecular function categories of both directed acyclic graphs have substantial overlap, indicating that the shared functions of correlates of Slc1a3 and Glul include production and usage of ATP.
Keywords: Müller cell, Glutamine synthetase, Glial high affinity glutamate transporter, QTL mapping, Gene ontology
Introduction
The vertebrate retina is a highly complex tissue comprised of multiple neuronal types and Müller glial cells. The physiological role of the retina is to convert visual signals that are initiated at the level of the photoreceptor outer segment to electrical stimuli that are relayed to the visual cortex of the brain. This is accomplished using neurotransmitters as the means of communication between synaptically connected neurons. As in all neurons, neurotransmitters in the retina are produced in the presynaptic cells after which time they are stored in vesicles, ready to be released. Upon receiving the proper stimulation, the vesicles fuse with the presynaptic membrane and the neurotransmitter is released into the synaptic cleft. After crossing the small distance to the postsynaptic cell, the neurotransmitter binds to its receptor, thus propagating the signal. The primary neurotransmitter in the vertical pathway of the retina is glutamate, which is used by photoreceptors, bipolar cells and ganglion cells [1–6].
Glutamate, a proteinogenic amino acid, is synthesized from ammonium and alpha-ketoglutarate, a component of the Kreb’s cycle. Cells use glutamate to synthesize other amino acids, proteins and other neurotransmitters such as gamma-Aminobutyric acid (aka GABA) [7]. In its role as a neurotransmitter, glutamate stimulates and depolarizes its post-synaptic cell. Because glutamate is a ubiquitous and highly abundant excitatory neurotransmitter, its extracellular levels must be very tightly regulated to prevent neurotoxicity. Within retinal neurons that use glutamate, the intracellular concentration is approximately 5 mM [2]. However, only micromolar levels of glutamate are required to stimulate receptors on post-synaptic membranes. Therefore the amount released at the synaptic cleft is several orders of magnitude higher than necessary, which can be neurotoxic.
Müller cells play a critical role in buffering extracellular glutamate levels and their physical location supports this function very well. With their nuclei present in the inner nuclear layer, Müller cells extend processes that envelope retinal neurons and their processes across the entire thickness of the retina from the photoreceptor inner segment to the axons of ganglion cells [8]. It is only at synapses that neurons have direct contact with other neurons; Müller cells fill the extraneuronal space providing a physical and functional buffer. Using a well-developed mechanism, Müller cells remove toxic levels of extracellular glutamate and convert it to glutamine [9].
Within the retina, five high affinity glutamate transporters have been cloned: excitatory amino acid transporter (EEAT)-1, EAAT-2, EAAT-3, EAAT-4 and EAAT-5 [10–15]. EEAT-2 through −5 are localized to retinal neurons. In contrast, EEAT-1, which has many synonyms including Slc1a3 and GLAST, has been localized to the plasma membranes of Müller cells [16–19]. Here Slc1a3 actively transports glutamate into Müller cells along with three Na+ ions. In exchange for the intracellular transport, K+ and OH−/HCO− are transported to the extracellular space [20–22]. It is important to note that the function of Slc1a3 is tightly coupled to Na/K ATPase [23], which balances the ionic gradients across the Müller cell membrane. Although Müller cells transport large amounts of glutamate intracellularly, they do not immunolabel with anti-glutamate antibodies [6]. This is because the glutamate is rapidly converted into glutamine by the enzyme glutamine synthetase, encoded by Glul, which is subsequently exported from the glia for recycling by neighboring neurons back into glutamate [24, 25].
The purpose of this investigation was to combine the power of RI strains of mice and systems genetics approaches to identify the genetic networks that regulate and are regulated by Slc1a3 and Glul, the genes that encode for Slc1a3 and glutamine synthetase, respectively, the two Müller cell expressed proteins that are responsible for buffering extracellular glutamate. Recombinant inbred (RI) mice are a very useful resource to identify the genetic basis of a phenotype, including the regulation of transcript levels. We have expanded the original BXD RI panel that was generated at the Jackson Laboratory by inbreeding of siblings from C57BL/6 J (B6) and DBA2/J (D2) parents by including additional strains of mice from advanced crosses [26]. Collectively, these mice comprise the largest RI mouse panel available [26–28]. Each BXD line is a discrete population with fixed genotypes at each locus and the parental B6 and D2 alleles segregating among the strains. Because individuals within each RI line are isogenic, the genotype of each line can be used to develop a map of complex traits ranging from DNA variation to phenotype [29]. Using eQTL mapping, we were able to identify genetic regions that regulate the expression levels of both genes. We also constructed GO directed acyclic graphs for both transcripts individually as well as shared correlates. Using this methodology we determined that although each GOTM graph has unique categories relating to the particular functions of each gene product, there are many shared correlates that focus on ATP production and usage.
Materials and Methods
BXD RI Mice
Throughout this study, mice were handled in a manner consistent with the ARVO Statement for the Use of Animals in Ophthalmic and Vision Research, the Guide for the Care and Use of Laboratory Animals (Institute of Laboratory Animal Resources, the Public Health Service Policy on Humane Care and Use of Laboratory Animals). All studies were approved by the Animal Care and Use review board of the University of Tennessee Health Science Center. Our goal was to obtain data for independent biological samples for a least two animals of each sex for all BXD strains. Collectively, our data represent a well-balanced sample of males and females belonging to 75 strains, but without within-strain-by-sex replication. A total of 316 adult mice of both genders were utilized: 300 BXD mice (two male and two female from each of 75 BXD strains); eight mice from parental strains (two male and two female from B6 and D2); and eight F1 hybrid mice (two male and two female from each F1 hybrid mating). Animals were weaned at 25 days of age and housed in same-sex cages with 2–5 mice per cage until the day of sacrifice. Animals had free access to standard laboratory chow and water and were maintained on a 12:12 light/dark cycle. Room temperature ranged from 20 to 24°C.
Tissue and Sample Processing
Mice aged 48–118 days were sacrificed by rapid cervical dislocation. Retinas were removed immediately. Two retinas per mouse were immersed in RNALater and stored in a single tube overnight at 4°C. The next day the retinas were transferred to the −80°C for long-term storage. Total RNA was prepared from the retinal tissue with RNA-Stat-60 as described by the manufacturer (Tel-Test, Friendswood, TX). The concentration of the RNA solution was determined by measuring the absorbance at 260 nm with the NanoDrop 1000A Spectrophotometer (NanoDrop Technologies, Inc., Wilmington, USA). The quality and purity of RNA was assessed using an Agilent Bioanalyzer 2100 system to assess the relative quantities of 18S and 28S RNA, as well as the RNA integrity.
Biotinylation of cRNA, Hybridization and Array Platform
Total RNA (150 ng) was processed with the Illumina TotalPrep RNA Amplification Kit (Ambion, Austin, TX) to produce biotinylated cRNAs, according to the manufacturer’s protocol. This procedure included the reverse transcription of RNA to synthesize the 1st strand cDNA, 2nd strand cDNA synthesis, cDNA purification, in vitro transcription to synthesize cRNA, and the cRNA purification and amplification. The concentration of the cRNA solution was determined by measuring the absorbance at 260 nm using the NanoDrop 1000A Spectrophotometer. The biotinylated cRNAs (1.5 ug/sample) were hybridized to Illumina Sentrix® Mouse WG-6 v2.0 arrays (Illumina, San Diego, CA) for 19.5 h at 58°C according to the manufacturer’s instructions. The Illumina Sentrix® Mouse WG-6 v2.0 arrays possess probes that have 29-mer address-sequence and 50-mer gene-specific sequence to interrogate approximately 46,000 sequences from the mouse transcriptome. The 29-mer was used in the decoding process in order to determine what bead type was present at each location on the array. The Illumina Bead Array confocal scanner and Illumina BeadStudio Gene Expression module (version 3.3.7) were used to scan the BeadChips and monitor the hybridization signals. The quality of the hybridization and overall processing of the BeadChip was monitored by visual inspection of both the internal quality control checklist and raw scanned data.
Data Processing
Quality control analysis of raw image data was performed using the Illumina BeadStudio software. In addition, MIAME standards were used for all microarray data and technical replicates were averaged before computing the mean for independent biological samples [30]. Rank invariant normalization with BeadStudio software was used to calculate the data. Once this data was collected, the data was globally normalized across in a four step process: (1) computation of the log base two of each raw signal value; (2) calculation of the mean and standard deviation of each Mouse WG-6 v2.0 array; (3) normalization of each array using the formula 2 (z-score of log2 [intensity]); and (4) computation of the mean of the values for the set of micro-arrays for each strain. This process generates arrays with means of 8, variances of four, and standard deviations of two. An advantage of this method is that a two-fold difference in expression level corresponds approximately to a 1-unit difference. The units for these measurements are arbitrary, and are used in our study for measuring proportional changes in expression. Expression levels below seven are typically close to background noise levels.
Expression QTL (eQTL) Mapping
On the Illumina Sentrix® Mouse WG-6 v2.0 array each of our genes of interest was represented by a single probe set: Slc1a3 was represented by ILMN_2634317 (located at Chr 15, 8.584165 Mb) and Glul was represented by ILMN_ 2644496 (located at Chr 1 155.756755 Mb). Our previous experience has shown us that SNP position and the number of SNPs overlapping with the probe sets has a significant impact on the detection of cis-acting expression differences. Therefore, before performing the eQTL analysis, we looked for SNPs in the region of each transcript to which each probe set bound and determined that no SNPs were present in the region of hybridization (data not shown).
eQTL mapping was performed using our web-based complex trait analysis engine (GeneNetwork; www.genenetwork.org) using QTL reaper software [31]. This methodology uses regression analysis to determine the relationship between differences in a trait and differences in alleles at markers across the genome. Because BXD24 has a documented severe and early onset retinal degeneration due to a spontaneous mutation in CEP290 [32], we removed expression data of this strain prior to our analyses to prevent any skewing that may occur. Simple interval mapping was carried out at regular chromosomal intervals to identify potential QTLs that regulate Slc1a3 and Glul expression levels and estimate the significance at each location using known genotype data for those sites. We also used composite interval mapping to factor out a portion of the genetic variance produced by any major QTLs and detect potential secondary QTL(s) that might otherwise be masked. Each of these analyses produced a likelihood ratio statistic (LRS) score, providing us with a measure of confidence in the linkage between our observed phenotype—in this case, Slc1a3 and Glul expression levels—and known genetic markers. The genome-wide significance for each QTL was established using a permutation test that compared the LRS of our novel site with the LRS values for 1,000 genetic permutations. This method is well established as a means of deterling probability of chance versus true genetic linkage [33]. Candidate regulatory genes were identified based upon LRS scores, mean expression levels and the presence of single-nucleotide polymorphisms (SNPs).
Correlation Analysis and Gene Ontology (GO) Analysis
The transcript level of each of our genes of interest, i.e., Slc1a3 or Glul, was compared to that of all 43,000 probe sets across the mouse genome to produce sets of genetically correlated genes. Genetic correlative analysis was calculated using Spearman’s rank correlations using links on GeneNetwork. The top 2,000 correlated transcripts for each candidate were selected. After removing Riken clones, putative intergenic sequences and predicted genes, the remaining list of transcripts with mean expression levels greater than 7 were uploaded to the Gene Ontology Tree Machine (GOTM) (http://bioinfo.vanderbilt.edu/gotm) [34] via a link on GeneNetwork. GOTM is a public tool for GO enrichment analysis. It allows users to input lists of highly correlated genes through the web interface, identifies GO terms that are significantly associated with the input gene lists, and visualizes the enriched GO terms in a directed acyclic graph (DAG). The P values generated from the hypergeometric test were automatically adjusted to account for multiple comparisons using the Benjamini and Hochberg correction [35] as implemented in GOTM.
Results
Probe Sets and Variation of Slc1a3 and Glul Expression Levels in Eyes of BXD Mice
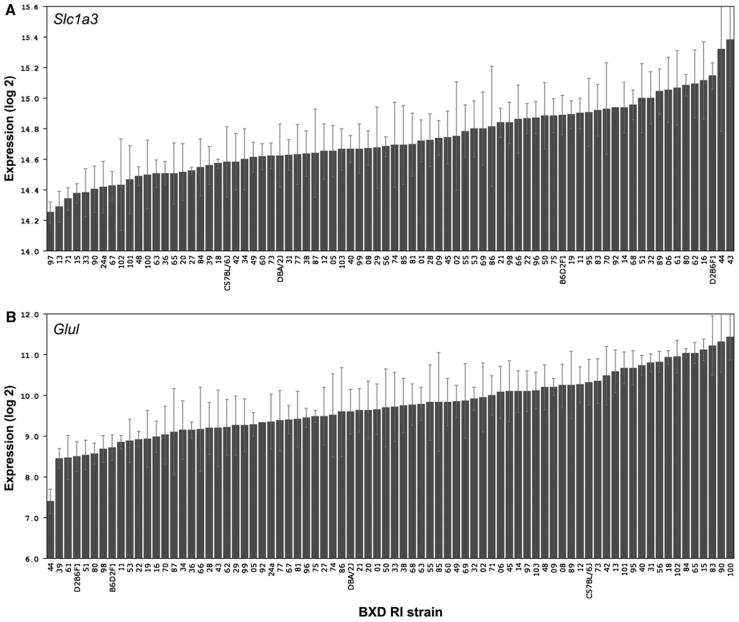
The binding of Slc1a3 to the array varied significantly among the BXD strains. The average expression level of Slc1a3 in the BXD strains was 14.73 ± 0.03 (mean ± SEM) and ranged from a low of 14.25 ± 0.07 in BXD97 to a high of 15.38 ± 0.31 in BXD43 (Fig. 1a). In the B6 parental strain, Slc1a3 had an average expression level of 14.58 ± 0.23, which did not differ statistically from that in the D2 parental strain (expression level of 14.62 ± 0.21; P > 0.05). Similarly, the binding of Glul varied significantly among the RI strains. The average expression level was 9.73 ± 0.09 and ranged between 7.40 ± 0.30 (BXD44) and 11.42 ± 0.56 (BXD100: Fig. 1b). The expression levels of the B6 and D2 parental strains were 10.32 ± 0.55 and 9.60 ± 0.55, respectively, which were not significantly different (P > 0.05).
Fig. 1.
Expression levels of Slc1a3 (a) and Glul (b) across strains. a The rank ordered mean Slc1a3 levels across 75 BXD RI strains, their parental strains and F1 crosses shows a range of expression values from 14.25 to 15.38. b Rank ordered mean expression values for Glul range from 7.40 to 11.42. Values denote normalized relative expression levels on a log 2 scale (mean ± SEM)
eQTL Mapping
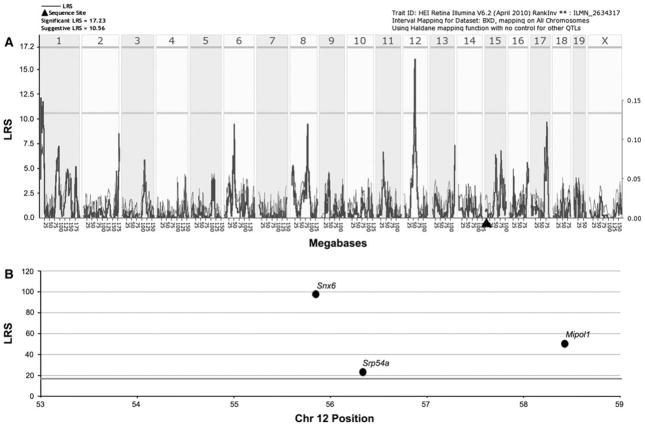
Through marker regression and simple interval mapping of Slc1a3, we found a single suggestive eQTL for Slc1a3 (LRS = 16) on Chr 12 between 53 and 59 Mb, making it a trans-eQTL. There were no significant LRS peaks near the location of Slc1a3 itself (Fig. 2a). Using the search capabilities of GeneNetwork, we identified three genes with significant LRS scores that mapped as cis-eQTLs at the location of the LRS peak on Chr 12 (Fig. 2b). Each of these genes is a potential candidate for controlling the level of expression of Slc1a3. Based upon expression levels in the eye and abundance of SNPs in each gene, the most likely candidates were Snx6 and Srp54a, as Mipol1 was devoid of SNPs and had expression levels at or below background levels. Composite interval mapping revealed no secondary loci that modulate Slc1a3 expression levels (not shown).
Fig. 2.
Graphic illustration of genomic regions and candidate genes that regulate Slc1a3 expression. a A suggestive trans-eQTL for Scl1a3 is present on Chr 12 centered at 56 Mb. The bold line illustrates the LRS scores across the genome. Horizontal lines mark the transcript-specific significance thresholds for significant (LRS = 17.23) and suggestive (LRS = 10.56). Filled triangle = location of Slc1a3 in the genome. b The top candidates within the trans-QTL region are illustrated by chromosomal position and LRS scores
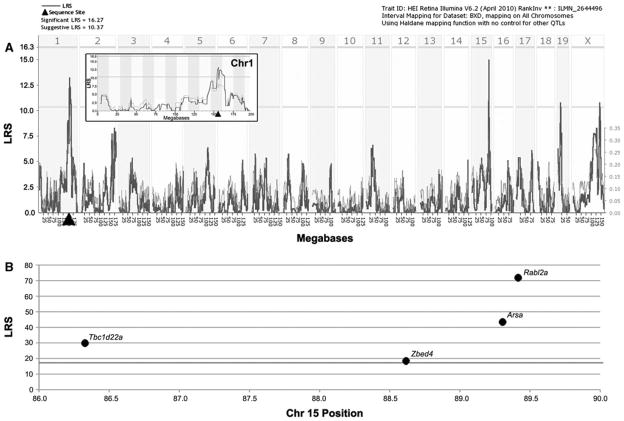
Using identical methodologies, we found two suggestive eQTLs for controlling Glul expression. The first eQTL on Chr 1at 155.7 Mb was at the position of the gene itself (Fig. 3a and inset in 3a), making it a cis-eQTL. The second eQTL was on Chr 15 between 86 and 90 Mb, making it a trans-eQTL. Using the search capabilities of GeneNetwork, we identified four genes—Tbc1d22a, Zbed4, Arsa and Rabl2a—with significant LRS scores that mapped as a cis-QTL at the location of the trans-eQTL (Fig. 3b). Based upon their respective expression levels and the presence of SNPs, the most likely candidates for regulating Glul expression levels are Tbc1d22a and Rabl2a. In addition to having significant LRS scores, both transcripts had high expression levels and multiple SNPs between the parental strains. Composite interval mapping revealed no secondary loci that modulate Glul expression levels (not shown).
Fig. 3.
Graphic illustration of genomic regions and candidate genes that regulate Glul expression. a Two suggestive eQTLs for controlling Glul expression levels are present. The first, on Chr 1 at the position of the gene itself, is a cis-QTL. The inset is a higher magnification view of the LRS tracing on Chr 1 confirming the presence of the cis-QTL. The second eQTL is on Chr 15 centered at 88 Mb. The bold line illustrates the LRS scores across the genome. Horizontal lines mark the transcript-specific significance thresholds for significant (LRS = 16.27) and suggestive (LRS = 10.37). Filled triangle = location of Glul in the genome. b The top candidates within the trans-QTL region are illustrated by chromosomal position and LRS scores
GO Analysis
After filtering the top 2,000 transcripts with expression levels that correlated with Slc1a3, a list of 1,622 transcripts was submitted for GOTM analysis and a set of very compact directed acyclic graphs were produced. Shown in Fig. 4 is the graph that clustered the transcripts according to molecular function. The molecular function categories that were statistically significant were “binding”, “nucleic acid binding”, “RNA binding”, “nucleoside binding”, “catalytic activity”, “nucleotide binding”, “purine nucleotide binding”, “ribonucleotide binding”, and “purine ribonucleotide binding”. All of the categories were highly significant (10 of 10; 100%) and contained many genes (minimum of 96, maximum 1,098).
Fig. 4.
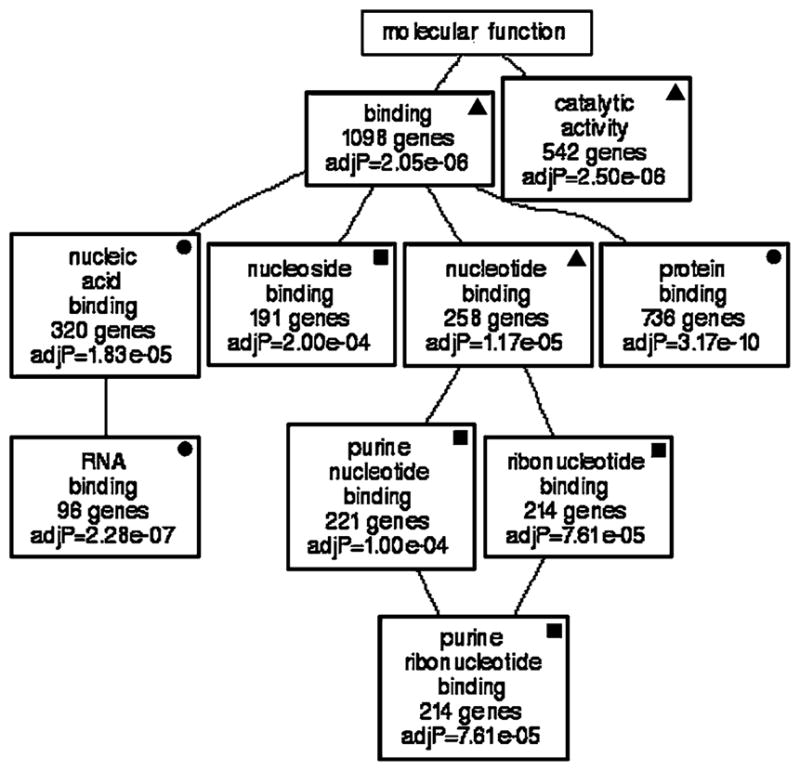
Genetic associations with Slc1a3. GO analysis illustrates that the majority of molecular functions to which transcripts correlated with Slc1a3 expression belong include nucleoside, and purine ribonucleotide binding. All enriched categories show statistical significance (P values are listed in each box). Filled circle = GO category that is present in GOTM generated from top correlates of Slc1a3 and Glul. Filled square = GO category that is present in GOTM generated from top correlates of Slc1a3 and shared correlates. Filled triangle = GO category that is present in GOTM generated from top correlates of Slc1a3, Glul and shared correlates
A list of 1,629 transcripts whose expression levels correlated with Glul was submitted for GO analysis. The compact directed acyclic graph that clustered the transcripts according to molecular function is shown in Fig. 5. Several of the statistically significant categories in the graph of Glul correlates was also present in the graph constructed from Slc1a3 correlates. The significant non-redundant molecular function categories were “phosphoric ester hydrolase activity”, “ligase activity, forming carbon–nitrogen bonds”, “amino acid ligase activity” and “ubiquitin–protein ligase activity”. The majority of the categories were highly significant (10 of 14; 71%) and contained many genes (minimum of 28, maximum 1,088).
Fig. 5.
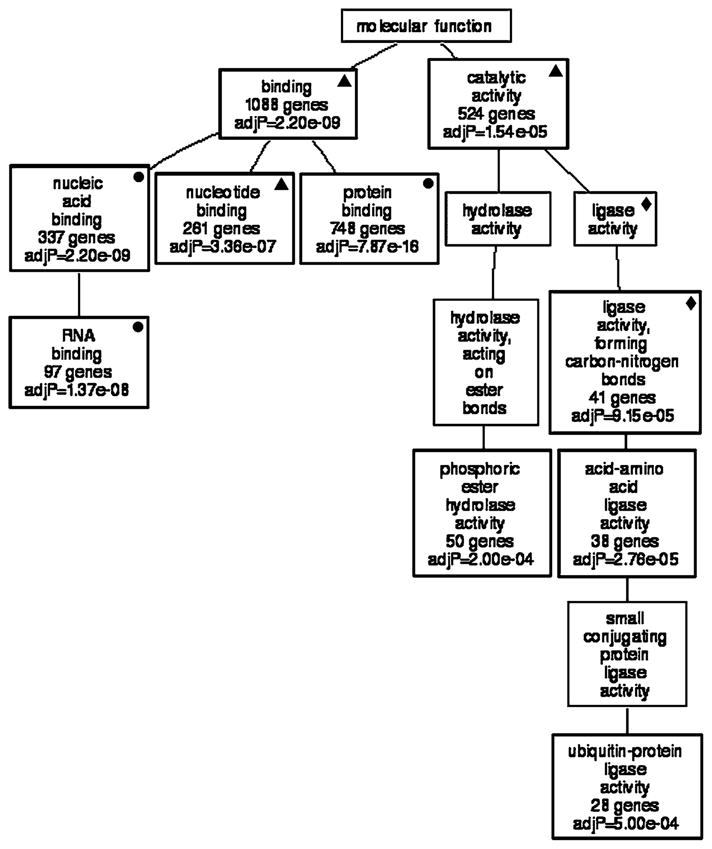
Genetic associations with Glul. GO analysis illustrates that the majority of molecular functions to which transcripts correlated with Glul expression belong include “phosphoric ester hydrolase activity” and “ligase activity forming carbon–nitrogen bonds”. Fifty-seven percent of the enriched categories show statistical significance (P values are listed in each box). Filled circle = GO category that is present in GOTM generated from top correlates of Slc1a3 and Glul. Filled diamond = GO category that is present in GOTM generated from top correlates of Glul and shared correlates. Filled triangle = GO category that is present in GOTM generated from top correlates of Slc1a3, Glul and shared correlates
We then mined both correlate lists for shared transcripts. GOTM analysis of the list of 105 shared transcripts yielded a directed acyclic graph that shared many categories that were generated from transcripts that correlated with Slc1a3 and/or Glul (Fig. 6). The major difference was that the graph derived from the shared correlates contained a few additional categories, such as “ATP binding genes” that expanded upon those found in Figs. 4 and 5. The majority of the categories were highly significant (10 of 13; 77%) and contained many genes (minimum of 7, maximum 28).
Fig. 6.
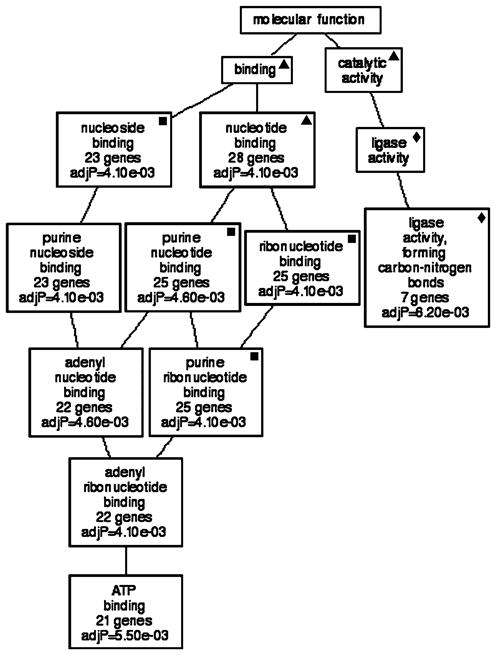
Genetic associations with correlates shared by Slc1a3 and Glul. GO analysis illustrates that the majority of molecular functions to which transcripts correlated with the expression of shared correlates belong include “ligase activity, forming carbon–nitrogen bonds” and “ATP binding”. Sixty-nine percent of the enriched categories show statistical significance (P values are listed in each box). Filled square = GO category that is present in GOTM generated from top correlates of Slc1a3 and shared correlates. Filled diamond = GO category that is present in GOTM generated from top correlates of Glul and shared correlates. Filled triangle = GO category that is present in GOTM generated from top correlates of Slc1a3, Glul and shared correlates
Discussion
Both Scl1a3 and Glul are critical Müller cell genes and their gene products are required for maintaining glutamate levels at non-toxic levels in the retina. Scl1a3 transports glutamate into Müller cells away from the synaptic terminals of neighboring neurons where it can be harmful. Within the cytoplasm of the Müller cell glutamine sythetase then converts the imported glutamate to non-toxic glutamine, which can be recycled to glutamate once transported back to retinal neurons [24, 25]. Our study has demonstrated that although the functions of these two gene products are highly synergistic, the genes are independently controlled—Slc1a3 expression is controlled by trans-eQTL on Chr 12, whereas Glul expression is self-regulated in addition to being controlled by a trans-eQTL on Chr 15. We’ve identified two plausible candidates in each trans-locus that may that may be responsible for modulating Slc1a3 and Glul expression levels. This small number of candidates can be easily evaluated through typical molecular biology experiments. These data are presented with the caveat that approximately 25% of the genes have significant cis-QTL and therefore using this strategy, we may be underestimating the list of potential regulatory loci.
The function of Slc1a3 is tightly coupled to Na/K ATPase [23], a ubiquitous membranous enzyme that functions to maintain the resting membrane potential of the cell, among other things. In exchange for the transport of three Na+ molecules to the extracellular space, two K+ ions are transported to the intracellular compartment [36]. This transport of Na+ and K+ is critical for balancing the exchange of ions that is coupled to the transport of glutamate by Slc1a3. Moreover, this active movement of molecules across the Müller cell membrane is fueled by the hydrolysis of ATP. In mammals, the Na/K ATPase is responsible for 1/3–2/3 of the energy consumption of the cell. The export of Na+ from the cell due to the Na/K ATPase provides the driving force used the secondary active transporters, such as Slc1a3, to import other molecules, such as glutamate [36] (Fig. 7).
Fig. 7.
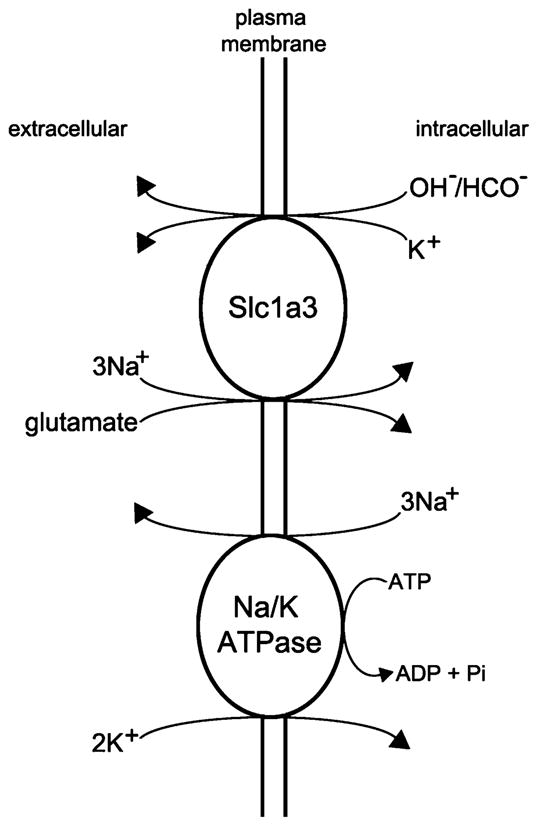
Cartoon illustrating the transport of glutamate into the Müller cell. Slc1a3 transports one molecule of glutamate along with three molecules of Na+ into the intracellular compartment in exchange for one molecule of K+ and one molecule of OH− or HCO−. This exchange is fueled by the electrochemical gradients for Na+ and K+ that are generated by the Na/K ATPase, which “costs” the cell one ATP molecule
Given the large energy requirement necessary for the primary and secondary active transport of glutamate into Müller cells, it is expected that the purine ribonucleotide binding transcripts are highly enriched in our GOTM analysis. This category includes molecules that bind ATP, GTP, cAMP and cGMP. Moreover the enzymes that participate in the de novo synthesis of purine nucleotides—Gart (trifunctional purine biosynthetic protein adeosine-3), Paics (phosphoribosylaminoimidazole carboxylase), Atic (bifunctional purine biosynthesis protein PURH), Prps1 (phosphoribosyl pyrophosphate synthetase) and Prpp (phosphoribosyl pyrophosphate) [37–39]—are all present in our list of correlates.
After being transported into the Müller cell, glutamate is enzymatically converted into glutamine via the reaction that is illustrated in Fig. 8. The conversion of glutamate to glutamine by glutamine synthetase occurs via an acyl-phosphate intermediate containing and ester linkage [40]. This activity is reflected in the enriched category in our GOTM analysis of “phosphoric ester hydrolase activity”. Another role of glutamine synthetase that is a consequence of the glutamate to glutamine conversion is that of nitrogen metabolism [41]. This activity is reflected in the enriched category of “ligase activity, forming carbon–nitrogen bonds”. Further along in that same branch of the GOTM graph is the enriched category of “ubiquitin-protein ligase activity”. This family of enzymes is involved in ubiquitin-mediated proteolysis and in Parkinson’s [42] and Huntington’s diseases [43]. While glutamine synthetase has not been genetically linked to either of these diseases, mutations in the Glul gene have resulted in severe neurological compromise and marked brain attenuation resulting in death by one month of age [44].
Fig. 8.
Enzymatic reaction showing the conversion of glutamate to glutamine by glutamine synthetase. The overall chemical reaction for the reaction is Glutamate + ATP + NH3 → Glutamine + ADP + phosphate + H2O. During the reaction, an ATP molecule is expended, an acyl-phosphate intermediate containing and ester link
In an attempt to determine if there are genetic pathways that are co-regulated by Slc1a3 and Glul, we mined the individual lists of genetic correlates and generated a list of 105 transcripts that were common to both lists. The molecular function GOTM graph that was generated from this list obviously shared many of the characteristics of both parent trees. The “ligase activity, forming carbon nitrogen bonds” enriched category was maintained with a subset of the genes that were present in the graph generated from Glul correlates. Also “purine nucleotide binding” function was maintained within the shared subset of transcripts. Importantly the branch of the graph that refined the “purine nucleotide binding” now included enriched categories of ATP binding genes, confirming that the regulation of ATP is an important feature of GOTM molecular function graphs generated from correlates of both Slc1a3 and Glul.
In summary, although Slc1a3 and Glul and their gene products are functionally related, they are controlled by genetically distinct mechanisms. Despite the independent regulation, many genes that are transcriptionally correlated are also functionally related.
Those categories of shared transcripts include a small number of genes that function via forming carbon–nitrogen bonds and a larger number of genes that function via binding of ATP. These data demonstrate that the shared functions of Slc1a3 and Glul center around the currency of cellular energy. Given that the transport of glutamate and the production of glutamine require a large input of ATP to fuel the process, these results make biological sense.
Acknowledgments
NIH Grants EY021200, EY017814, AA014425, AA017590, DA021131; NEI Core Grant P30EY013080; An Unrestricted Grant from Research to Prevent Blindness, New York, NY.
Contributor Information
Monica M. Jablonski, Email: mjablonski@uthsc.edu, Department of Ophthalmology, Hamilton Eye Institute, University of Tennessee Health Science Center, 930 Madison Avenue, Suite 731, Memphis, TN 38163, USA
Natalie E. Freeman, Department of Ophthalmology, Hamilton Eye Institute, University of Tennessee Health Science Center, 930 Madison Avenue, Suite 731, Memphis, TN 38163, USA
William E. Orr, Department of Ophthalmology, Hamilton Eye Institute, University of Tennessee Health Science Center, 930 Madison Avenue, Suite 731, Memphis, TN 38163, USA
Justin P. Templeton, Department of Ophthalmology, Hamilton Eye Institute, University of Tennessee Health Science Center, 930 Madison Avenue, Suite 731, Memphis, TN 38163, USA
Lu Lu, Department of Anatomy and Neurobiology, University of Tennessee Health Science Center, Memphis, TN, USA.
Robert W. Williams, Department of Anatomy and Neurobiology, University of Tennessee Health Science Center, Memphis, TN, USA
Eldon E. Geisert, Department of Ophthalmology, Hamilton Eye Institute, University of Tennessee Health Science Center, 930 Madison Avenue, Suite 731, Memphis, TN 38163, USA
References
- 1.Ehinger B, Ottersen OP, Storm-Mathisen J, Dowling JE. Bipolar cells in the turtle retina are strongly immunoreactive for glutamate. Proc Natl Acad Sci. 1988;85:8321–8325. doi: 10.1073/pnas.85.21.8321. [DOI] [PMC free article] [PubMed] [Google Scholar]
- 2.Marc RE, Liu W-LS, Kalloniatis M, Raiguel SF, Van Haesendonck E. Patterns of glutamate immunoreactivity in the goldfish retina. J Neurosci. 1990;10:4006–4034. doi: 10.1523/JNEUROSCI.10-12-04006.1990. [DOI] [PMC free article] [PubMed] [Google Scholar]
- 3.Van Haesendonck E, Missotten L. Glutamate-like immunoreactivity in the retina of a marine teleost, the dragonet. Neurosci Lett. 1990;111:281–286. doi: 10.1016/0304-3940(90)90275-e. [DOI] [PubMed] [Google Scholar]
- 4.Kalloniatis M, Fletcher EL. Immunocytochemical localization of the amino acid neurotransmitters in the chicken retina. J Comp Neurol. 1993;336:174–193. doi: 10.1002/cne.903360203. [DOI] [PubMed] [Google Scholar]
- 5.Yang C-Y, Yazulla S. Glutamate-, GABA-, and GAD-immunoreactivities co-localize in bipolar cells of tiger salamander retina. Vis Neurosci. 1994;11:1193–1203. doi: 10.1017/s0952523800006994. is formed and in the final product new carbon–nitrogen bonds are created by hydrolysis of the ester bonds. All of these steps are reflected in the enriched molecular function categories present in Fig. 5
- 6.Jojich L, Pourcho RG. Glutamate immunoreactivity in the cat retina: a quantitative study. Vis Neurosci. 1996;13:117–133. doi: 10.1017/s0952523800007173. [DOI] [PubMed] [Google Scholar]
- 7.Stryer L. Biochemistry. 3. W.H. Freeman and Co; New York: 1988. [Google Scholar]
- 8.Cajal SR. In: The Structure of the retina. Thorpe SA, Glickstein M, translators. Thomas; Springfield, IL: 1892. 1972. [Google Scholar]
- 9.Reichenbach A, et al. What do retinal Müller (glial) cells do for their neuronal ‘small siblings’? J Chem Neuroanat. 1993;6:201–213. doi: 10.1016/0891-0618(93)90042-3. [DOI] [PubMed] [Google Scholar]
- 10.Kanai Y, Hediger MA. Primary structure and functional characterization of a high-affinity glutamate transporter. Nature. 1992;360:467–471. doi: 10.1038/360467a0. [DOI] [PubMed] [Google Scholar]
- 11.Pines G, et al. Cloning and expression of a rat brain L-glutamate transporter. Nature. 1992;360:464–467. doi: 10.1038/360464a0. [DOI] [PubMed] [Google Scholar]
- 12.Fairman WA, Vandengerg RJ, Arriza JL, Kavanaugh MP, Amara SG. An excitatory amino-acid transporter with properties of a ligand-gated chloride channel. Nature. 1995;375:599–603. doi: 10.1038/375599a0. [DOI] [PubMed] [Google Scholar]
- 13.Schultz K, Stell WK. Immunocytochemical localization of the high-affinity glutamate transporter, EAAC1, in the retina of representative vertebrate species. Neurosci Lett. 1996;211:191–194. doi: 10.1016/0304-3940(96)12762-2. [DOI] [PubMed] [Google Scholar]
- 14.Arriza JL, Eliasof S, Kavanaugh MP, Amara SG. Excitatory amino acid transporter 5, a retinal glutamate transporter coupled to a chloride conductance. Proc Natl Acad Sci USA. 1997;94:4155–4160. doi: 10.1073/pnas.94.8.4155. [DOI] [PMC free article] [PubMed] [Google Scholar]
- 15.Kanai Y, Trotti D, Nussberger S, Hediger MA. The high-affinity glutamate transporter family, structure, function, and physiological relevance. In: Reith MEA, editor. Neurotransmitter transporters: structure, function, and regulation. Totowa, NJ: Humana Press; 1997. [Google Scholar]
- 16.Otori Y, et al. Marked increase in glutamate-aspartate transporter (GLAST/GluT-1) mRNA following transient retinal ischemia. Mol Brain Res. 1994;27:310–314. doi: 10.1016/0169-328x(94)90014-0. [DOI] [PubMed] [Google Scholar]
- 17.Derouiche A, Rauen T. Coincidence of L-glutamate/L-aspartate transporter (GLAST) and glutamine synthetase (GS) immunoreactions in retinal glia: evidence for coupling of GLAST and GS in transmitter clearance. J Neurosci Res. 1995;42(1):131–143. doi: 10.1002/jnr.490420115. [DOI] [PubMed] [Google Scholar]
- 18.Rauen T, Rothstein JF, Wassle H. Differential expression of three glutamate transporter subtypes in the rat retina. Cell Tissue Res. 1996;286:325–336. doi: 10.1007/s004410050702. [DOI] [PubMed] [Google Scholar]
- 19.Lehre KP, Davanger S, Danbolt NC. Localization of the glutamate transporter protein GLAST in rat retina. Brain Res. 1997;744:129–137. doi: 10.1016/s0006-8993(96)01022-0. [DOI] [PubMed] [Google Scholar]
- 20.Brew H, Attwell D. Electrogenic glutamate uptake is a major current carrier in the membrane of axolotl retinal glial cells. Nature. 1987;327:707–709. doi: 10.1038/327707a0. [DOI] [PubMed] [Google Scholar]
- 21.Barbour B, Brew H, Attwell D. Electrogenic glutamate uptake in glial cells is activated by intracellular potassium. Nature. 1988;335:433–435. doi: 10.1038/335433a0. [DOI] [PubMed] [Google Scholar]
- 22.Bouvier M, Szatkowski M, Amato A, Attwell D. The glial cell glutamate uptake carrier countertransports pH-changing ions. Nature. 1992;360:471–474. doi: 10.1038/360471a0. [DOI] [PubMed] [Google Scholar]
- 23.Gegelashvili M, Rodriguez-Kern A, Sung L, Shimamoto K, Gegelashvili G. Glutamate transporter GLAST/EAAT1 directs cell surface expressio of FXYD1/gamma subunit of Na, K ATPase in human fetal astrocytes. Neurochem Int. 2007;50:916–920. doi: 10.1016/j.neuint.2006.12.015. [DOI] [PubMed] [Google Scholar]
- 24.Hertz L. Functional interactions between neurons and astrocytes I. Turnover and metabolism of putative amino acid transmitters. Prog Neurobiol. 1979;13:277–323. doi: 10.1016/0301-0082(79)90018-2. [DOI] [PubMed] [Google Scholar]
- 25.Pow DV, Crook DK. Direct immunocytochemical evidence for the transfer of glutamine from glial cells to neurons: use of specific antibodies directed against the d-stereoisomers of glutamate and glutamine. Neuroscience. 1996;70(1):295–302. doi: 10.1016/0306-4522(95)00363-n. [DOI] [PubMed] [Google Scholar]
- 26.Peirce JL, Lu L, Gu J, Silver LM, Williams RW. A new set of BXD recombinant inbred lines from advanced intercross populations. BMC Genetics. 2004;5:7. doi: 10.1186/1471-2156-5-7. [DOI] [PMC free article] [PubMed] [Google Scholar]
- 27.Williams RW, Airey DC, Kulkarni A, Zhou G, Lu L. Genetic dissection of the olfactory bulbs of mice: QTLs on four chromosomes modulate bulb size. Behav Genet. 2001;31(1):61–77. doi: 10.1023/a:1010209925783. [DOI] [PubMed] [Google Scholar]
- 28.Geisert EE, et al. Gene expression in the mouse eye: an online resource for genetics using 103 strains of mice. Mol Vis. 2009;15:1730–1763. [PMC free article] [PubMed] [Google Scholar]
- 29.Cambien F, Tiret L. Atherosclerosis: from genetic polymorphisms to system genetics. Cardiovasc Toxicol. 2005;5:143–152. doi: 10.1385/ct:5:2:143. [DOI] [PubMed] [Google Scholar]
- 30.Irizarry RA, et al. Summaries of Affymetrix GeneChip probe level data. (Translated from eng) Nucleic Acids Res. 2003;31(4):e15. doi: 10.1093/nar/gng015. (in eng) [DOI] [PMC free article] [PubMed] [Google Scholar]
- 31.Chesler EJ, et al. Complex trait analysis of gene expression uncovers polygenic and pleiotropic networks that modulate nervous system function (Translated from eng) Nat Genet. 2005;37(3):233–242. doi: 10.1038/ng1518. in eng. [DOI] [PubMed] [Google Scholar]
- 32.Chang B, et al. In-frame deletion in a novel centrosomal/ciliary protein CEP290/NPHP6 perturbs its interaction with RPGR and results in early-onset retinal degeneration in the rd16 mouse. Hum Mol Genet. 2006;15:1847–1857. doi: 10.1093/hmg/ddl107. [DOI] [PMC free article] [PubMed] [Google Scholar]
- 33.Churchill GA, Doerge RW. Empirical threshold values for quantitative trait mapping. Genetics. 1994;138:963–971. doi: 10.1093/genetics/138.3.963. [DOI] [PMC free article] [PubMed] [Google Scholar]
- 34.Zhang B, Schmoyer D, Kirov S, Snoddy J. GOTree machine (GOTM): a web-based platform for interpreting sets of interesting genes using gene ontology hierarchies (Translated from eng) BMC Bioinformatics. 2004;5:16. doi: 10.1186/1471-2105-5-16. in eng. [DOI] [PMC free article] [PubMed] [Google Scholar]
- 35.Benjamini Y, Hochberg Y. Controlling the false discovery rate: a practical and powerful approach to multiple testing. J R Statist Soc B. 1995;57(1):289–300. [Google Scholar]
- 36.Alberts B, et al. Molecular Biology of the Cell. 4. Garland Publishing, Inc; New York: 2002. [Google Scholar]
- 37.Sanchez RA, Ferris JP, Orgel LE. Studies in prebiotic synthesis. II. Synthesis of purine precursors and amino acids from aqueous hydrogen cyanide. J Mol Biol. 1967;30:223–253. [PubMed] [Google Scholar]
- 38.Sanchez RA, Ferris JP, Orgel LE. Studies in prebiotic synthesis. IV. Conversion of 4-aminoimidazole-5-carbonitrile derivatives to purines. J Mol Biol. 1968;38:121–128. doi: 10.1016/0022-2836(68)90132-0. [DOI] [PubMed] [Google Scholar]
- 39.Ferris JP, Kuder JE, Catalano AW. Photochemical reactions and the chemical evolution of purines and nicotinamide derivatives. Science. 1969;166:765–766. doi: 10.1126/science.166.3906.765. [DOI] [PubMed] [Google Scholar]
- 40.Tsuda Y, Stephani RA, Meister A. Formation of an acyl phosphate by glutamine synthetase. Biochemistry. 1971;10:3186–3189. doi: 10.1021/bi00793a004. [DOI] [PubMed] [Google Scholar]
- 41.Liaw SH, Kuo I, Eisenberg D. Discovery of the ammonium substrate site on glutamine synthetase, a third cation binding site. Protein Sci. 1995;4:2358–2365. doi: 10.1002/pro.5560041114. [DOI] [PMC free article] [PubMed] [Google Scholar]
- 42.Shimura H, et al. Familial Parkinson disease gene product, parkin, is a ubiquitin-protein ligase. Nat Genet. 2000;25:302–305. doi: 10.1038/77060. [DOI] [PubMed] [Google Scholar]
- 43.Ortega Z, Diaz-Hernandez M, Lucas JJ. Is the ubiquitin-proteasome system impaired in Huntington’s disease? Cell Molec Life Sci. 2007;64:2245–2257. doi: 10.1007/s00018-007-7222-8. [DOI] [PMC free article] [PubMed] [Google Scholar]
- 44.Haberle J, et al. Congenital glutamine deficiency with glutamine synthetase. New Eng J Med. 2005;353:1926–1933. doi: 10.1056/NEJMoa050456. [DOI] [PubMed] [Google Scholar]


