Abstract
Aim
To evaluate whether the histology and grading of solitary pulmonary nodules (SPNs) correlated with the results of dynamic multiphase multidetector CT (MDCT) and the [18F]fluorodeoxyglucose standardised uptake value (SUV) in 30 patients.
Methods
Chest x-rays of 270 patients with incidentally detected SPNs were retrospectively evaluated. Thirty patients with histologically proven SPNs were enrolled. On MDCT and positron emission tomography (PET)/CT images, two experts measured the density of nodules in all perfusion phases and the SUV. Net enhancement (NE) was calculated by subtracting peak pre-contrast density from peak post-contrast density. The Pearson test was used to correlate nodule NE, SUV, grading, histology and diameter.
Results
Of the 30 malignant SPNs, six were classified as G1 (median NE, 31.5 Hounsfield units (HU); median SUV, 4.8 units), 15 were classified as G2 (median NE, 49 HU; median SUV, 6 units), and nine were classified as G3 (median NE, 32 HU; median SUV, 4.5 units). A highly negative correlation was found in G3 SPNs between NE and the corresponding diameters (r=−0.834; p=0.00524). NE increased with the increase in diameter (r=0.982; p=0.284). SUV increased as the SPN diameter increased (r=0.789; p=0.421). NE and SUV were higher in G2 than G1 SPNs, and lower in G2 than G3 SPNs (r=0.97; p=0.137).
Conclusions
The significant correlation in dedifferentiated (G3) SPNs between NE and diameter (r=−0.834; p=0.00524) supports the theory that stroma and neoangiogenesis are fundamental in SPN growth. The highly negative correlation between NE and diameter demonstrates a net decrease in perfusion despite an increase in dimension. The multidisciplinary approach used herein may result in a more precise prognosis and consequently a better therapeutic outcome, particularly in patients with undifferentiated lung cancer.
Keywords: Angiogenesis, diagnostics, histopathology, lung cancer, tumour angiogenesis
Introduction
Characterisation of solitary pulmonary nodules (SPNs) is a major clinical and radiological concern; in fact, the overall incidence of malignancy in SPNs is 30–40% of cases.1–7 In the USA, ∼150 000 SPNs are detected each year with a progressive positive trend due to incidental findings on chest CT, which is widely used in oncological screening and follow-up.
SPNs are first detected on chest radiography. CT, [18F]fluorodeoxyglucose (FDG) positron emission tomography (PET) and MRI are subsequently used to distinguish between benign and malignant nodules.8–12 The prevalence of malignancy in SPNs correlates with SPN dimensions: 0–1% in 5 mm nodules; 6–28% in nodules of 5–10 mm; 64–82% in nodules over 20 mm.2 Various radiological studies have shown that the histopathology of SPNs varies greatly, and malignancies account for about 60–80% of cases.6 13–15
The aim of this study was to evaluate whether there was a correlation between the histology and grading of SPNs and the results of dynamic multiphase multidetector CT (MDCT) and the 18F-FDG standardised uptake value (SUV) in 30 patients.
Materials and methods
The chest x-rays of 270 patients with incidentally detected SPNs (10–30 mm) were retrospectively evaluated. From these, the imaging sets of 153 patients who underwent MDCT and PET/CT within 30 days of chest x-rays were selected. Forty-eight of these patients had multiple lung nodules, whereas MDCT data were incomplete in 34. Forty-one SPNs <3 cm with a typical pattern of benign lesions such as macrocalcifications or a cystic pattern were excluded. Thus, 123 patients were excluded from the study. In conclusion, 30 patients (24 men, six women, mean age 67 years, range 54–86) were included in the study.
Image acquisition
All images were acquired with a 16-slice scanner (Brilliance 16; Philips, Eindhoven, The Netherlands) using 120 kV, 300 mA, 16×1.25 pitch, 2 mm-thick slice and 1 mm gap. A pre-contrast acquisition followed by multiple post-contrast scans were obtained using dynamic acquisitions at 1, 2, 3 and 4 min after intravenous administration of 1.5 ml/kg non-ionic iodinated contrast medium (NICM; 350 mg/ml iodine). Three-dimensional PET was performed from feet to head 60 min after intravenous administration of 18F-FDG (4.5 MBq/kg). An integrated PET/CT scanner (Biograph 16; Siemens, Erlangen, Germany) consisting of an ultrafast CT scanner, with a 16-row multislice detector system, and a PET scanner, equipped with a full-ring lutetium oxyorthosilicate system and a crystal size of 4.4 mm2, was used.
CT was performed in spiral mode. Data acquisition began with CT using 120 kV, 110–115 mA, 2 mm pitch and 1 s tube rotation, and these data were used for the correction of densitometric values of attenuation. Emission scan bed time was 3 min, resulting in a total PET scan time of 20–25 min (seven or eight bed positions), with axial image planes at a 16.2 cm axial field-of-view per position. After attenuation and scatter correction of PET data, images were reconstructed using an attenuation-weighted ordered-subsets maximisation expectation approach with two iterations and eight subsets on a 128×128 matrix and 5 mm Gaussian post-filtering.
Image analysis
All CT images were re-evaluated using a workstation, and densitometric measurements of SPNs were recorded in all contrastographic phases. To standardise recording values, a region of interest was drawn inside nodules, avoiding calcified inclusions, vessels, bronchogram or colliquative areas. Densitometry was evaluated along the equatorial plane of each lesion to cover almost 70% of the lesion. Net enhancement (NE) was evaluated by subtracting pre-contrast density from the peak density obtained from post-contrast values. PET/CT images were reconstructed on a Leonardo (Siemens Medical Solutions) workstation. A lesion was considered positive on the basis of visual judgement of the degree of increased glucose metabolism relating to mediastinum activity by two experienced, independent interpreters, supported by semiquantitative evaluation based on the calculation of the SUV of 18F-FDG-PET.
Statistical analysis
The correlation between dimensions, enhancement, SUV, grading and histological findings of SPNs was determined with the Pearson test; a correlation was defined when p<0.05 with 2 degrees of freedom.
Results
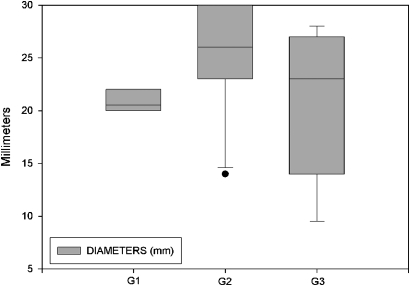
As shown in table 1, morphological evaluation of SPNs revealed spiculated margins in 24/30 (72.8%) nodules and lobulated margins in 6/30 (26.2%). SPN diameter was 21–30 mm in 22/30 (73%) patients, 11–20 mm in 7/30 (23%) and <11 mm in 1/30 (4%). The median diameter of G1, G2 and G3 SPNs was 20.5 mm, 26 mm and 23 mm, respectively (figure 1). The histological diagnosis was lung cancer in all 30 patients: adenocarcinoma in 18/30 (60%) patients, epidermoid carcinoma in 6/30 (20%), carcinoid in 2/30 (6.7%), and small cell lung cancer in 4/30 (13.3%).
Table 1.
Overview of the patients and tumours evaluated in this study
| Patient | Sex | Diameter (mm) | Histology | Pre-CT | Post-CT | NE | PET/SUV | Grade | Margins |
| 1 | M | 20 | Carcinoid | 18 | 60 | 42 | 4.01 | G1 | Lobulated |
| 2 | M | 20 | Carcinoid | 19 | 35 | 16 | 6.53 | G1 | Lobulated |
| 3 | M | 22 | Adenocarcinoma | 25 | 83 | 58 | 7.14 | G1 | Spiculated |
| 4 | M | 21 | Adenocarcinoma | 15 | 55 | 40 | 3.05 | G1 | Spiculated |
| 5 | F | 22 | Adenocarcinoma | 10 | 26 | 16 | 4.50 | G1 | Spiculated |
| 6 | F | 20 | Adenocarcinoma | 7 | 30 | 23 | 5.10 | G1 | Spiculated |
| 7 | M | 14 | Adenocarcinoma | 27 | 54 | 27 | 6.03 | G2 | Spiculated |
| 8 | M | 15 | Adenocarcinoma | 46 | 98 | 52 | 6.03 | G2 | Spiculated |
| 9 | M | 29 | Adenocarcinoma | 50 | 105 | 55 | 6.03 | G2 | Spiculated |
| 10 | F | 29 | Adenocarcinoma | 47 | 90 | 43 | 3.45 | G2 | Spiculated |
| 11 | M | 30 | Adenocarcinoma | 22 | 69 | 47 | 3.67 | G2 | Spiculated |
| 12 | M | 30 | Adenocarcinoma | 32 | 87 | 55 | 2.55 | G2 | Spiculated |
| 13 | M | 22 | Adenocarcinoma | 14 | 77 | 63 | 3.50 | G2 | Spiculated |
| 14 | M | 25 | Adenocarcinoma | 28 | 58 | 30 | 5.80 | G2 | Spiculated |
| 15 | F | 28 | Adenocarcinoma | 38 | 87 | 49 | 8.50 | G2 | Spiculated |
| 16 | M | 26 | Adenocarcinoma | 48 | 65 | 17 | 4.40 | G2 | Spiculated |
| 17 | M | 30 | Epidermoid | 34 | 86 | 52 | 38.22 | G2 | Spiculated |
| 18 | M | 25 | Epidermoid | 17 | 82 | 65 | 10.20 | G2 | Spiculated |
| 19 | M | 30 | Epidermoid | 75 | 98 | 23 | 19.50 | G2 | Spiculated |
| 20 | M | 24 | Epidermoid | 42 | 102 | 60 | 2.10 | G2 | Spiculated |
| 21 | F | 23 | Epidermoid | 39 | 60 | 21 | 22.40 | G2 | Spiculated |
| 22 | M | 9.5 | Adenocarcinoma | 5 | 48 | 43 | 2.05 | G3 | Lobulated |
| 23 | M | 22.5 | Adenocarcinoma | 12 | 44 | 32 | 12.50 | G3 | Lobulated |
| 24 | F | 14 | SCLC | 57 | 94 | 37 | 0.10 | G3 | Lobulated |
| 25 | M | 27 | SCLC | 25 | 47 | 22 | 5.50 | G3 | Lobulated |
| 26 | M | 14 | Adenocarcinoma | 18 | 62 | 44 | 0.10 | G3 | Spiculated |
| 27 | M | 28 | Adenocarcinoma | 43 | 69 | 26 | 8.13 | G3 | Spiculated |
| 28 | M | 23 | Adenocarcinoma | 18 | 44 | 26 | 7.50 | G3 | Spiculated |
| 29 | M | 27 | SCLC | 19 | 41 | 22 | 4.59 | G3 | Spiculated |
| 30 | M | 26 | SCLC | 38 | 75 | 37 | 2.90 | G3 | Spiculated |
E, net enhancement; SCLC, small cell lung cancer; SUV, standardised uptake value.
Figure 1.
Median diameters of single pulmonary nodules according to grade.
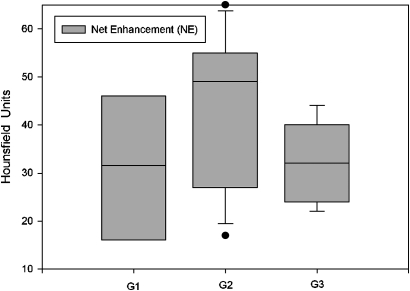
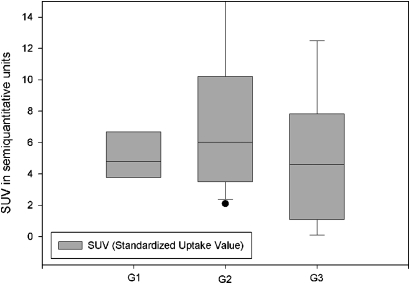
Of the 30 malignant SPNs, six were classified as G1 (well differentiated (figure 2); median NE, 31.5 Hounsfield units (HU); median SUV, 4.8 units (figures 3 and 4)), 15 were classified as G2 (moderately differentiated (figure 5); median NE, 49 HU; median SUV, 6 units (figures 3 and 4)), and nine were classified as G3 (poorly differentiated (figure 6); median NE, 32 HU; median SUV, 4.5 units (figures 3 and 4)). NE was >15 HU in all patients. SUV was <2.5 units in four patients and >2.5 units in 26 patients.
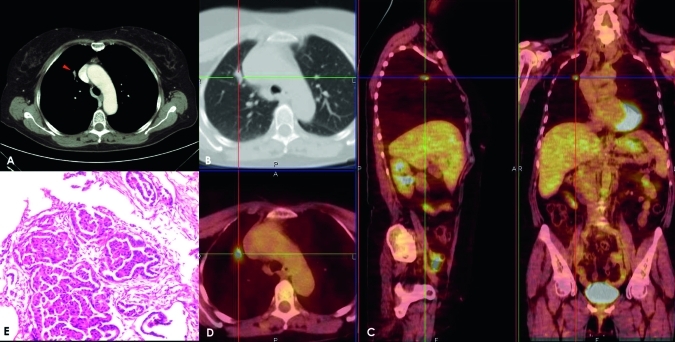
Figure 2.
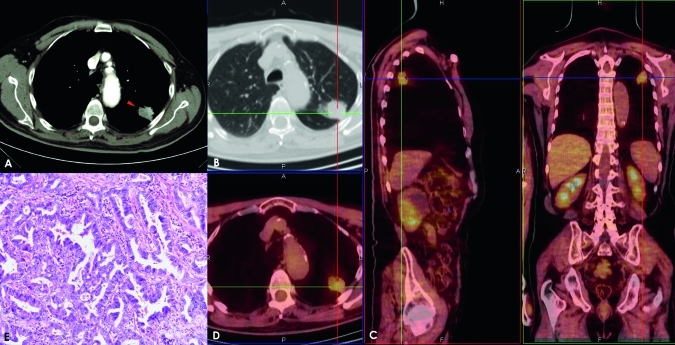
Adenocarcinoma in a 69-year-old woman. The post-contrast axial scan shows a transverse thin section (2.0 mm collimation) on a 20 mm nodule (arrow) with spiculated margins (A,B). After placement of a superimposed region of interest, the post-contrast image shows an enhancement of 30 Hounsfield units (HU) at 4 min and a net enhancement of 23 HU. The solitary pulmonary nodule has an area of [18F]fluorodeoxyglucose uptake with a maximum standardised uptake value of 5.10 units; fusion images on axial sagittal and coronal planes show this captation area (C,D). This lesion was classified as a well-differentiated (G1) adenocarcinoma with low vascularity, poor necrosis and moderate cellularity (E).
Figure 3.
Net enhancement in G1, G2 and G3 single pulmonary nodules.
Figure 4.
Median [18F]fluorodeoxyglucose standardised uptake value (SUV) in G1, G2 and G3 single pulmonary nodules.
Figure 5.
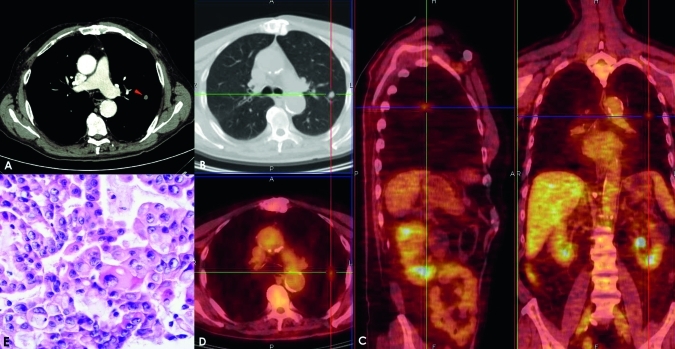
Adenocarcinoma in a 79-year-old man. Post-contrast CT axial scan shows a transverse thin section (2.0 mm collimation) on a 30 mm nodule (arrow) with spiculated margins (A,B). A superimposed region of interest on post-contrast images at 4 min shows an enhancement of 87 Hounsfield units (HU) and a net enhancement of 55 HU. The solitary pulmonary nodule has an area of [18F]fluorodeoxyglucose uptake, with a maximum standardised uptake value of 2.55 units. The positron emission tomography image integrated with the CT image to obtain fusion images on axial sagittal and coronal planes shows the captation site (C,D). This lesion was classified as a moderately differentiated (G2) adenocarcinoma with rich vascularity, moderate necrosis, low hypercellularity and moderate connective stroma (E).
Figure 6.
Adenocarcinoma in a 71-year-old man. Post-contrast CT axial scan shows a transverse thin section (2.0 mm collimation) on a 9.5 mm nodule (arrow) with lobulated margins (A,B). A superimposed region of interest shows an enhancement of 48 Hounsfield units (HU) and a net enhancement of 43 HU. The solitary pulmonary nodule has a standardised uptake value of 2.05 units; fusion images obtained on the axial sagittal and coronal planes show the captation areas (C,D). This lesion was classified as a poorly differentiated (G3) adenocarcinoma with moderate vascularity, low necrosis and hypercellularity and moderate connective stroma (E).
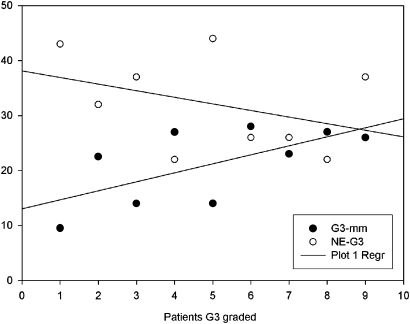
The Pearson correlation test revealed a highly negative correlation in G3 SPNs between NE and their corresponding diameters (r=−0.834 and p=0.00524) (figure 7). Analysis of the correlation between SPN dimensions, NE, SUV, grading and histological findings showed that the NE of malignant SPNs increased with an increase in diameter (r=0.982; p=0.284). Also the SUV increased as the SPN diameter increased (r=0.789; p=0.421). In addition, NE and SUV were higher in G2 than G1 SPNs, and lower in G2 than G3 SPNs (r=0.97; p=0.137). p Values >0.05 were probably due to the low number of patients enrolled in the study.
Figure 7.
Scatterplot of the correlation between net enhancement (NE) and median diameter of G3 single pulmonary nodules.
Discussion
Evaluation of morphological aspects is usually the first step in diagnosing SPNs.3 Margins are considered important, usually being well defined in benign lesions and irregular and/or spiculated in malignant lesions. However, about 20–30% of SPNs with well-defined margins are diagnosed as malignant.4 5 Moreover, the margins of many nodules are classified as indeterminate, and diagnosis remains a dilemma.
The advent of dynamic MDCT and PET/CT in the early 1990s8 represented a breakthrough in oncology, particularly with regard to identification and characterisation of SPNs.6 MDCT and PET/CT, unlike biopsy, videothoracoscopy and surgical resection, are non-invasive procedures. The rationale of this method is based on the abnormal and anarchic vascularisation of malignant SPNs that sustains the fast rate of tumour growth. CT scans with NICM readily detect vascular structures.7 The efficiency of dynamic CT in the characterisation of SPNs is well established, although different modalities of technical execution and cut-off values have been used to identify malignant SPNs.5 7–9 17 18 We carry out MDCT examinations using the protocol CT of Swensen et al8 and dynamic volumetric scans 1, 2, 3 and 4 min after NICM administration. This procedure has sensibility, specificity and accuracy values of 98%, 58% and 77% in differentiating benign from malignant SPNs.8 It has been reported that scans acquired 15 min after NICM injection showed contrast medium washout, differentiating among benign nodules those with high enhancement, active granulomas and vascular lesions, and also differentiating among malignant nodules, thereby increasing specificity.5 However, despite potential benefit in terms of specificity, in order to limit the patients' exposure to radiation, we did not carry out scans 15 min after NICM administration.9
PET is a nuclear medicine technique based on the pharmacodynamics of the 18F-FDG radiotracer that enters neoplastic nodules. SUV is the ratio between the amount of radiotracer taken up by a lesion and the amount of radiotracer that would hypothetically be present in a region of equal volume if the tracer was uniformly distributed throughout the body. A SUV of >2.5 units is highly predictive of malignancy. At a SUV of ≥2.5 units, PET has a sensitivity and specificity of 77% and 100%, respectively.12 Very few studies have used SUV cut-offs of ≥3.313 14 and ≥5.5 units,15 which have lower sensitivity and specificity values than >2.5 or <2.5 units. Integrated with MDCT, PET has a sensitivity, specificity and accuracy of 96%, 88% and 93%, respectively, in identifying malignant SPNs.16 PET/CT alone cannot detect nodules of <1 cm, carcinoids or bronchioalveolar carcinomas.12 A strong correlation has recently been reported between contrast enhancement and microvessel density19 20 and between SUV and histological findings.19 21 Therefore, CT and PET/CT can play a relevant role in evaluating the response to treatment, particularly if considered together with histology and grading.
This is the first study to look at the relationship between CT enhancement, SUV and histopathological grading of SPNs. Grading is the most accurate biological indicator of disease activity and a fundamental prognostic factor because the degree of cellular differentiation predicts relapse and/or metastasis development. Patients with undifferentiated lung cancer were reported to have an 80% risk of death, whereas patients with poorly differentiated or moderately differentiated lung cancer have a risk of death of 70% and 40%, respectively.22
In our study, G2 SPNs were the largest lesions (median 26.5 mm), G1 were the smallest (median 20 mm) and G3 SPNs were slightly larger than G1 SPNs (median 23 mm) but smaller than G2 SPNs. Median NE and SUV were higher in G2 than G1 SPNs and lower in G3 than G2 SPNs. We found a significant negative correlation between NE and lesion diameter in G3 SPNs, demonstrating a net decrease of perfusion in dedifferentiated (G3) SPNs, particularly when compared with G2 SPNs. This observation supports the finding of Wang et al23 that CT enhancement may reflect tumour angiogenesis. In addition, as mentioned above, immunochemical studies have demonstrated a correlation between enhancement and microvessel density in SPNs.19 20 There are various reports of a significant decrease in microvessel density going from G1 to G3 renal cell carcinomas due to architectural remodelling of vascularity influenced by tumour progression.24–27 Diverse mechanisms have been evoked to explain this behaviour: the inability of neovascularisation to keep pace with a high proliferation of tumour cells causes a decrease in architectural complexity, and the tumour becomes hypoxic and necrotic; and the development of fibrosis and large vascular channels within the tumour would have the effect of decreasing microvessel density without necessarily altering the total vascular area and blood supply. According to Vaupel,28 the most highly vascularised regions within the tumour may not reflect the dedifferentiated grade: a relevant percentage of tumour vascularisation may be temporarily non-functional because of the development of thromboses and shunts. Similar physiopathological principles could explain the SUV trend identified in this study: cellular proliferation seems to be reduced with the decrease in vascular stroma and the increase in fibrosis, inducing a proportionally lower uptake of 18F-FDG, especially in G3 SPNs. However, while this mechanism could explain the lower SUV in G3 versus G2 SPNs, it does not explain the higher SUV in G2 versus G1 and G3 SPNs.
In conclusion, our data on NE and SUV in G1, G2 and G3 SPNs support the theory that stroma and neoangiogenesis are fundamental in the growth of SPNs, above all in G3 SPNs where the highly negative correlation between NE and the corresponding diameters demonstrate a net decrease in perfusion despite the increase in dimensions.21 29 Our data indicate that the multidisciplinary approach used in this study may result in a more precise prognosis and consequently a better therapeutic outcome, particularly in patients with undifferentiated lung cancer. However, owing to the small number of patients in our study, it is difficult to identify clinically important results. Therefore, studies with larger numbers of patients and more histological subtypes are required to determine the full potential and clinical impact of the combined use of MDCT, PET/CT and grading in evaluating SPNs.
Take-home messages.
CT net enhancement (NE) well explains the growing characteristics of solitary pulmonary nodules (SPNs), which are strictly related to their angiogenesis activity.
G3-graded SPNs showed reduced CT NE compared with G2 lesions; this behaviour reflects a structural anarchy in vascularisation that is pronounced in G3 lesions.
Similar trends in [18F]fluorodeoxyglucose (18F-FDG) standardised uptake value (SUV) and CT NE values can be identified between G1/G2 and G3 lesions; although each technique strictly defined a different phenomenon, respectively vascularisation and metabolic activity, such behaviours show the close relationships that link contrast medium delivery and 18F-FDG consumption in SPNs.
A comprehensive evaluation of NE and 18F-FDG SUV in clinical routine would probably lead to an accurate evaluation of potential SPN aggressiveness.
Acknowledgments
We thank Jean Ann Gilder for revising and editing the text.
Footnotes
Competing interests: None.
Provenance and peer review: Not commissioned; externally peer reviewed.
References
- 1.Tan BB, Flaherty KR, Kazerooni EA, et al. ; American College of Chest Physicians The solitary pulmonary nodule. Chest 2003;123(Suppl 1):89S–96 [DOI] [PubMed] [Google Scholar]
- 2.Wahidi MM, Govert JA, Goudar RK, et al. ; American College of Chest Physicians Evidence for the treatment of patients with pulmonary nodules: when is it lung cancer?: ACCP evidence-based clinical practice guidelines (2nd edition). Chest 2007;132(Suppl 3):94S–107 [DOI] [PubMed] [Google Scholar]
- 3.Erasmus JJ, Connolly JE, McAdams HP, et al. Solitary pulmonary nodules: part I. morphologic evaluation for differentiation of benign and malignant lesions. Radiographics 2000;20:43–58 [DOI] [PubMed] [Google Scholar]
- 4.Winer-Muram HT. The solitary pulmonary nodule. Radiology 2006;239:34–49 [DOI] [PubMed] [Google Scholar]
- 5.Jeong YJ, Lee KS, Jeong SY, et al. Solitary pulmonary nodule: characterization with combined wash-in and washout features at dynamic multi-detector row CT. Radiology 2005;237:675–83 [DOI] [PubMed] [Google Scholar]
- 6.Erasmus JJ, McAdams HP, Connolly JE. Solitary pulmonary nodules: part II. Evaluation of the indeterminate nodule. Radiographics 2000;20:59–66 [DOI] [PubMed] [Google Scholar]
- 7.Jeong YJ, Yi CA, Lee KS. Solitary pulmonary nodules: detection, characterization, and guidance for further diagnostic workup and treatment. AJR Am J Roentgenol 2007;188:57–68 [DOI] [PubMed] [Google Scholar]
- 8.Swensen SJ, Morin RL, Schueler BA, et al. Solitary pulmonary nodule: CT evaluation of enhancement with iodinated contrast material–a preliminary report. Radiology 1992;182:343–7 [DOI] [PubMed] [Google Scholar]
- 9.Swensen SJ, Viggiano RW, Midthun DE, et al. Lung nodule enhancement at CT: multicenter study. Radiology 2000;214:73–80 [DOI] [PubMed] [Google Scholar]
- 10.Choi EJ, Jin GY, Han YM, et al. Solitary pulmonary nodule on helical dynamic CT scans: analysis of the enhancement patterns using a computer-aided diagnosis (CAD) system. Korean J Radiol 2008;9:401–8 [DOI] [PMC free article] [PubMed] [Google Scholar]
- 11.Lee KS, Yi CA, Jeong SY, et al. Solid or partly solid solitary pulmonary nodules: their characterization using contrast wash-in and morphologic features at helical CT. Chest 2007;131:1516–25 [DOI] [PubMed] [Google Scholar]
- 12.Orlacchio A, Schillaci O, Antonelli L, et al. Solitary pulmonary nodules: morphological and metabolic characterisation by FDG-PET-MDCT. Radiol Med 2007;112:157–73 [DOI] [PubMed] [Google Scholar]
- 13.Yap CS, Czernin J, Fishbein MC, et al. Evaluation of thoracic tumors with 18F-fluorothymidine and 18F-fluorodeoxyglucose-positron emission tomography. Chest 2006;129:393–401 [DOI] [PubMed] [Google Scholar]
- 14.Ohtsuka T, Nomori H, Watanabe K, et al. Prognostic significance of [(18)F]fluorodeoxyglucose uptake on positron emission tomography in patients with pathologic stage I lung adenocarcinoma. Cancer 2006;107:2468–73 [DOI] [PubMed] [Google Scholar]
- 15.Suga K, Kawakami Y, Hiyama A, et al. Dual-time point 18F-FDG PET/CT scan for differentiation between 18F-FDG-avid non-small cell lung cancer and benign lesions. Ann Nucl Med 2009;23:427–35 [DOI] [PubMed] [Google Scholar]
- 16.Yi CA, Lee KS, Kim BT, et al. Tissue characterization of solitary pulmonary nodule: comparative study between helical dynamic CT and integrated PET/CT. J Nucl Med 2006;47:443–50 [PubMed] [Google Scholar]
- 17.Hirai S, Hamanaka Y, Mitsui N, et al. Role of video-assisted thoracic surgery for the diagnosis of indeterminate pulmonary nodule. Ann Thorac Cardiovasc Surg 2006;12:388–92 [PubMed] [Google Scholar]
- 18.Burdine J, Joyce LD, Plunkett MB, et al. Feasibility and value of video-assisted thoracoscopic surgery wedge excision of small pulmonary nodules in patients with malignancy. Chest 2002;122:1467–70 [DOI] [PubMed] [Google Scholar]
- 19.Yi CA, Lee KS, Kim EA, et al. Solitary pulmonary nodules: dynamic enhanced multi-detector row CT study and comparison with vascular endothelial growth factor and microvessel density. Radiology 2004;233:191–9 [DOI] [PubMed] [Google Scholar]
- 20.Tateishi U, Nishihara H, Watanabe S, et al. Tumor angiogenesis and dynamic CT in lung adenocarcinoma: radiologic-pathologic correlation. J Comput Assist Tomogr 2001;25:23–7 [DOI] [PubMed] [Google Scholar]
- 21.Poettgen C, Theegarten D, Eberhardt W, et al. Correlation of PET/CT findings and histopathology after neoadjuvant therapy in non-small cell lung cancer. Oncology 2007;73:316–23 [DOI] [PubMed] [Google Scholar]
- 22.Sun Z, Aubry MC, Deschamps C, et al. Histologic grade is an independent prognostic factor for survival in non-small cell lung cancer: an analysis of 5018 hospital- and 712 population-based cases. J Thorac Cardiovasc Surg 2006;131:1014–20 [DOI] [PubMed] [Google Scholar]
- 23.Wang JH, Min PQ, Wang PJ, et al. Dynamic CT evaluation of tumor vascularity in renal cell carcinoma. AJR Am J Roentgenol 2006;186:1423–30 [DOI] [PubMed] [Google Scholar]
- 24.Yildiz E, Ayan S, Goze F, et al. Relation of microvessel density with microvascular invasion, metastasis and prognosis in renal cell carcinoma. BJU Int 2008;101:758–64 [DOI] [PubMed] [Google Scholar]
- 25.Imao T, Egawa M, Takashima H, et al. Inverse correlation of microvessel density with metastasis and prognosis in renal cell carcinoma. Int J Urol 2004;11:948–53 [DOI] [PubMed] [Google Scholar]
- 26.Köhler HH, Barth PJ, Siebel A, et al. Quantitative assessment of vascular surface density in renal cell carcinomas. Br J Urol 1996;77:650–4 [DOI] [PubMed] [Google Scholar]
- 27.Delahunt B, Bethwaite PB, Thornton A. Prognostic significance of microscopic vascularity for clear cell renal cell carcinoma. Br J Urol 1997;80:401–4 [DOI] [PubMed] [Google Scholar]
- 28.Vaupel P. Tumor microenvironmental physiology and its implications for radiation oncology. Semin Radiat Oncol 2004;14:198–206 [DOI] [PubMed] [Google Scholar]
- 29.Eberhard A, Kahlert S, Goede V, et al. Heterogeneity of angiogenesis and blood vessel maturation in human tumors: implications for antiangiogenic tumor therapies. Cancer Res 2000;60:1388–93 Erratum in: Cancer Res 2000;60:3668. [PubMed] [Google Scholar]


