Abstract
Sulfite oxidases (SOs) are physiologically vital Mo-containing enzymes that occur in animals, plants, and bacteria and which catalyze the oxidation of sulfite to sulfate, the terminal reaction in the oxidative degradation of sulfur-containing compounds. X-ray structure determinations of SOs from several species show nearly identical coordination structures of the molybdenum active center, and a common catalytic mechanism has been proposed that involves the generation of a transient paramagnetic Mo(V) state through a series of coupled electron–proton transfer steps. This chapter describes the use of pulsed electron-nuclear double resonance (ENDOR) and electron spin echo envelope modulation (ESEEM) spectroscopic techniques to obtain information about the structure of this Mo(V) species from the hyperfine interactions (hfi) and nuclear quadrupole interactions (nqi) of nearby magnetic nuclei. Variable frequency instrumentation is essential to optimize the experimental conditions for measuring the couplings of different types of nuclei (e.g., 1H, 2H, 31P, and 17O). The theoretical background necessary for understanding the ESEEM and ENDOR spectra of the Mo(V) centers of SOs is outlined, and examples of the use of advanced pulsed EPR methods (RP-ESEEM, HYSCORE, integrated four-pulse ESEEM) for structure determination are presented. The analysis of variable-frequency pulsed EPR data from SOs is aided by parallel studies of model compounds that contain key functional groups or that are isotopically labeled and thus provide benchmark data for enzymes. Enormous progress has been made on the use of high-resolution variable-frequency pulsed EPR methods to investigate the structures and mechanisms of SOs during the past ~15 years, and the future is bright for the continued development and application of this technology to SOs, other molybdenum enzymes, and other problems in metallobiochemistry.
1. INTRODUCTION AND STRUCTURES FROM X-RAY CRYSTALLOGRAPHY
Sulfite oxidases (SOs) are physiologically vital Mo-containing enzymes encountered in numerous organisms: humans, avians, plants and bacteria. These enzymes catalyze the oxidation of sulfite to sulfate, coupled, at least in vertebrates, with the subsequent reduction of two equivalents of ferricytochrome c (cyt c)ox to ferrocytochrome c (cyt c)red [1,2]:
This is the terminal reaction in the oxidative degradation of sulfur-containing compounds and is physiologically essential.
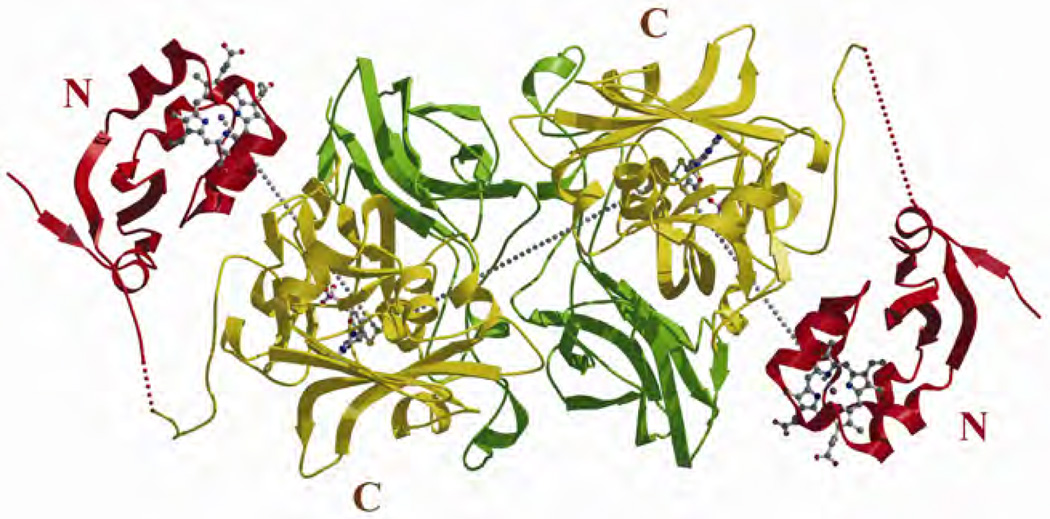
The vertebrate SOs consist of two identical subunits [3–8], each with a molecular weight of ~51.5 kDa. Each subunit in turn has two functionally distinct domains. The smaller N-terminal domain (~10 kDa) contains a b5-type heme center, with the heme Fe being in oxidation state III in the resting enzyme. The larger C-terminal domain (~42 kDa) contains an Mo atom with a resting oxidation state of VI (see Fig. 1).
Figure 1.
X-ray structure of CSO from PDB 1sox [4]. Please visit http://www.springer.com/978-0-387-84855-6 to view a high-resolution full-color version of this illustration.
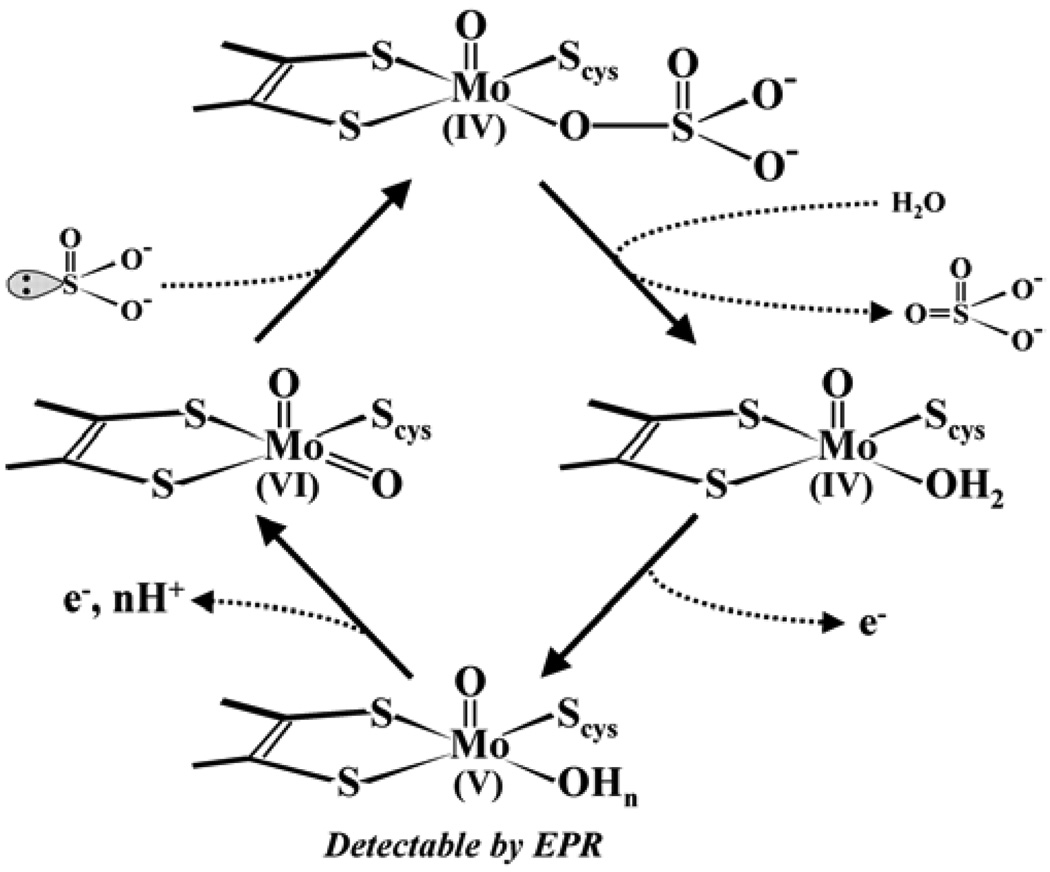
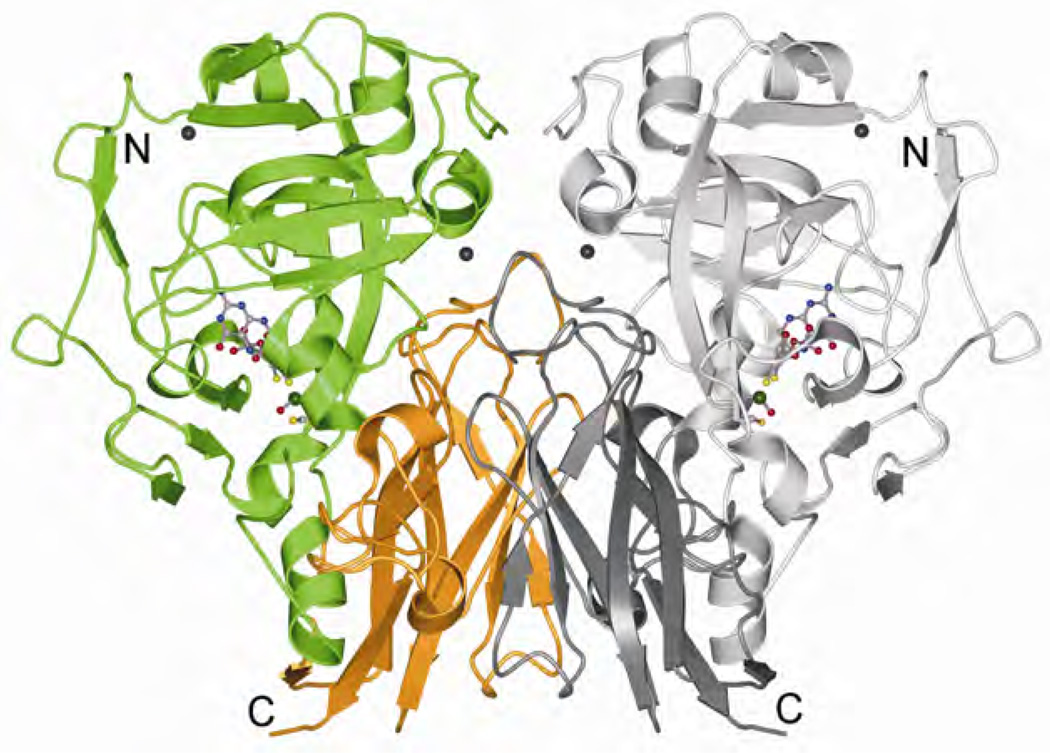
The two-electron oxidation of occurs at the Mo center to give a formally MoIV state that is then reoxidized to MoVI by sequential one-electron transfers to the b5-type heme center. After each Mo → Fe one-electron-transfer step, the b5 center is reoxidized by exogenous (cyt c)ox, resulting in the catalytic turnover cycle shown in Scheme 1. While vertebrate SOs contain Mo and heme domains in each subunit, the dimeric SO found in plants (pl-SO) [9,10] contains only an Mo domain in each subunit and lacks an Fe domain. The Mo domain of pl-SO is highly homologous to that of a vertebrate SO, and the structure of pl-SO from Arabidopsis thaliana is presented in Figure 2.
Scheme 1.
Proposed catalytic cycle of sulfite oxidase of vertebrates.
Figure 2.
The crystal structure of plant sulfite oxidase. Reprinted with permission from [9]. Copyright © 2003, Elsevier. Please visit http://www.springer.com/978-0-387-84855-6 to view a high-resolution full-color version of this illustration.
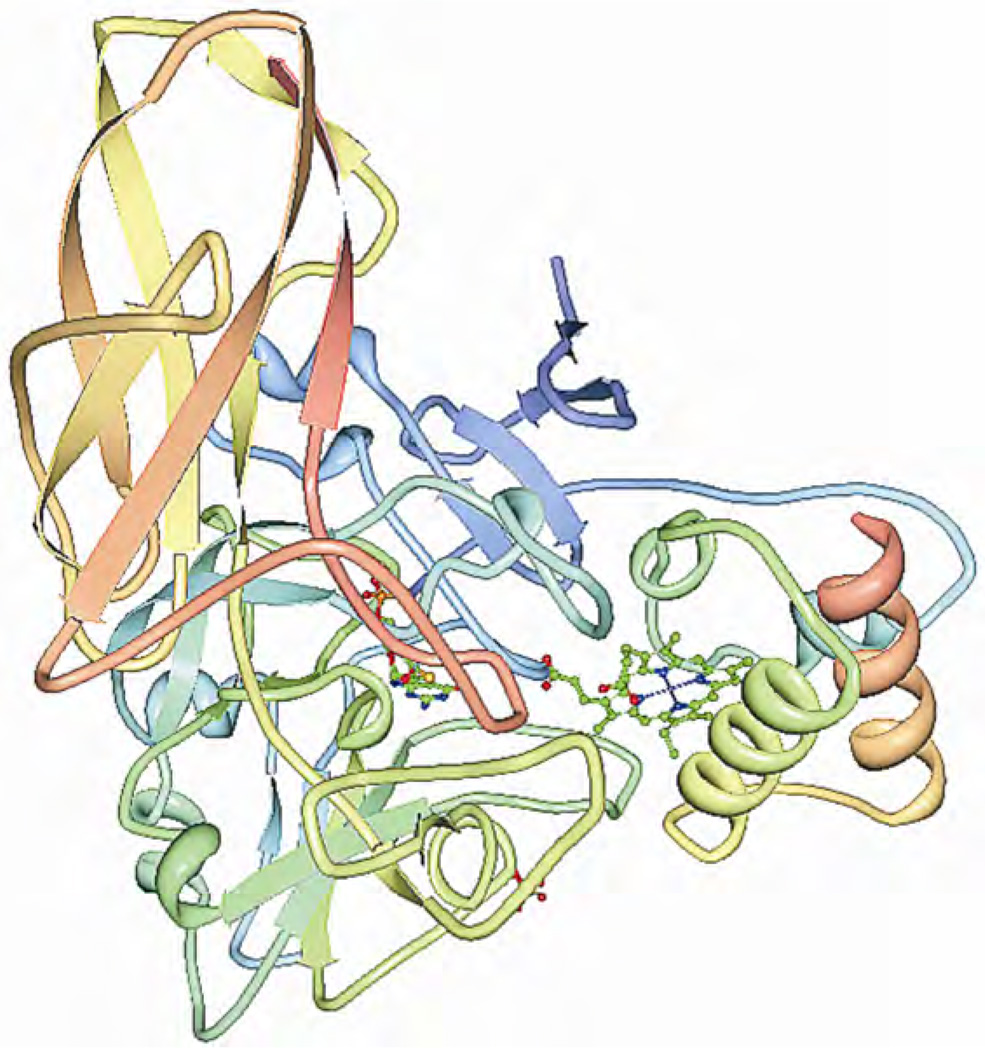
The SO found in bacteria (b-SO) differs from the SOs of vertebrates and plants [11–13]. Bacterial SO is a heterodimer consisting of a 40.6-kDa subunit containing an Mo cofactor and an 8.8-kDa subunit containing a single c-type heme. The two subunits of b-SO are tightly associated (Fig. 3), and the Fe⋯Mo distance (~16 Å) is much smaller than that seen in the crystal structure of chicken SO (CSO).
Figure 3.
High-resolution structure of the heterodimeric complex of the catalytic molybdopterin subunit and the c-type cytochrome subunit from Starkeya novella from PDB 2blf [11]. Please visit http://www.springer.com/978-0-387-84855-6 to view a high-resolution full-color version of this illustration.
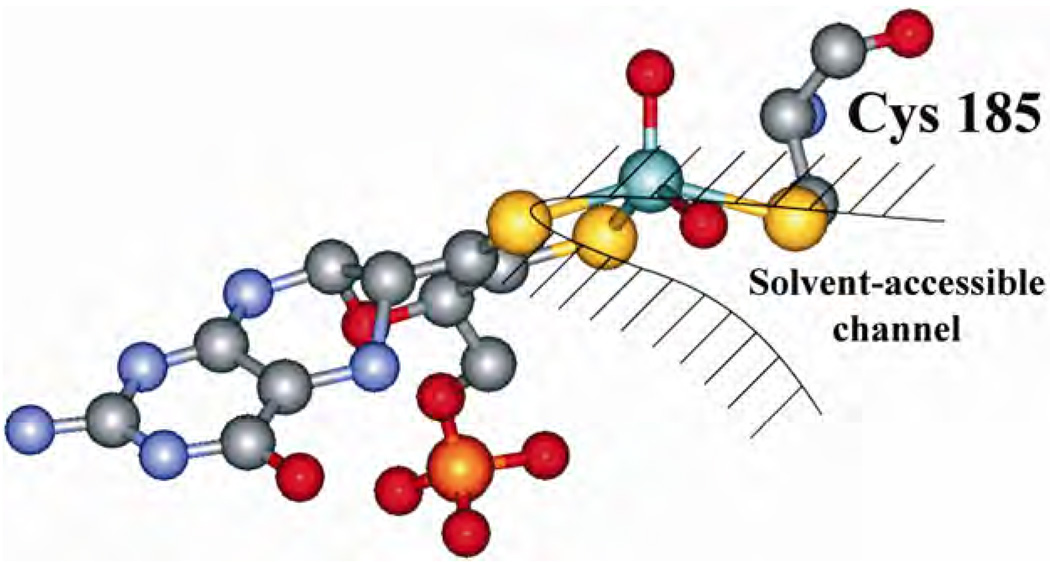
The geometry of the Mo center (which is well conserved in all the SOs) [14,15], as revealed by x-ray crystallography and shown in Figure 4, is approximately square pyramidal, with an oxo group occupying the apical position. The equatorial positions are occupied by a second oxygen and by three sulfurs, one of which is supplied by a cysteine sidechain, while the other two come from the ene-dithiolate group of the molybdopterin. For CSO the crystal structure reveals that the equatorial oxygen ligand is accessible to the solvent, whereas the apical one is more shielded by the surrounding protein. During the proposed catalytic cycle (Scheme 1), the Mo center of SOs passes through the formal Mo(V) oxidation state. The immediate environment of this paramagnetic d1 electron configuration can be investigated by electron paramagnetic resonance (EPR) techniques.
Figure 4.
The detailed structure of the molybdenum active site of CSO [4]. Please visit http://www.springer.com/978-0-387-84855-6 to view a high-resolution full-color version of this illustration.
2. EARLIER cw EPR INVESTIGATIONS
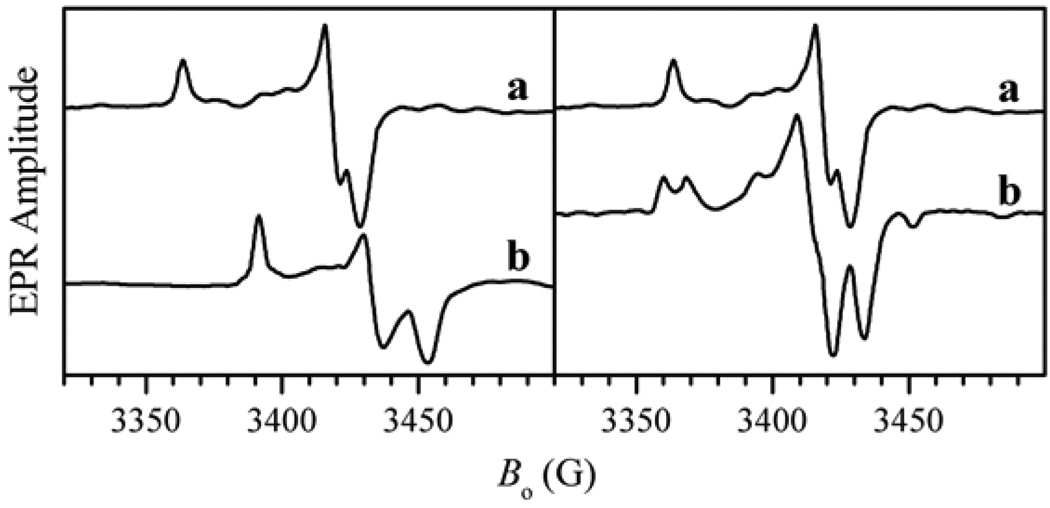
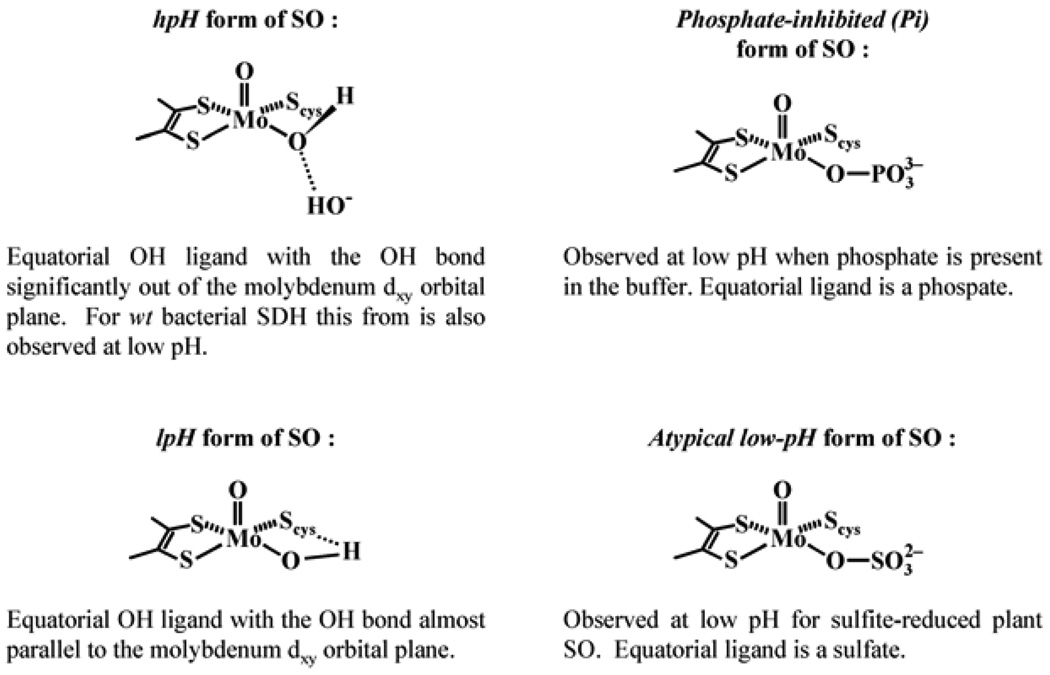
Extensive continuous wave (cw) EPR investigations of CSO during the late 1970s and early 1980s, carried out primarily by Cramer, Bray, and others (see, e.g., [16–20]), demonstrated that CSO has an EPR spectrum characterized by a general rhombic g-factor anisotropy (Fig. 5). Three distinct forms having different sets of principal g-values were observed depending upon pH and anions in the medium. In high-pH buffers (pH 9–9.5) containing low anion concentrations one form was obtained exclusively, whereas the other two were observed in buffers of ~pH 7 containing high concentrations of anions such as Cl− or phosphate. At intermediate pH values a mixture of the species was observed. The particular form observed at low pH depended upon whether phosphate was present in the buffer, and so these two forms have become known as the low-pH (lpH) form and the phosphate inhibited (Pi) form. Similarly, the species observable at high pH has become known as the high-pH (hpH) form.
Figure 5.
Left panel: cw X-band EPR spectra of low- (a) and high-pH (b) forms of CSO in D2O buffer. This panel demonstrates the variation of g-values with pH. Right panel: cw-EPR spectra of lpH form of CSO in D2O (a) and H2O (b) buffers. In the latter the proton-related splittings are clearly visible.
The EPR spectrum of the lpH form clearly shows well-resolved doublet splittings at the gz and gx positions (Fig. 5), which disappear in D2O buffer. This finding allowed Bray and coworkers to conclude that the observed splitting is caused by a hyperfine interaction (hfi) of Mo(V) with a single exchangeable proton, most probably belonging to an Mo–OH group [7]. From numerical simulations of the cw-EPR spectrum Bray and coworkers obtained the hfi tensor associated with this proton [7]. However, the intrinsically low resolution of the cw-EPR experiments precluded obtaining such important structural information as the orientation of the OH ligand with respect to the rest of the Mo complex.
No proton splittings were observed in the EPR spectra of either the Pi or hpH forms of the enzyme. In the case of the Pi form, cw-EPR experiments using 17O-substituted PO43− [17] provided early evidence that a phosphate group coordinates to the Mo(V) center, displacing OH. For the hpH form, the lack of observation of an exchangeable proton in the cw spectra was initially believed to reflect deprotonation of the putative Mo–OH group of the lpH form. Later, however, George proposed that an Mo–OH moiety was also present at high pH [21]. This suggestion was supported by earlier 17O studies which showed that, unlike the Pi form, both the hpH and lpH forms have a water-exchangeable oxygen-containing ligand [17]. An OH moiety would be a likely candidate for this ligand, and George suggested a possible mechanism involving pH-dependent coordination changes that might explain the transition from the lpH to the hpH form without invoking the loss of Mo–OH [21].
Generally, the features of the EPR spectra of vertebrate SOs are independent of whether the Mo center is reduced by sulfite (a common practice), photochemically, or by titanium(III) citrate. However, when reduction of CSO was carried out in 4-morpholine-ethanesulfonic acid (Mes) buffer (pH 6.0), cw-EPR difference spectra gave evidence for a form of SO with principal g-values similar to those of lpH SO, but lacking the characteristic splittings from an exchangeable proton. This atypical form of SO was tentatively attributed to excess sulfite binding to the Mo(V) center, thereby blocking water access [19]. No additional studies of this atypical form of SO have been described.
When the investigations were expanded from vertebrate SO to plant, bacterial, and mutant SOs, it became evident that the classification derived from the initial EPR investigation of vertebrate SOs is far from complete. For instance, for pl-SO the EPR spectrum of the form obtained by sulfite reduction at low pH does not show any proton-related splittings, and is similar to the atypical lpH spectrum previously observed for vertebrates [19]. However, reduction of low pH pl-SO by sulfite at high pH results in EPR spectra that are indistinguishable from those for wild-type chicken and human SO. For b-SO the EPR spectrum was found to be independent of pH and the presence of anions in solution, and resembled the EPR spectrum of the hpH form of vertebrates under all conditions.
The increasingly diverse cw-EPR results for SO proteins emphasized the need for the application of high-resolution pulsed EPR techniques that could provide intimate structural details for the Mo(V) centers of different organisms under various conditions. Such studies have been a primary focus of our research during the last decade. The structural information in these investigations was derived from hfi and nuclear quadrupole interactions (nqi) evaluated from pulsed electron-nuclear double resonance (ENDOR) or electron spin echo (ESE) envelope modulation (ESEEM) spectra. The spectra obtained by these pulsed EPR techniques contain the lines at fundamental nuclear transition frequencies. In addition, some of the ESEEM techniques display lines at frequencies that are linear combinations (usually, simple sums and differences) of the fundamental ones.
The appearance of the ESEEM spectra strongly depends on the specific technique, operational microwave (mw) frequency, and the hfi and nqi parameters of the studied nuclei. As a result, in order to determine the nuclear hfi and nqi parameters, one often needs to perform several experiments employing different pulsed EPR techniques at different mw frequencies. In the following section we briefly describe the relationship between the spectral line positions and magnetic resonance parameters, and discuss the optimal conditions for detection and interpretation of ESEEM and pulsed ENDOR spectra.
3. FREQUENCIES OBSERVED IN PULSED EPR FOR A SYSTEM OF ELECTRON SPIN S = 1/2 AND ARBITRARY NUCLEAR SPIN IN WEAK INTERACTION LIMIT
Most of the practical EPR studies of biological systems, including SOs, are performed on frozen solutions in which protein molecules do not have any preferential orientations. Depending on the magnetic properties of these paramagnetic centers, two spectroscopically different situations may arise. The first is where the anisotropy of the electron spin interactions (e.g., g-factor anisotropy) is not very strong and the anisotropic broadening is much smaller than the effective width of the mw excitation. In this case the paramagnetic centers contributing to the EPR or ESE signal form an ensemble of complete orientational disorder. The ESEEM or ENDOR spectra in such a nonselective situation provide information about the magnitudes of the nuclear hyperfine and quadrupole interactions and about the relative orientations of the hfi and nqi tensors.
The second situation arises when the anisotropic broadening dominates the EPR spectrum and is much greater than the mw excitation width. In this case the EPR or ESE signal is contributed by paramagnetic centers that have a limited set of orientations with respect to the magnetic field vector, B0. Depending on the measurement position within the EPR spectrum (which, for a given mw frequency, νmw, is selected by choosing the strength of the resonance magnetic field, B0), different sets of orientations can be made to contribute to the ENDOR or ESEEM spectra. Tracing the dependence of these spectra on the EPR position allows one to obtain information about the magnitudes of hfi and nqi and about the orientations of the hfi and nqi tensors with respect to the major magnetic tensor (e.g., the g-tensor) that determines the EPR anisotropy.
The ENDOR and ESEEM results obtained for both orientation-selective and nonselective situations can ultimately be interpreted in terms of the orientations of the nuclear interaction tensors with respect to the molecular coordinate frame. Whether this last step in the interpretation can only be done using rigorous quantum chemical computations, or simple qualitative considerations will suffice, depends on the complexity of the situation (primarily, on the symmetry).
Below we will outline the theoretical background necessary for understanding the ESEEM and ENDOR spectra of an Mo(V) center of SO. In this specific case we will be dealing with orientation-selective experiments. The orientation selection will be determined by the g-factor anisotropy that is not very large (the principal g-values are within the range from about 2.0 to 1.95), but sufficient to broaden the EPR spectrum to tens of Gauss even in C-band (νmw ~ 5 GHz), significantly greater than the mw excitation width, ~10 G. The nuclear spin Hamiltonian appropriate for a system consisting of an electron spin S = 1/2 and a nuclear spin I ≠ 0 in strong magnetic field is
| (1) |
where νI = gnβnB0 is the nuclear Zeeman frequency (gn is the nuclear g-factor and βn is the nuclear magneton), aiso is the isotropic hfi constant, and TZj (j = X, Y, Z) are the components of the anisotropic hfi tensor. The parameter k is related to the quadrupole coupling constant, e2Qq, as k = e2Qq/4I(2I − 1)h (Q is the quadrupole moment, q is the largest component of the electric field gradient tensor on the nucleus, h is Planck’s constant), while η is the asymmetry parameter of the electric field gradient tensor. X, Y, and Z are the axes of the laboratory coordinate frame, with B0 // Z. X′, Y′, and Z’ are the principal axes of the nqi. The electronic g-factor is assumed to be not very anisotropic, so that the electron spin quantization axis is reasonably aligned with B0 // Z, and the electron spin projection on B0, mS (mS ≡ 〈SZ〉), assumes the values −1/2 and 1/2. The strong magnetic field condition mentioned above implies that the electron Zeeman interaction is much stronger than any of the interactions accounted for by Eq. (1).
Let us consider first the simplest case of I = 1/2, when the quadrupole interaction is absent. In this situation the nuclear transition frequencies (so called fundamental frequencies) are:
| (2a) |
| (2b) |
| (2c) |
where subscripts α and β denote, respectively, the electron spin projections mS = 1/2 and −1/2. Equation (2a) represents the exact solution for the spin Hamiltonian Eq. (1), while Eqs. (2b) and (2c) are approximations for . The simplest Eq. (2c) is usually sufficient to understand the positions and shapes of the fundamental lines.
A typical purpose of the ENDOR/ESEEM spectroscopic investigation is to obtain separate estimates of the isotropic and anisotropic hfi parameters. In a system where the orientation selective experiments are possible (like SO) these estimates can in principle be obtained from the dependence of the shapes and positions of the fundamental lines on the EPR position. This approach, however, may sometimes become difficult to use because of possible overlaps of spectral lines from several different nuclei, or when broad statistical distributions of the hfi parameters obscure the lineshape details. In spite of these limitations, this is the only approach available in ENDOR experiments. In ESEEM, however, there are additional possibilities related to the fact that the ESEEM spectra may contain combination lines [22]. The most useful of these combination lines is the sum-combination νσ = να + νβ. From Eq. (2b) it follows that in the limit of weak hfi, νI ≫ |aiso + TZZ|/2, the sum-combination frequency is
| (3) |
One can see that the sum-combination line is upshifted from 2 νI, to higher frequencies by the value Δνσ proportional to the square of the anisotropic hfi constant. In a specific situation of complete orientational disorder and an axially symmetric anisotropic hfi tensor a good practical estimate of the sum-combination line shift is [22]
| (4) |
where T⊥ is the perpendicular component of the anisotropic hfi tensor. Conversely, from the position of the sum-combination line, using Eq. (4), it is easy to estimate the anisotropic hfi constant. Then one can use this estimate and obtain from the fundamental line positions the isotropic hfi constant aiso.
Of course, in practice the weak hfi condition νI ≫ |aiso + TZZ|/2 may not be rigorously satisfied, the anisotropic hfi tensor may be (and often is) rhombic rather than axial, and, in addition, in orientation-selective experiments the set of orientations contributing to the ESEEM spectrum may be restricted. Still, Eq. (4) is used even in these situations to obtain an estimate of the anisotropic hfi that can be then used as a starting approximation in rigorous numerical simulations of the ESEEM spectra. All in all, using the sum-combination line shift to separately estimate the anisotropic hfi represents an extremely powerful approach that has been successfully used in numerous ESEEM studies of SO and other systems described below.
Let us now consider nuclei with I > 1/2. The examples of such nuclei that we were dealing with in our investigations of SO are 2H (deuteron, I = 1) and 17O (I = 5/2). For both of these nuclei an ESEEM or ENDOR experiment can be set up (by choosing the appropriate B0 and νmw) to provide the situation of weak nqi, νI ± (aiso + TZZ)/2 ≫ k, which permits the most easy observation and interpretation of the nqi effects in the ESEEM and ENDOR spectra. When this condition of weak nqi is satisfied, the condition of weak hfi, νI > |aiso + TZZ|/2, is obviously also fulfilled. Under these weak interaction conditions the approximate expressions for the nuclear transition frequencies can be obtained from the simplified spin-Hamiltonian
| (5) |
where , and bX’Z, bY’Z, and bZ’Z are the direction cosines of the Z axis in the X′Y′Z′ frame.
For I = 1/2 there is only one nuclear transition within each electron spin manifold. For I > 1/2, however, we have to consider the total of I(2I + 1) transitions within each of the electron spin manifolds. We will denote the transition frequencies between the nuclear spin projections mI and mI + ΔmI (mI ≡ 〈IZ〉) within the α and β electron spin manifolds as . It is easy to see from Eq. (5) that these frequencies are given by [23]
| (6) |
In particular, for the ΔmI = 1 transition one obtains:
| (7) |
In the case of weak nqi, obviously, .
From Eq. (6) one can see that each of the fundamental frequencies splits into 2I + 1 − ΔmI different frequencies that depend on the specific mI values involved in the nuclear transition. The splitting between the spectral lines corresponding to the nuclear transitions mI ↔ mI + ΔmI and the lines corresponding to mI + 1 ↔ mI + 1 + ΔmI, as obtained from Eq. (7), is equal to
| (8) |
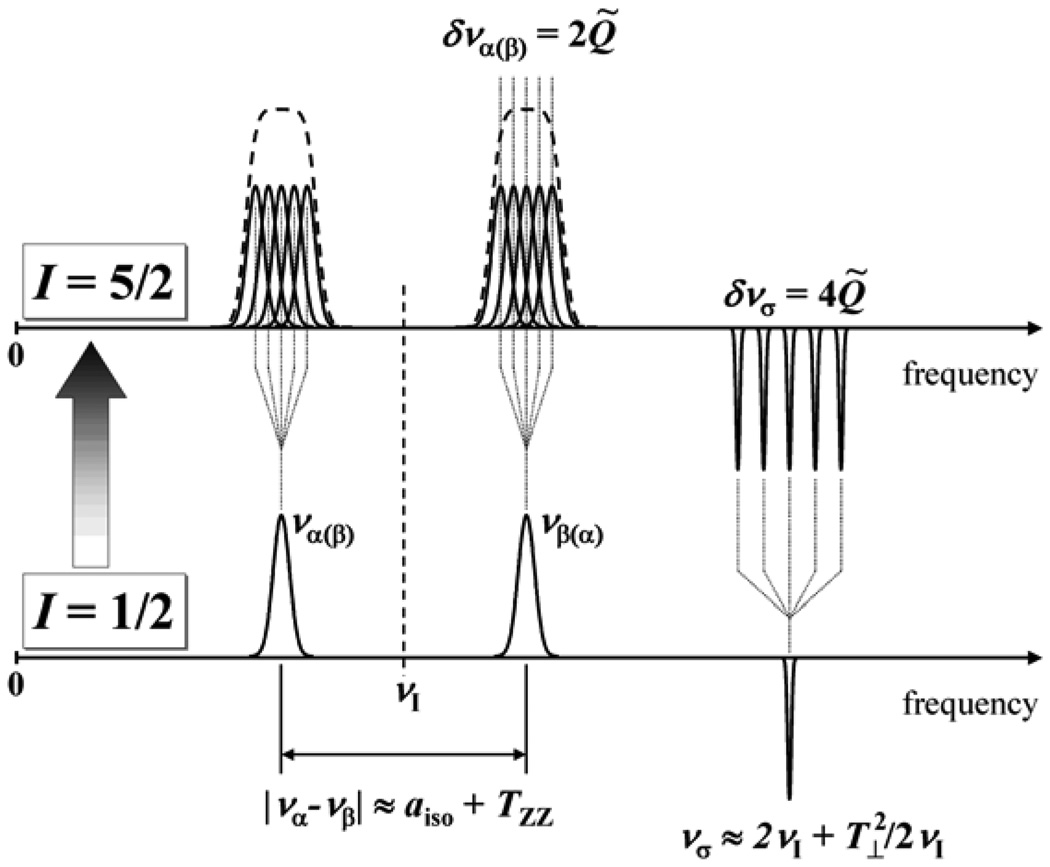
One can see that under the weak interaction conditions the splitting is purely due to the nqi. In most cases, however, Eq. (8) cannot be used to determine the nqi parameters from the one-dimensional (1D) experimental ENDOR or ESEEM spectra because the hfi distribution, whether purely statistical or because of the hfi anisotropy, will broaden the individual lines to the extent that small quadrupolar splittings cannot be resolved. This situation is schematically shown in Figure 6. The two-dimensional (2D) spectra (e.g., 2D Mims ENDOR [24], hyperfine-correlated ENDOR (HYEND) [25] or hyperfine sublevel correlation spectroscopy (HYSCORE) [26]) can resolve the quadrupole splitting, but often only at the expense of unacceptably long data acquisition times needed to achieve sufficient spectral resolution.
Figure 6.
Schematic representation of the ESEEM spectra for a system with S = 1/2 and I = 5/2 in a disordered situation having weak hfi and nqi. The quadrupole-related splittings are not resolved in fundamental lines (να and νβ) but are resolved in the sum-combination line, νσ. The figure shows only the “generic” sum-combination line for I = 5/2 (see text).
We have seen that for I = 1/2 the sum-combination line is not affected by the hfi to first order (see Eq. (3)). For I > 1/2 the situation is similar if one considers the sum of να and νβ that correspond to the same ΔmI. Such sum-combination frequency does not contain contributions linear in hfi but retains the contributions linear in nqi. This provides for a possibility to determine the nqi parameters from 1D ESEEM spectra. In the following we will be mostly interested in the sum-combination line that corresponds to ΔmI = 1 because this line is broadened by the nqi (and the second-order hfi effects) to the least extent, has the largest amplitude of all of the sum-combination lines, and is therefore most easily detectable in the experimental spectra. The explicit expression for is
| (9) |
As follows from Eq. (9), the generic sum-combination harmonic splits into 2I subharmonics corresponding to different transitions mI ↔ mI + 1. The splitting between the frequencies of these subharmonics,
| (10) |
is twice as large as that between the fundamental subharmonics (see Eq. (8)). Taken together with the lack of the first order of hfi broadening, this substantially increases chances for observation of the quadrupole splittings in a 1D ESEEM experiment, and indeed this technique was successfully used to determine the 2H and 17O nqi of SO, as described in section 7.
The key phrase of the above theoretical discussion was “weak interaction,” meaning the hfi and nqi being weak compared to the nuclear Zeeman interaction. While the former two interactions represent a function of the composition and structure of the paramagnetic center, the Zeeman interaction is proportional to the magnetic field, B0, and is completely under the control of the experimentalist. Thus, in order to organize the weak interaction conditions, one simply has to select B0 that would provide νI > |aiso + TZZ|/2 and νI ± (aiso + TZZ)/2 ≫ k. This selection of B0 has to be accompanied by the corresponding selection of the mw frequency that would satisfy the resonance conditions for the electron spin (e.g., νmw = gβB0/h). Since at present pulsed EPR spectrometers are available that operate at νmw from ~2 GHz (S-band) to 130 GHz (D-band), the weak interaction conditions can be achieved for an extremely broad range of hfi and nqi parameters.
It might seem that the higher the B0 used in an experiment, the better. While this is certainly true from the point of view of the ease of interpretation of the spectra, some words have to be said about their detection. It is commonly recognized that (pulsed) ENDOR usually gains in sensitivity with increasing B0 and νmw (at least, for paramagnetic centers with S = 1/2). In ESEEM, however, the situation is different. As we will see in the next section, the ESEEM amplitude in the weak interaction case decreases as νI increases, and if the observed B0 is too high, the ESEEM may simply become unobservable. In addition, the shift of the sum-combination line is inversely proportional to νI (see Eqs. (3) and (4)), and at very strong B0 the νσ line becomes useless as far as the anisotropic hfi measurements are concerned. Therefore, in ESEEM experiments there always exists a range of B0 (and νmw) values that provide a compromise between the best conditions for the observation of the ESEEM spectra and the best conditions for their interpretation. The optimal B0 and νmw values depend on the hfi and nqi parameters of the studied nuclei and, to some extent, on the specific pulsed sequence used in experiment. In the following sections we will demonstrate the application of the theoretical results and considerations presented here to obtain the hfi and nqi parameters of different nuclei that belong to the ligands of the Mo(V) center of SO.
4. PULSED EPR TECHNIQUES USED IN THIS WORK
4.1. ENDOR
The ENDOR spectra contain only fundamental lines. As we mentioned before, for a nucleus with I > 1/2 the fundamental lines may overlap to a considerable degree, which makes ENDOR difficult to use for measurement of weak nqi, unless a good orientational selectivity is available or the characteristic width of the statistical distribution of hfi parameters is much smaller than the nqi splittings. However, as a frequency domain technique, ENDOR is suitable for detection of broad fundamental lines that are hard to detect by ESEEM due to fast damping of the modulation (see below). Of course, in order to detect very broad lines, the baseline distortions in the ENDOR spectra usually should be suppressed by randomizing the radiofrequency (RF) sweeps [27].
In this work we mainly used 1D pulsed ENDOR techniques such as Mims ENDOR [26], Davies ENDOR [29], and refocused Mims ENDOR [30]. The reasons for using this or that technique in each particular spectroscopic situation are well known [25], and we will not reiterate them here. Instead, we provide some details on a more exotic 2D Mims ENDOR technique [24] that we used to assess the full range of the 1H fundamental lines in complex and overlapping ENDOR spectra.
2D Mims ENDOR is a combination of time domain and frequency domain techniques. It consists in measuring the Mims ENDOR spectrum as a function of the time interval τ between the first two mw pulses of the three-pulse (stimulated) ESE pulse sequence used in this technique. The refocused Mims ENDOR pulse sequence (consisting of four mw pulses) can be used with equal success in such measurements. The RF pulse in both techniques is applied during the time interval T between the second and third mw pulses. The Mims ENDOR response (which is the difference between the stimulated ESE amplitudes with and without the RF pulse) is an oscillating function of τ:
| (11) |
where νRF is the radiofrequency, να and νβ are the fundamental frequencies, and νδ = |να − νβ|. The Fourier transformation (FT) of the τ-dependence results in a 2D Mims ENDOR spectrum:
| (12) |
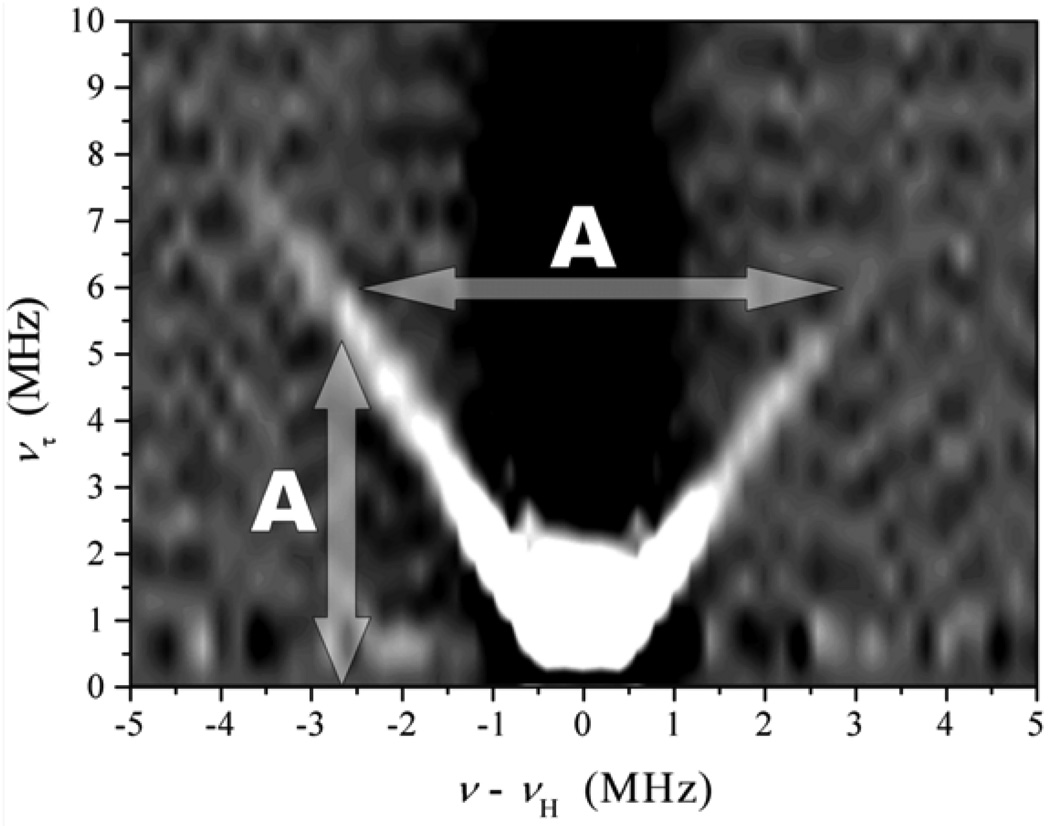
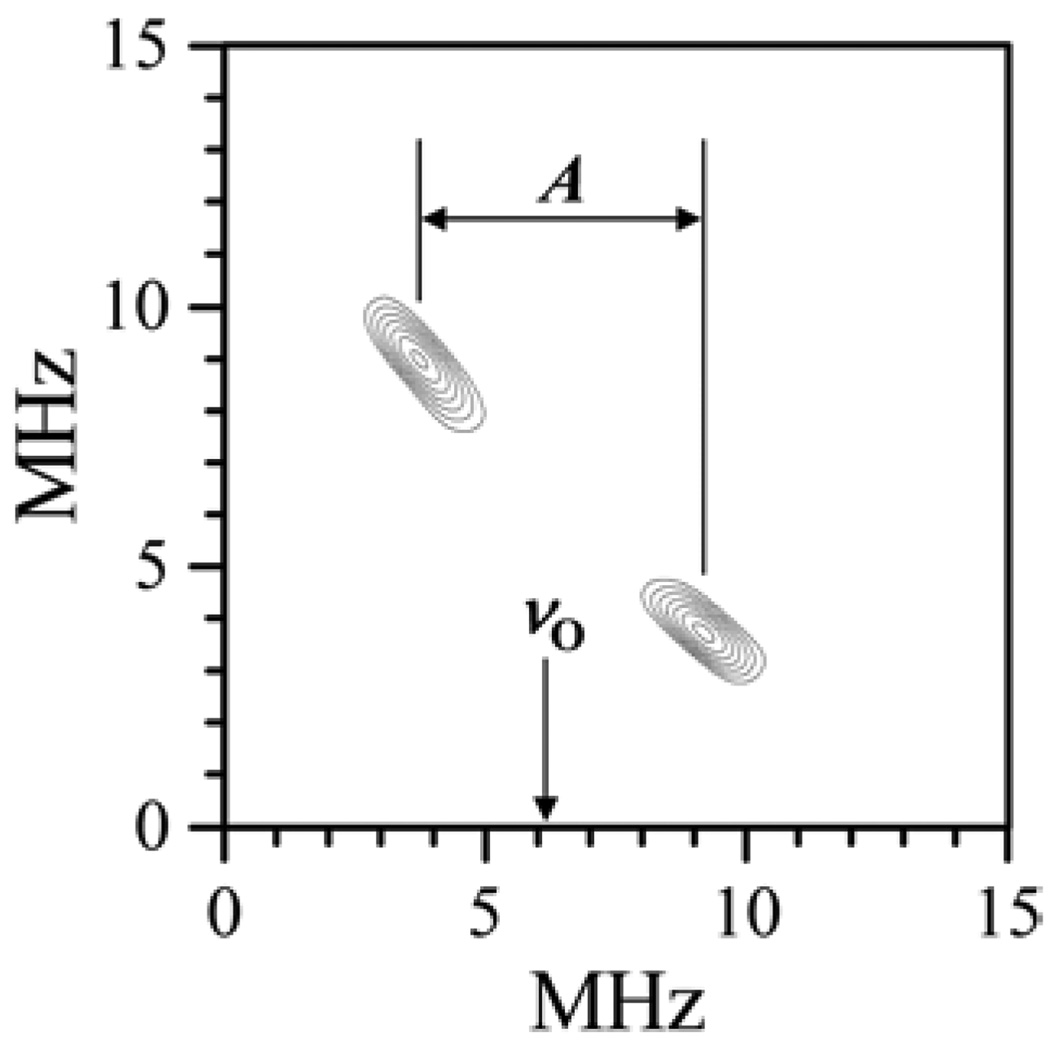
where ντ is the frequency corresponding to time interval τ. Thus, in a 2D spectrum of an oriented system the nuclear transitions will appear as peaks located at (να, νδ) and (νβ, νδ). In a disordered situation, the spectrum of a nucleus with I = 1/2 consists of ridges that are spread as far as max(aiso + TZZ) in the ντ direction and νI ± max(aiso + TZZ)/2 in the νRF direction (see Fig. 7). An example of the application of this technique will be shown in section 7.1.1.
Figure 7.
Example of 1H 2D Mims ENDOR spectrum of b-SO in H2O. Spectrum collected at νmw = 9.4196 GHz and B0 = 3423 G (at gY), which corresponds to the most nonselective field position. The vertical arrow shows that the spread of ridges in the ντ direction is A ≈ max(aiso + TZZ). In the νRF (horizontal) direction this spread is νI ± A/2. Therefore, the maximum hfi constant, A, evaluated from the spread is 7.5–8 MHz.
4.2. ESEEM Techniques
As we already mentioned, the sum-combination lines in the ESEEM spectra can provide useful information about the anisotropic hfi and nqi tensors. In order to observe these lines one usually employs two-pulse or four-pulse techniques. For example, the two-pulse ESEEM for a system with S = 1/2 and I = 1/2 is described by
| (13) |
where the modulation amplitude factor km is
| (14) |
The fundamental and combination lines are readily recognizable in the cosine FT spectrum of this ESEEM by the sign of their amplitude: positive for the former and negative for the latter.
For a higher nuclear spin the expressions describing the ESEEM become more complicated. For example, the two-pulse ESEEM for I = 5/2, assuming zero nqi, is [22]
| (15) |
and its spectrum contains a total of 2I(2I + 1) = 30 fundamental lines, as well as numerous combination lines. From Eq. (15) it follows that the fundamental harmonics (in the case of zero nqi ; see above) will have relative amplitudes ∝ (km)ΔmI. In the weak hfi limit (νI ≫ |aiso+TZZ|/2) km is approximately
| (16) |
and the amplitude of the ESEEM harmonics rapidly decreases with increasing ΔmI. The fundamental and combination lines of ΔmI = 1 transitions in such ESEEM spectra will have the largest amplitude compared to all other lines. It is also seen from Eq. (16) that the ESEEM amplitude decreases in proportion with and becomes unobservable if the magnetic field is sufficiently strong.
Since the ESEEM techniques work in the time domain, they have two intrinsic problems that result in distortion of the observed spectra. One such problem is mostly related to the fact that the mw pulses used in ESEEM experiments are usually very powerful, and the power dissipation in the mw resonator down to the levels safe for the receiver typically takes from several tens up to ~200 nanoseconds. Therefore, one cannot detect the ESEEM at time intervals between the mw pulses shorter than a certain minimal interval td called the dead time. This may cause difficulties in detecting broad (usually fundamental) lines for which the modulation decays within the dead time. To deal with this problem, one can use an approach where the ESE signal generated within the dead time and unobservable directly is refocused by an additional 180° mw pulse that is positioned in such a way as to make the refocused signal observable. One such technique, refocused primary (RP) ESEEM [31], was used by us to detect a broad and featureless sum-combination line from an OH(2) ligand proton in hpH SO (see §7.1.1).
The second problem is related to the finite time duration, Δt, of the recorded ESEEM that results in line broadening (~1/Δt) and loss of resolution in FT spectra. The time interval Δt is usually limited either by the electron spin relaxation time, or by the total time one wants to spend on data acquisition. The first situation is rather typical for the two-pulse (primary) and RP ESEEM techniques, where ESE signal decay is governed by phase relaxation with a characteristic time T2 (typically, <2–4 µs in frozen solutions). The second situation typically arises in HYSCORE. Here the ESE signal decay is governed by the longitudinal relaxation that has a characteristic time T1 ≫ T2, which creates a potential for achieving the spectral resolution on the order of 1/T1. However, since HYSCORE is a 2D technique, it is rather time consuming, and therefore one usually deliberately limits the detection intervals in both time dimensions so as to provide an acceptable overall data acquisition time.
In section 3 we discussed the use of sum-combination lines to determine the anisotropic hfi and nqi parameters. The simplest technique where the sum-combination line is observed is two-pulse (primary) ESEEM. As we just mentioned, this technique suffers from both a relatively long dead time (td ~ 100 ns) and a short detection interval (Δt ~ T2). In order to increase Δt while still being able to generate the νσ line, one can employ the four-pulse ESEEM sequence [32]. The ESE signal in this technique decays with a characteristic time T1 (usually ≫ T2) as a function of the time interval between the second and third mw pulses, T. This allows one to increase Δt to tens of microseconds and obtain a frequency resolution better than 0.1 MHz. However, because the ESEEM amplitudes and phases in the four-pulse sequence depend on the time interval τ between the first and second pulses, it is advantageous to perform the four-pulse measurements in a 2D format, T vs. τ. The 1D FTs along the high-resolution T coordinate spectrum, corresponding to different τ values, are then simply added together. As a result, one obtains a high-resolution 1D spectrum of what is called integrated (over τ) four-pulse ESEEM that has a virtually zero dead time (because the minimal time interval T in this technique is only determined by the finite duration of the mw pulses) and can therefore be easily phased to provide the fundamental lines of positive amplitude and combination lines of negative amplitude.
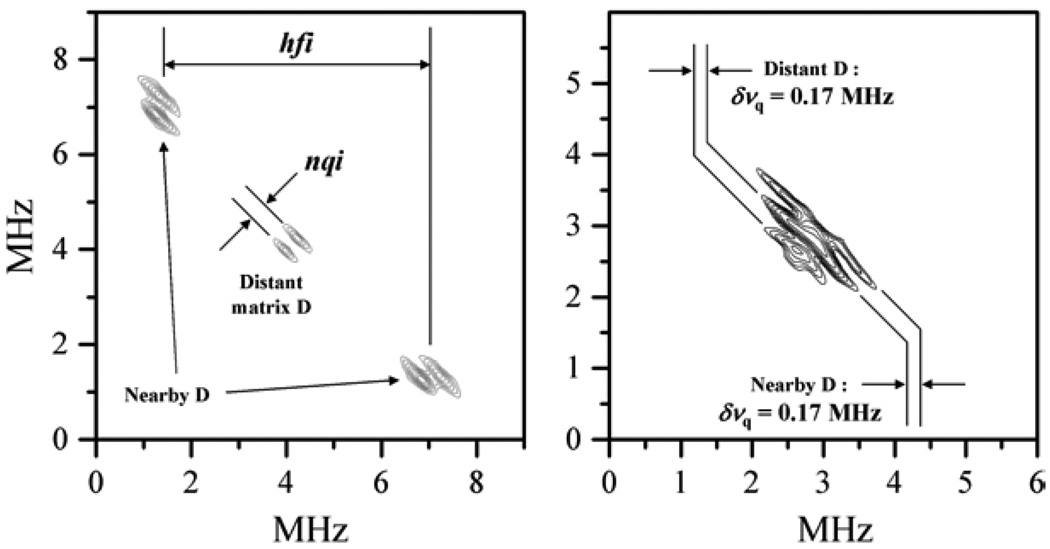
The 2D spectra of fundamental lines obtained by HYSCORE can also provide the spectral resolution necessary for detecting quadrupole interactions, although, as we mentioned, at the expense of a relatively long data acquisition time. In HYSCORE spectra the line splittings and shifts caused by hfi and nqi occur in mutually perpendicular directions (see Fig. 8), which makes the observation of nqi splittings possible even if the fundamental lines are broadened by the anisotropy and statistical distribution of the hfi. Employing HYSCORE one can also disentangle the nqi splittings due to distant matrix nuclei from those related to ligand nuclei that have an appreciable hfi, as is shown in Figure 8.
Figure 8.
Examples of hfi/nqi resolution by HYSCORE spectroscopy. Left panel: spectrum of pl-SO, lpH form reduced by Ti citrate in D2O buffer, collected at νmw = 17.283 GHz and B0 = 6252 G, which corresponds to the most nonselective field position near gY. In this particular case the isotropic hfi for the deuteron of the directly ligated (–OD) group is rather large and the fundamental lines in the spectrum are well separated from each other as well as from the distant “matrix” deuterons. The fundamental lines also show well-resolved quadrupole splittings. Right panel: spectrum of b-SO in D2O buffer, collected at νmw = 11.320 GHz and B0 = 4120 G, which corresponds to the most nonselective field position near gY. In this particular case the isotropic hfi for the deuteron of the directly ligated (–OD) group is close to zero, but due to rather large anisotropic hfi, the lines of the latter and lines of matrix deuterons are still well disentangled. In both situations the observed quadrupole splittings are typical for a hydroxyl deuteron. Reprinted from [43].
In the simplest cases of two- or three-pulse ESEEM and I = 1/2 the amplitudes of fundamental and combination lines are simply proportional to km (see, e.g., Eq. (13)). In more complex techniques the amplitudes of some or all of the ESEEM harmonics may depend on km in nonlinear fashion. For example, in integrated (over the time interval T between the primary ESE signal and the refocusing (third) pulse) RP ESEEM spectra of a system with I = 1/2 and weak hfi, the amplitudes of the sum and difference combination lines, νσ and νδ, are proportional to [31]
| (17) |
From Eqs. (14) and (17) one can see that if km ≪ 1, which corresponds to very weak anisotropic hfi (e.g., for matrix nuclei), then A(νσ) ∝ (km)2. On the other hand, if the Zeeman and anisotropic hfi become comparable, and especially if |aiso + TZZ| approaches 2 νI at least for some of the orientations, then km ~ 1 and A(νσ) ∝ km. These properties allow the integrated RP ESEEM to be used for suppressing the sum-combination line from distant matrix nuclei in order to facilitate the detection of the sum-combination lines from more strongly magnetically coupled nuclei. In contrast, in the spectrum of integrated four-pulse ESEEM of I = 1/2 under the weak hfi conditions [32]:
| (18) |
which, being expanded into a power series, always contains the term linear in km, irrespective of the strength of the anisotropic hfi.
The above review of various pulsed EPR techniques suggests a suitable strategy for determining the hfi and nqi parameters under weak interaction conditions. Since the measurements have to be performed at several B0 values corresponding to different positions in the g-anisotropic EPR spectrum of Mo(V), the entire experiment becomes quite time consuming, even if only 1D techniques are employed. Using 2D techniques increases the necessary experimental time dramatically. Therefore, our usual approach in such investigations is to start with 1D techniques (two-pulse ESEEM, Mims or Davies ENDOR), and utilize 2D methods (HYSCORE, RP ESEEM, 2D Mims ENDOR) mainly to resolve ambiguous situations.
5. GENERAL PROBLEMS IN EXTRACTION OF STRUCTURAL PARAMETERS FROM MAGNETIC RESONANCE PARAMETERS
As mentioned, the orientation-selective pulsed EPR measurements allow one to determine the orientation of the hfi and nqi tensors of the studied magnetic nuclei with respect to the g-tensor coordinate frame (g-frame). However, these parameters almost never represent a final product of the investigation, and one is usually interested in extracting from them some information about the geometrical structure, i.e., distances and directions to nearby nuclei from Mo(V). Solving this problem may encounter two difficulties.
The first difficulty is related to the fact that, while the electron spin is mainly situated on the Mo(V) ion, it is also distributed to some degree (~20%) over the ligand atoms. Whether this distribution is to be taken into account when interpreting the anisotropic tensor hfi of a given nucleus depends on how far this nucleus is located from the Mo ion. The contribution of the Mo(V) electron spin population, ρMo, to the anisotropic hfi is with good accuracy axial, with the principal components (T⊥, T⊥, −2T⊥), and the anisotropic hfi constant T⊥ is given by
| (19) |
where R is the distance between the Mo and the nucleus. While the spin population ρMo in SOs is actually about 0.8, for very distant nuclei (R ≫ 2 Å) one can formally take ρMo = 1 to calculate the total anisotropic hfi constant, which will include the spin population transferred to the ligands.
For nearby nuclei the anisotropic hfi tensor also includes intrinsic contributions from the spin population transferred to the ligand orbitals that are comparable with the “through-space” interaction with ρMo. For example, for an Mo–OH moiety, the oxygen spin population of ~5% will result in comparable characteristic values of the proton anisotropic hfi tensor components for Mo⋯H and O⋯H dipolar interactions [33]. Deconvolution of the experimental hfi tensor into the various contributions is complicated and, at present, often ambiguous. Therefore, accurate geometrical predictions based on the hfi data for nearby nuclei will generally require an extensive use of quantum chemical calculations. As we will show below, however, for some important qualitative comparative conclusions on the enzyme structures such a deconvolution may not be required.
The structural interpretation of the nqi may sometimes be more straightforward than that of the hfi. For example, the nqi tensor of the deuteron of a hydroxyl ligand is practically axial, with the main axis coinciding with the direction of the OD bond. Therefore, the direction of the main nqi axis of the deuteron established in an ESEEM or ENDOR experiment immediately gives one the direction of the OD bond with respect to the g-frame. Similarly, the main axis of the 17O nqi tensor of a terminal 17O oxo group is usually directed along the Mo-17O bond.
The second difficulty in structural interpretation of the hfi and nqi parameters is created by rather limited knowledge about the relationship between the g- and molecular coordinate frames. Of course, we have a qualitative idea about the directions of the g-tensor axes, but the departures of the complex structure from the ideal square pyramid result in uncertainties in the direction of g-axes on the order of tens of degrees [34]. Therefore, establishing the direction of an Mo-nucleus radius vector with respect to the g-frame does not automatically establish its direction with respect to the molecular frame.
Experimentally, this problem can be solved if the system has some nucleus whose position within the molecular frame is known with good accuracy and whose hfi and/or nqi tensor axes have a well-established direction with respect to the local structural elements. Studying such a marker nucleus by pulsed EPR, one can determine the orientation of the g-frame relative to the molecular frame. This orientation can then be used to transform the g-frame coordinates of all other nuclei back into the molecular frame.
Using a single marker nucleus may not result in complete and sufficiently accurate knowledge of the relative orientations of the g- and molecular coordinate systems, and therefore increasing the number of studied markers improves the accuracy of structural predictions. Two of the markers used in our investigations were the deuteron of the equatorial OD ligand and the 17O oxo group mentioned above. To some degree, the proton of the equatorial OH ligand whose isotropic hfi constant is sensitive to the dihedral angle between the MoOH plane and the plane of the dxy orbital, and the Cα proton of the cysteine ligand that we identified in the ENDOR spectra and which has the largest possible anisotropic hfi among the non-exchangeable protons, could also serve as a markers.
6. SAMPLE PREPARATION AND INSTRUMENTATION
The results presented below were obtained for a variety of SOs. The pl-SO was recombinant wild-type Arabidopsis thaliana sulfite oxidase that was expressed and purified as described [35]. For sulfite-reduced pl-SO, the protein was reduced with a 30-fold excess of sodium sulfite and then reoxidized by about 1/2 equivalent of ferricyanide (per enzyme) to maximize the Mo(V) signal. Reduction of pl-SO by a stoichiometric amount of Ti(III) citrate [36] produced the Mo(V) form of pl-SO directly. The b-SO, which is sulfite dehydrogenase from Starkeya novella, was expressed and purified as described [37]. The protein was reduced with a 20-fold excess of sodium sulfite. His-tagged recombinant human SO was purified from TP1000 cells containing pTG718 [38]. The protein was reduced with a 20-fold excess of sodium sulfite. Highly purified CSO was prepared as described [39]. As we discussed in the theoretical sections, different types of pulsed EPR experiments and different hfi/nqi parameters of the studied nuclei require different optimal magnetic fields and mw frequencies. This consideration does not only refer to the Mo enzymes, but to any paramagnetic centers. Therefore, we took effort to construct over the years a series of broadband pulsed EPR spectrometers continuously covering the range of mw frequencies from 2 to 18 GHz (corresponding to S, C, X and Ku bands) and from 26.5 to 42 GHz (Ka band) [40–42]. The flexible hard- and soft-ware design of these spectrometers allows one to run virtually any kind of ESEEM or pulsed ENDOR experiment. The success of many of our investigations of SOs can be attributed to the possibility of mw frequency optimization provided by this equipment. The typical measurement temperature was 20 K.
7. HIGH-RESOLUTION PULSED EPR SPECTRA, MAGNETIC RESONANCE PARAMETERS, AND STRUCTURAL IMPLICATIONS FOR VARIOUS FORMS OF SO
7.1. Exchangeable Protons: Similarities and Differences in SOs from Different Organisms
7.1.1. High-pH Forms
The x-ray structures of the various forms of SO show that the equatorial oxygen ligand in all forms has access to water (see Fig. 4). Therefore, it was expected that they would have exchangeable water or –OH ligands. For the lpH form of CSO, human SO and pl-SO (Ti(III) reduction), the presence of such a group was confirmed in cw-EPR investigations where hfi for an exchangeable proton coupled to Mo(V) was directly observed. (The cw-EPR spectrum of b-SO, as already mentioned in §2, does not depend on pH and resembles the hpH form of vertebrates.) The situation was more complicated for hpH forms (pH ~ 9). The cw-EPR spectra of wild-type SOs from all organisms are similar in H2O buffer and do not show any features that can be attributed to nearby exchangeable protons. Furthermore, changing the buffer from H2O to D2O does not alter the cw-EPR spectrum. The only indication of the possible presence of an exchangeable H2O related group was the observation of an Mo–17O hfi in H2 17O-enriched solution [20]. These earlier cw-EPR findings resulted in a number of tentative proposals about the nature of the exchangeable ligand(s) in the hpH form [21]. To finally prove the presence of OH or H2O ligand, a direct observation of the ligand proton was still necessary, and we therefore undertook ESEEM investigations of hpH SO from various organisms.
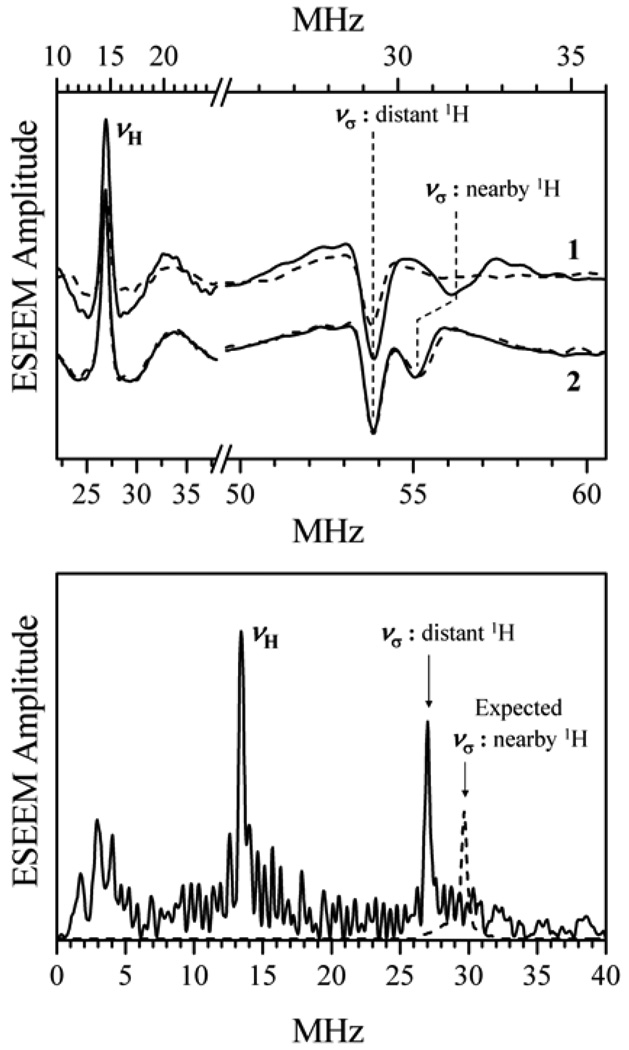
Our reasoning, which defined the strategy for the ESEEM experiments, was as follows. With an Mo–O distance of about 2.25 Å [4], the distance to the OH proton should be about 2.7 Å (if an sp3 hybridization of oxygen orbitals is assumed). The contribution of ρMo ~ 0.8 to the proton anisotropic hfi (Eq. (19)) can be estimated as |T⊥| ~ 3.2 MHz. In addition to this, however, a significant contribution is also to be expected from the spin population transferred to the hydroxyl oxygen. However, taking 3.2 MHz as a minimum possible characteristic anisotropic hfi constant, we can estimate, using Eq. (4), the minimal expected shift of the 1H sum-combination line from the 2 νI position. For an X-band experiment this shift amounts to Δνσ ~ 0.4 MHz and should be easily resolvable, at least in a four-pulse ESEEM experiment.
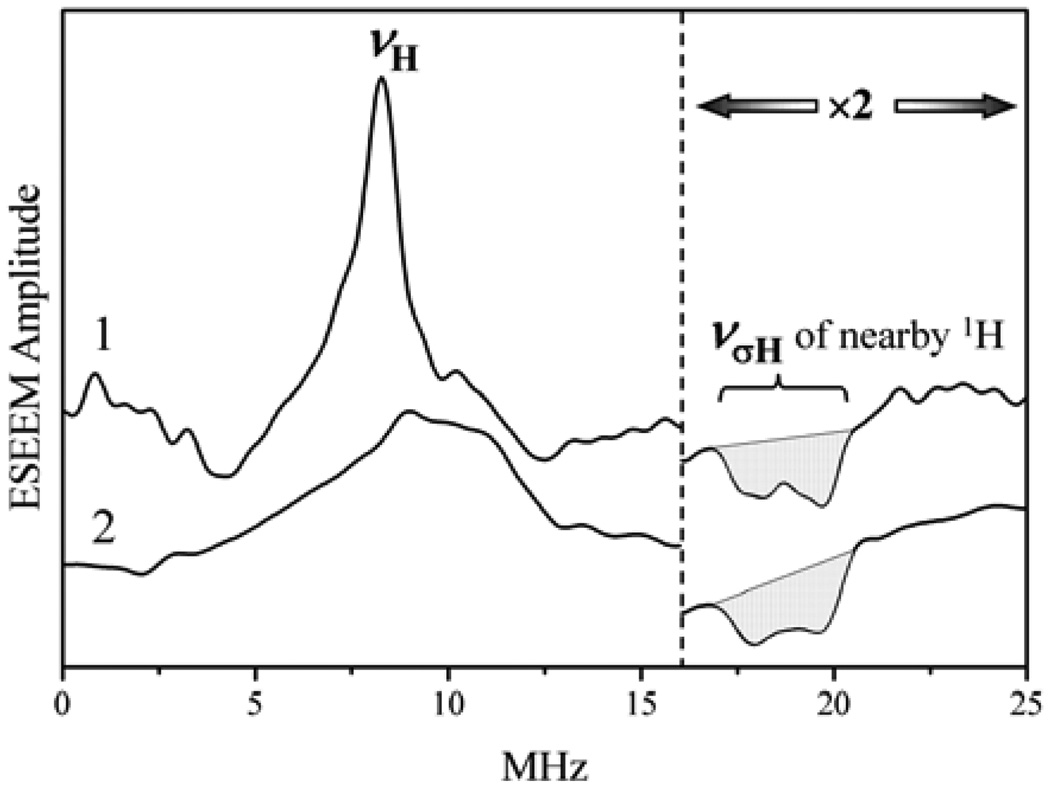
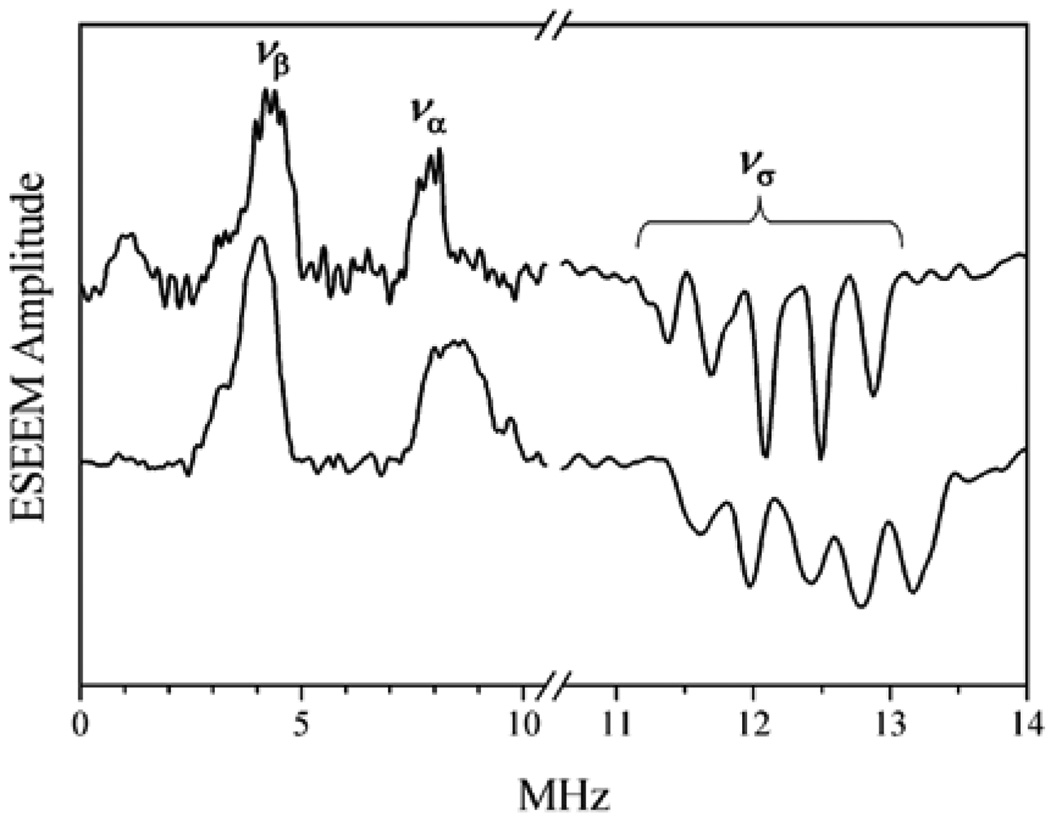
The primary ESEEM spectra of b-SO in the H2O buffer [43] immediately revealed the shifted sum-combination feature (see Fig. 9). To additionally confirm this assignment, experiments were performed in a D2O solution, where the shifted νσ line disappeared (see Fig. 9, top panel). In addition, the measurements at a higher mw frequency resulted in a decrease of the shift, as predicted by Eq. (4). The assignment thus confirmed that one can estimate the anisotropic hfi constant as T⊥ ~ −8 MHz. This T⊥ is substantially larger than that estimated above for the “through-space” interaction with ρMo. This discrepancy, as we mentioned, is caused by the dipole interaction of the hydroxyl proton with the electron spin population, ρO, delocalized to the hydroxyl oxygen atom. The contribution of ρO to the proton anisotropic hfi depends on the way that ρO is distributed over the oxygen orbitals. Therefore, the proton anisotropic hfi tensor, even though accurately determined (in the g-frame), is essentially useless for quantitative structural predictions until independent investigation of the distribution of ρO over the oxygen orbitals is performed and the contribution of ρO to the total anisotropic hfi tensor can be evaluated. Nonetheless, the studies of hpH SO are important because they allow one to directly observe the exchangeable protons of the equatorial ligand that could not be detected by cw EPR. This information is essential for developing reasonable hypotheses for the catalytic cycle of the SO enzymes.
Figure 9.
Top panel: Primary ESEEM spectra of b-SO. Solid and dashed traces 1, lpH form in H2O and D2O buffers, respectively; νmw = 9.4196 GHz; B0 = 3423 G (at gY); T = 20 K. Solid and dashed traces 2: H2O buffer at pH 7 and 9 respectively; νmw = 17.334 GHz; B0=6297 G (at gY); T = 20 K. Bottom panel: Primary ESEEM spectra of the hpH form of CSO in H2O buffer; νmw = 8.702 GHz; B0 = 3170 G (at gY). The expected position and amplitude of the sum-combination line (rescaled from top panel) of the nearby proton is shown by a dashed line. Reprinted from [43].
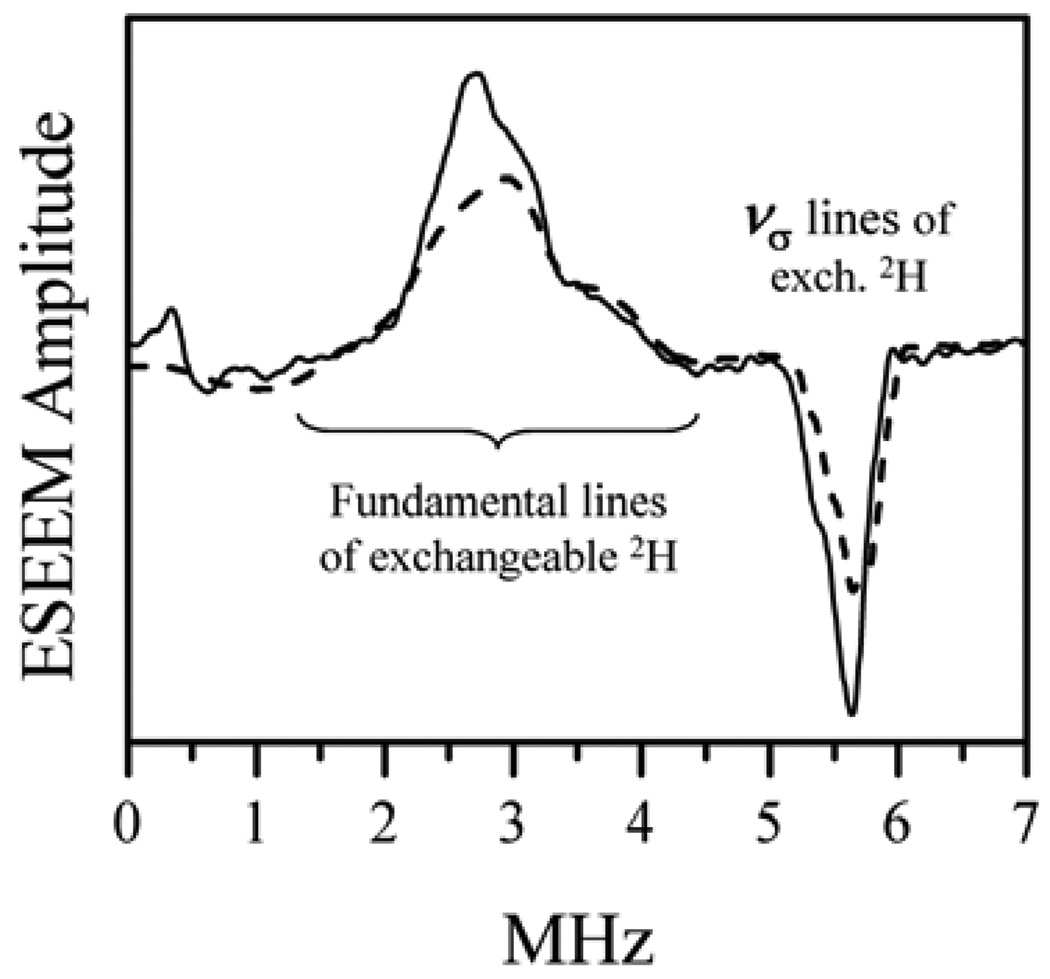
The large magnitude of the anisotropic hfi explains the absence of the fundamental lines in the ESEEM spectra presented in Fig. 9 because the time domain oscillations corresponding to such broad lines decay within the dead time. To recover the fundamental lines and determine the isotropic hfi one can use some zero dead time ESEEM techniques (e.g., RP ESEEM) or ENDOR. Another approach is to perform experiments in D2O solution. Exchange of 1H by 2H decreases the hfi by a factor of about 6.51. The anisotropic hfi will thus decrease from ~8 to ~1.3 MHz, which is substantially smaller than the inverse dead time. The ESEEM spectrum shown in Fig. 10 immediately revealed the fundamental lines, as well as the sum-combination line. As can be seen from Fig. 10, the fundamental lines arising from the α and β electron spin manifolds overlap and form a single feature centered at the 2H Zeeman frequency, which indicates that aiso is small and does not exceed T⊥.
Figure 10.
Solid trace: sum of integrated four-pulse ESEEM spectra of b-SO in D2O obtained at B0 = 4072 G (near gz), 4120 G (near gy), and 4140 G (near gx). Experimental conditions: microwave frequency, 11.320 GHz; pulse sequence, 20 ns (90°)–τ–20 ns (90°)–T–15 ns (180°)–T–20 ns (90°)–τ–echo; temperature, 20 K. Dashed trace: a simulation for a nonselective excitation of the entire EPR spectrum. Simulation parameters: nucleus, 2H; aiso = 0.2 MHz; T⊥ is uniformly distributed from −1.1 to −1.5 MHz; nuclear quadrupole coupling constant, e2Qq/h = 0.23 MHz. Reprinted from [43].
Knowing the anisotropic hfi it is possible to estimate aiso from numerical simulations of the fundamental lines in the ESEEM spectra. These simulations, however, should also include the 2H nqi, which somewhat complicates the problem because the hydroxyl/water 2H quadrupole coupling constant may vary somewhat as a result of hydrogen bonding. In addition, the direction of the nqi tensor axis with respect to the g-frame is not known in advance.
We discussed above that the information about nqi can in principle be obtained from the sum-combination line splittings in the (integrated) four-pulse ESEEM spectra or from the splittings of fundamental lines in 2D HYSCORE spectra. Figure 10 shows that for this particular case in the experimental integrated four-pulse ESEEM spectra the quadrupole splittings are not well resolved because the spectra of the nearby and distant (protein backbone, matrix water) deuterons are overlapping. In HYSCORE spectra, on the other hand, the spectral lines of distant and nearby deuteron(s) were separated (see Fig. 8) and e2Qq/h ≈ 0.23 MHz could easily be determined. This quadrupole coupling constant is typical for a 2H that belongs to a hydroxyl or a water molecule.
Using this quadrupole coupling constant we have performed numerical simulations of the integrated four-pulse ESEEM spectra for various trial values of aiso and angles between the main axes of hfi and nqi. These simulations resulted in aiso ≈ 0.2 MHz (~ 1.3 MHz as recalculated for 1H; see the simulated spectrum in Fig. 10). In spite of the concerns stated above, the aiso estimate was not sensitive to the details of nqi because a distribution of hfi had to be introduced in order to reproduce the smooth experimental lineshapes.
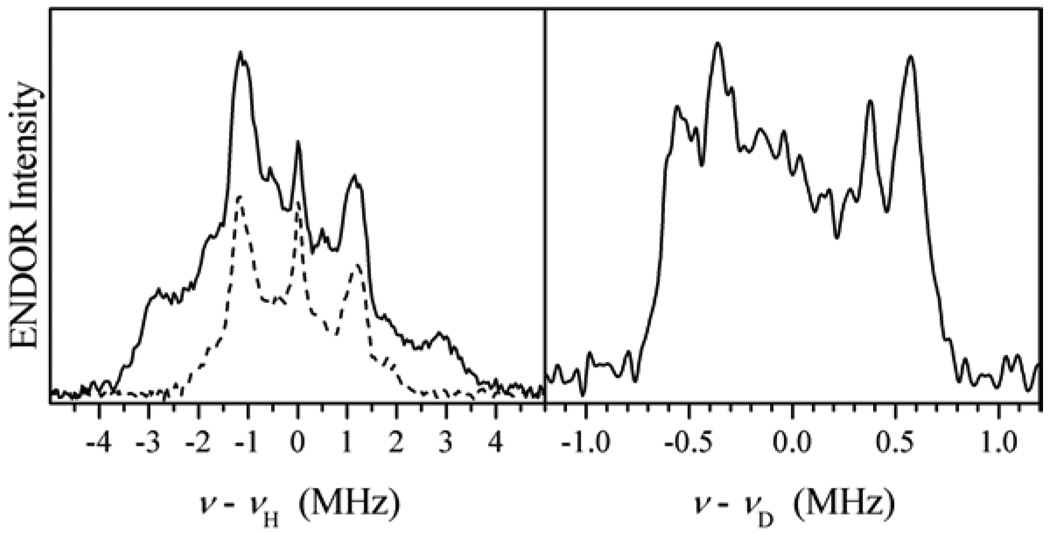
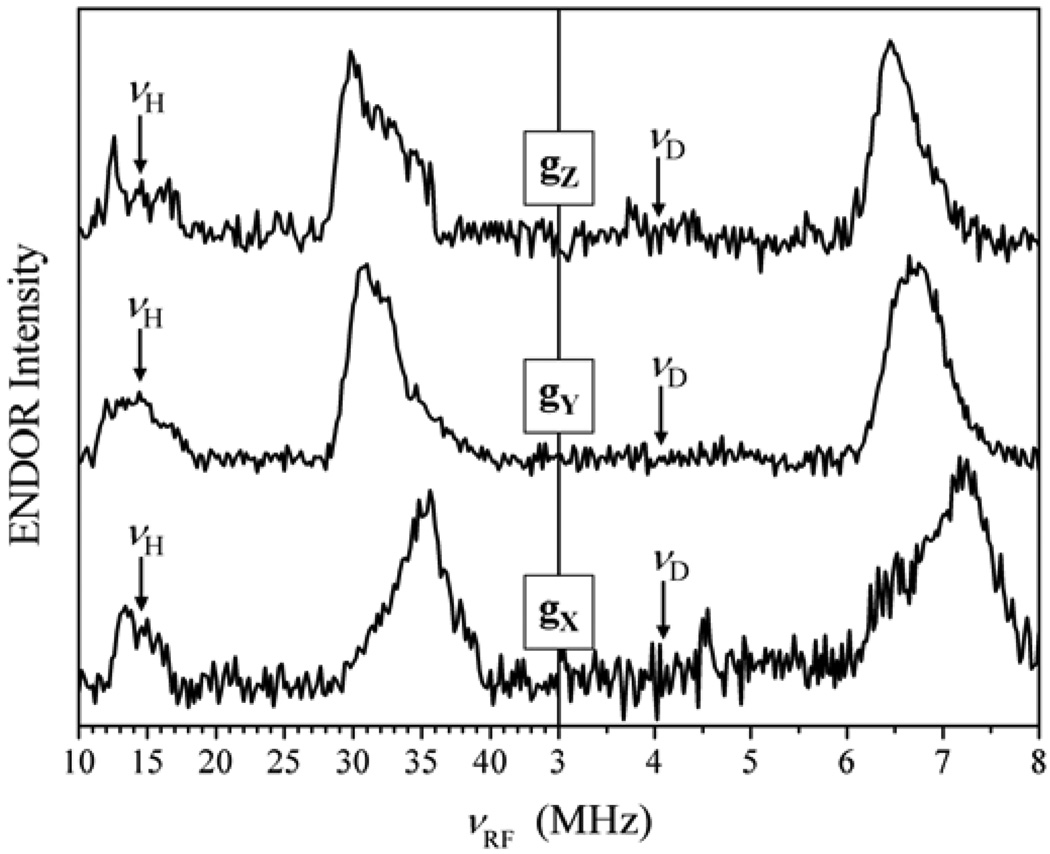
Additional experiments aimed at estimating aiso included pulsed ENDOR performed in protonated and deuterated buffers (see Fig. 11) and 2D Mims ENDOR (see Fig. 7). All the measurements confirmed that aiso for 1H does not exceed 2 MHz. From the literature on the d1 systems (to which Mo(V) belongs) it is well known that the isotropic hfi constant for the equatorial OH ligand proton strongly depends on the dihedral angle between the plane of the SOMO (dxy) and the Mo–OH plane (see [33] and the references therein). The maximal isotropic constant observed in model compounds for a dihedral angle of ~0° is ~45 MHz. Therefore, the experimental aiso < 2 MHz serves as a clear indication that the O–H bond is substantially out of the equatorial plane of the complex. The qualitative reconstruction of the Mo–OH(n) coordination geometry in b-SO based on the described hfi and nqi data is shown as Structure 1.
Figure 11.
ENDOR spectra of b-SO: νmw = 9.4196 GHz; B0 = 3385 G (at gZ). Left panel: 1H Davies ENDOR in H2O (solid line) and D2O (dashed line) buffers. Comparison of these two spectra shows that the external shoulders belong to exchangeable protons with hfi up to 7 MHz. Right panel: 2H Mims ENDOR in D2O buffer. The Spectrum presents only exchangeable deuterons. The maximal hfi (rescaled to protons) is ~7–7.5 MHz, in agreement with the spectra shown in the left panel.
Structure 1.
Qualitative structures for different forms of SOs based on pulsed EPR results.
Unlike b-SO, the hpH form of CSO did not show any clear lines attributable to nearby exchangeable protons (see Fig. 9) in similar primary ESEEM experiments. The reason for this was understood after the RP ESEEM technique [31] was applied at νmw ~ 5.4 MHz. At this mw frequency the ESEEM amplitude factor km ~ 1 for the nearby protons was achieved and their observation conditions were thus optimized. The ESEEM amplitude for the distant protons, however, was still reasonably small.
In the integrated RP ESEEM spectrum (Fig. 12) the νσ line of the nearby protons is readily observable. This line is quite broad (~5 MHz), suggesting that the hfi parameters are distributed over wide limits, and thus explaining the absence of the clear νσ line in the primary ESEEM spectra by the damping of the corresponding oscillations within the dead time. Numerical simulations of the RP ESEEM spectra (Fig. 12) revealed that the anisotropic hfi constant was indeed distributed over very broad limits, from T⊥ ≈ −4.1 MHz to T⊥ ≈ −7.3 MHz. Depending on the model of hfi distribution, the ligand may contain either one or two protons. Experiments performed in 2H buffer allowed estimation of the isotropic hfi (0–2 MHz), which is in the same range as for b-SO.
Figure 12.
Trace 1, cosine FT of integrated RP ESEEM of hpH form of CSO in H2O detected at νmw = 5.404 GHz, B0 = 1970 G (near gY). Trace 2, simulated for two nearby protons with aiso = 0 and distributed anisotropic hfi: T⊥ = −4.1 – 3.2 cos2 γ, where γ is defined as the angle between the plane of the Mo(V) dxy orbital and the Mo–O–H plane. A planar Mo–OH2 unit was assumed with the second proton being situated at a dihedral angle of γ + 180°.
Thus, the hpH form of CSO is generally similar to b-SO. Both forms have a directly coordinated –OH(n) group in the equatorial position, and the proton(s) of this group are substantially out of the dxy plane (based on the small magnitude of the isotropic hfi). However, the distribution of anisotropic interactions in CSO is apparently broader than that in b-SO (which follows from observation of the νσ line in the primary ESEEM spectra of b-SO). This anisotropic hfi distribution provides a clear indication that the geometry of the Mo–OH(n) in CSO is distributed over more broad limits than in b-SO. These structural variations can change the oxygen position relative to the equatorial plane of the complex, which may affect the distribution of ρO over the oxygen orbitals and modulate the O–H part of the dipolar interaction. In addition, some variation of Mo–H distances cannot be excluded. Therefore, as in the case of b-SO, we cannot quantitatively use the hfi to directly predict the structures of the Mo–OH(n) fragment, and such a situation will persist until a complete picture of the spin density transfer to oxygen can be investigated. Nevertheless, the qualitative outcome and implications for the SO active sites are quite clear.
Two more hpH forms of SO, human and plant [35,45], were investigated by pulsed EPR. It was found that the Mo(V) centers in these SOs certainly contain an equatorial OH(n) ligand. The spectroscopic, and thus structural, situation for this ligand was found to be more similar to that of CSO than of b-SO in that it shows a pronounced distribution of the anisotropic hfi constants. At present the factors that cause the structural differences between b-SO and hpH SOs from other organisms are not exactly clear, although plausible speculations are presented in section 8.
7.1.2. The lpH forms of CSO, HSO, and Ti(III) Citrate-Reduced pl-SO
The cw-EPR spectra of lpH forms of CSO, human SO, and Ti(III) citrate-reduced pl-SO show EPR splittings attributable to a neighboring exchangeable proton, and the approximate hfi parameters for this proton have been obtained from EPR simulations. More accurate estimates of the hfi parameters were later obtained from pulsed EPR experiments that included two- and integrated four-pulse ESEEM for samples in a buffered D2O solution, and pulsed ENDOR for H2O and D2O solutions. Some examples of pulsed EPR spectra are shown in Figures 8 and 13.
Figure 13.
Example of detection of magnetically strongly coupled proton in the lpH form of pl-SO from titanium(III) citrate reduction. Left panel: Pulsed Davies ENDOR spectra in H2O buffer; νmw = 9.4315 GHz. Right panel: ReMims ENDOR; D2O buffer; νmw = 17.283 GHz. For both panels spectra were collected at three field positions that correspond to gx, gy, and gz. Only one of the two fundamental lines (high-frequency lines) is shown in each spectrum.
The proton aiso in these lpH samples was found to be within the range 25–36 MHz (see Table 1), depending on the source organism, which is close to the highest aiso ~ 45 MHz ever observed for equatorial OH ligands in Mo complexes [45a]. This provided an indication that the OH ligand in lpH SO is oriented in such a way that the Mo–OH plane is close to the plane of the Mo(V) dxy orbital and the equatorial plane of the complex.
Table 1.
Parameters of hfi and 2H nqi Tensors, Found from Pulsed EPR Experiments for Exchangeable Ligands in lpH Forms (orientations of hfi and nqi tensors are relative to g-frames)
| 1H | 2H | |||||
|---|---|---|---|---|---|---|
| Aiso MHz | Anisotropic principal values, MHz |
Euler angles θh φh ψh |
e2Qq/h, MHz |
Euler angles θq, ϕq |
Organism | Ref. |
| 26 | 10.4, −5.2, −5.2 | 79°, 45°, NA | 0.225 | 90–95°, 24– 26° | CSO | [39] |
| 26.5 | 16.2, −7, −9.2 | 80°, 0°, 40–120° | CSO | [44] | ||
| 26.2 | 14.6, −6.7, −7.9 | 80°, 0°, 40–120° | human SO | [45] | ||
| 35.5 ± 4 | 10, −5, −5 | 70°, 20° | pl-SO | [35] | ||
| 10, −4, −6 | 70°, 20°, 30° | 0.25 | 85°, 38° | |||
For instance, according to numerical simulations of the ENDOR spectra of pl-SO, the isotropic hfi constant is distributed around the central value of 35.5 MHz, with the distribution width between the maximal slope points of Δaiso ~ 4 MHz. Assuming the dependence of aiso on the dihedral angle θMoOH between the MoOH plane and the plane of the dxy orbital to be aiso ~ (45 MHz) × cos2 θMoOH [33], one can estimate a variation of θMoOH with a width of about 10°, which gives an idea about the structural freedom for the Mo–OH fragment. Similar ranges of dihedral angle variations can be obtained for CSO and human SOs.
The anisotropic hfi was described by a rhombic hfi tensor (for details see Table 1) whose largest component was in the range 10–15 MHz. As in the case of hpH SO, the experimentally found anisotropic hfi tensor has contributions from spin populations on molybdenum and oxygen. The latter contribution is clearly evident from the fact that the angle between the main axes of the nqi and hfi tensors, θhq, (as estimated from data shown in Table 1) is found to be about 20°, which is significantly smaller than the ~50° expected for the normal geometry of an Mo–O–H fragment.
Semiquantitatively, the experimental θhq can be reproduced if one assumes the oxygen spin population ρO ~ 0.035 localized in the center of the oxygen atom. While this picture certainly serves qualitative purposes, it is overly simplistic in that it does not take into account the distribution of ρO over the oxygen orbitals. Therefore, it is difficult to use the proton anisotropic hfi data for quantitative structural conclusions without performing rigorous quantum chemical calculations.
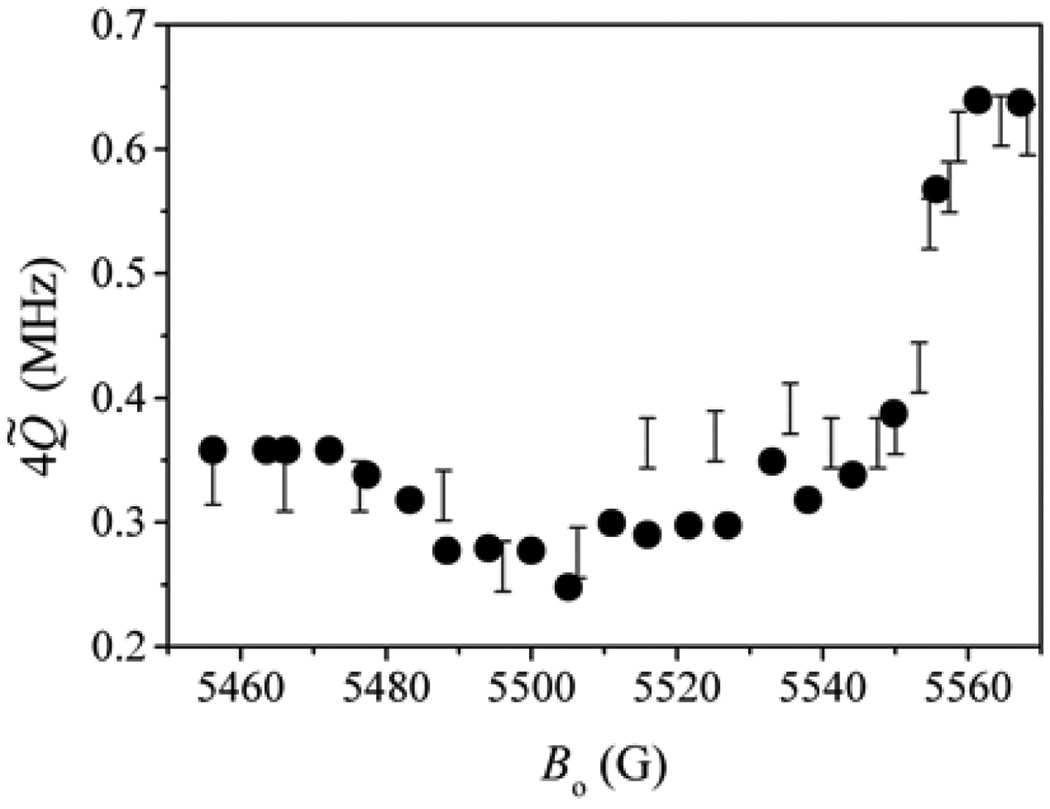
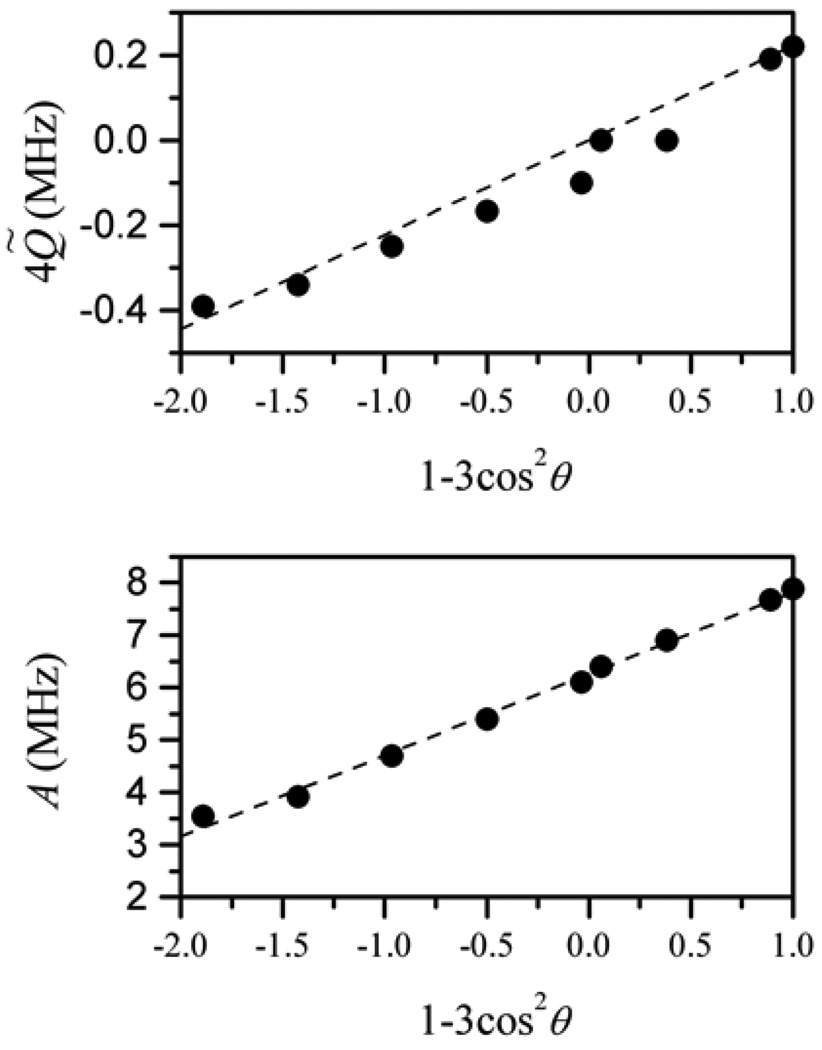
Investigation of the orientation dependence of the nqi of 2H was more promising. Such experiments were performed for CSO and Ti(III) citrate-reduced pl-SO, and nqi was determined from the splitting of the sum-combination line in four-pulse ESEEM spectra and from the splitting of the fundamental lines in HYSCORE spectra. The dependence of nqi-related splitting on the EPR position for CSO is presented in Figure 14. It is clear from this illustration that the direction of the O–D bond is close to the X-axis of the g-frame because the quadrupole splitting approximately doubles when the measurement position varies from gZ to gX. This conclusion confirms that the OH(D) bond is about parallel to the equatorial plane of the Mo complex.
Figure 14.
Experimental (bars) and simulated (circles) dependence of the quadrupole splitting of the sum-combination line of lpH CSO (in D2O) on the magnetic field. The simulations lead to a nuclear quadrupole coupling constant of 0.225 MHz and direction of the main axis (singular) of quadrupole tensor Zq in the g-frame as {0.903, −0.42, −0.087}, which corresponds to Euler angles θ = 95° and |φ| = 25°.
Numerical simulations showed that the polar (θq) and azimuthal (φq) angles of the nqi tensor axis relative to the g-frame were about 90 and 25°, respectively. Similar angles, about 95 and 38°, were found for pl-SO. The absolute value of e2Qq/h ≈ 0.23 MHz found from these simulations represents a typical quadrupole coupling constant for a hydroxyl deuteron. Thus, these data unambiguously identify a hydroxyl group as a ligand coordinated to Mo(V) in the lpH forms of SO and show that the Mo–OH plane is close to the XY-plane of the g-frame, as shown in Structure 1.
7.2. Groups Blocking Water Access to Mo(V)
7.2.1. Pi-Form of CSO [46]
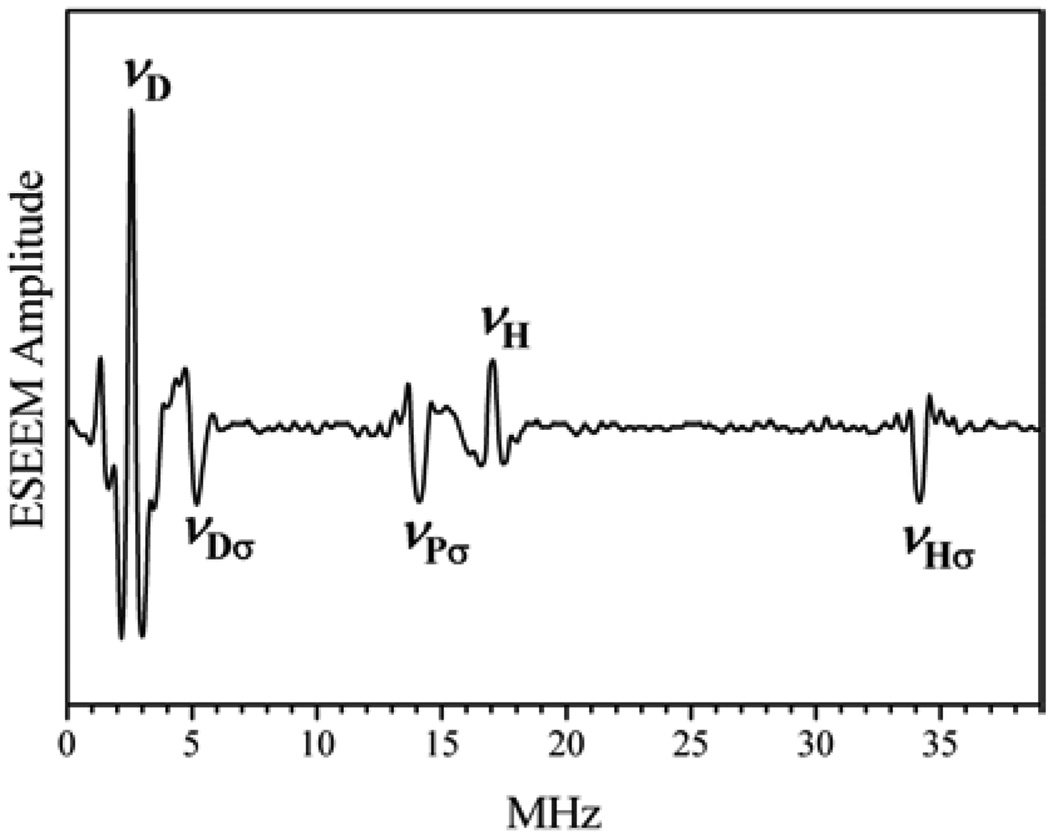
The direct ligation of –PO4 to Mo(V) in CSO was inferred from the observation of Mo(V)–17O hfi in the cw-EPR spectrum in 17O-enriched phosphate buffer [17]. However, the hfi of Mo(V) with 31P itself was never directly detected in the cw-EPR spectra. The absence of an observable Mo⋯P hfi in the cw-EPR spectra was not quite understandable since the isotropic constant for 31P is about an order of magnitude greater than that of a proton and hfi related splittings for the latter (as was discussed above) were readily observable. In pulsed EPR spectra (primary ESEEM) the presence of a P-containing ligand was observed immediately. The spectrum of Figure 15 shows only the νσ line related to 31P; no fundamental lines related to a 31P interaction were observed. Such a situation resembled that observed for the proton of an –OH group in b-SO at hpH (see above). However, the measurements for the Pi form of CSO, performed over a wide range of operational frequencies (~9 to ~15.5 GHz) and corresponding magnetic fields, demonstrated that this νPσ line was always located near 2 νI of 31P and, depending on operational frequency, was either upshifted or appeared to be downshifted from 2 νI, indicating the presence of “strong” hfi at some νmw’s. In addition, the normalized intensity of the νPσ line was small (if one assumed that the hfi was only due to the Mo⋯P dipolar interaction) and only slightly varied with νmw, in disagreement with Eq. (13). All these features indicated that the νPσ line originates from a 31P nucleus that has an appreciable and predominantly isotropic hfi with the Mo(V) center that is distributed over a broad range of magnitudes.
Figure 15.
Cosine Fourier transform of the primary ESEEM of Pi CSO in phosphate buffer in D2O, recorded at νmw = 11.001 GHz, B0 = 4000 G (near gX = 1.965). The labels near the spectral lines indicate their assignment to fundamental (νH, νD) or sum-combination (νHσ, νDσ, νPσ) lines of 1H, D, and 31P. Reprinted from [46].
Numerical simulations of the experimental ESEEM spectra confirmed this conclusion and resulted in the estimated range of aiso distribution from ~0 to ~20 MHz. hfi constants that large can only be expected for 31P that belongs to the equatorial ligand, and thus this investigation has unequivocally confirmed the PO43− coordination to the Mo center in SO. The range of aiso variation estimated for the Pi form of CSO is close to that observed in a similar d1 system having a dxy ground state, a vanadyl complex coordinated by PO43− groups [47–49].
The observed distribution of aiso signifies that the orientation of the PO43− ligand relative to the plane of the Mo(V) dxy orbital is not well defined but is distributed within certain limits (see Structure 1). This leads to a variation of the π-overlap between the dxy orbital and the orbital of the O–P bond, and to the changes in spin delocalization to the O–P bond orbital, as was discussed for the phosphate ligand in a vanadyl complex (see comment to [47]).
7.2.2. pl-SO, Tentative Observation of –SO42− Ligation to Mo(V) [35]
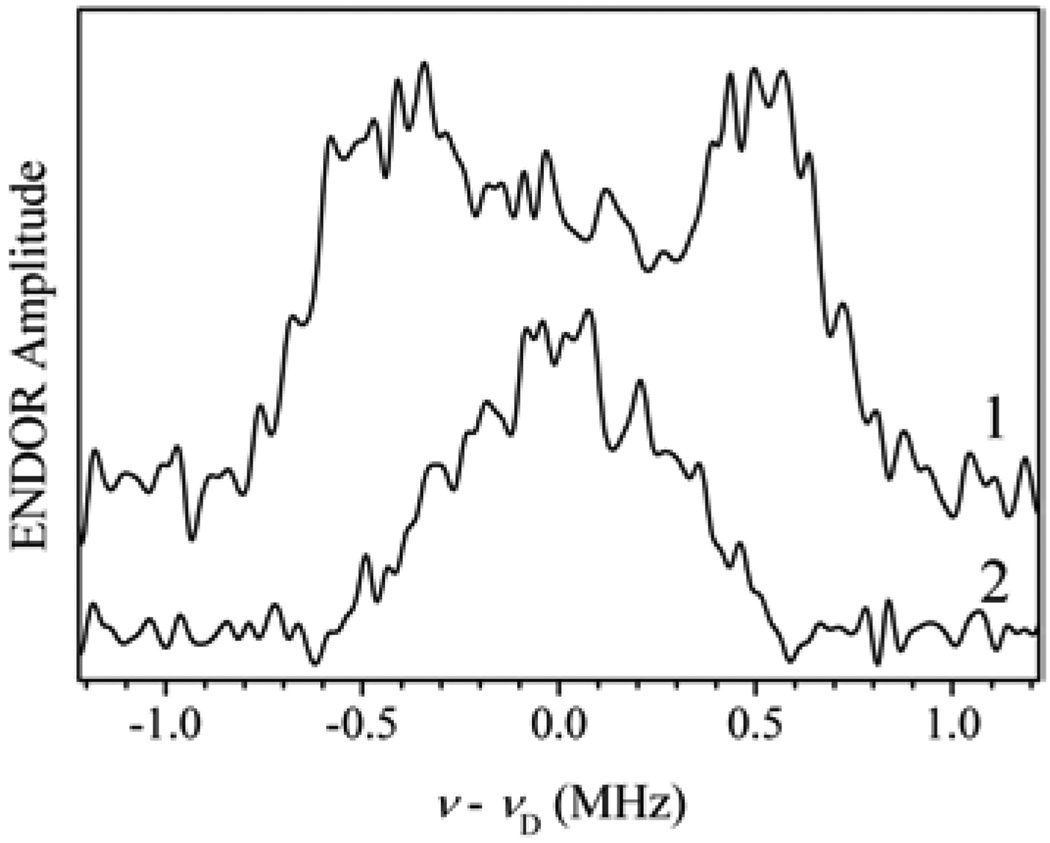
As mentioned in section 2, the features of the EPR spectra of vertebrate SOs are apparently independent of the method of reduction. For pl-SO, unlike SO of vertebrates, however, we found that reduction of the Mo center by sulfite at low pH produces an Mo(V) EPR signal distinctly different from that generated by reduction using titanium(III) citrate at low pH. The cw-EPR spectrum of sulfite-reduced pl-SO at low pH does not show any proton splittings and is similar to the atypical low pH spectrum observed for CSO in Mes buffer [19]. The lack of some features in the cw-EPR spectra does not, however, prove that certain ligands are absent from the Mo(V) coordination, as we already observed in a case of the hpH form of SO. Numerous pulsed EPR techniques were applied to this pl-SO reduced by sulfite, and none showed any evidence of a proton-containing group directly ligated to Mo(V) [35]. As an example, trace 2 in Figure 16 shows the 2H ENDOR spectrum of pl-SO recorded at gY. This spectrum is considerably narrower than that of hpH pl-SO (trace 1 in the same figure), which tells us that in the sulfite-reduced pl-SO at low pH the OH ligand is most likely missing from the Mo(V) coordination sphere. This conclusion is supported by a detailed analysis of the ENDOR and ESEEM data. The minimum Mo⋯H distance evaluated from these data is about 3.3–3.4 Å, much larger than the 2.8 Å expected for protons of Mo–OH2 or Mo–OH groups (Structure 1). The most reasonable explanation for the absence of a proton-containing ligand is to assume that the equatorial ligand is sulfate that is trapped by the “closed” structure of pl-SO at high pH [35]. This explanation is similar to that suggested earlier for the atypical CSO spectrum [19]. We regard this explanation as highly likely, although a final conclusion will only be possible when an experiment with 33S-enriched sulfite is performed. The biological implications of these findings are discussed in section 8.
Figure 16.
Trace 1, 2H Mims ENDOR spectrum of hpH pl-SO (pH 9.5) in D2O recorded at B0 = 5320 G (near gY). Experimental conditions: νmw = 14.800 GHz; mw pulses, 3 × 10 ns; interval τ between the first and second mw pulses, 400 ns; interval between the second and third mw pulses, 100 µs; RF pulse duration, 60 µs; temperature, ~20 K. Trace 2, 2H Mims ENDOR spectrum of lpH pl-SO at pH 6 in D2O recorded at B0 = 3410 G (near gY). νmw = 9.410 GHz. Other experimental conditions are the same as for trace 1. Reprinted from [35].
7.3. Nonexchangeable Protons [50]
The nearby nonexchangeable protons in the Mo site of SO belong to several neighboring amino-acid residues. For example, in CSO the Cα and Cβ protons of Cys185, Cγ proton of Arg138 and Cε proton of Tyr322, depending on possible conformations of these residues, could be within 3.5 Å from Mo(V), as follows from the x-ray structure reported in [4]. Most of these protons belong to amino-acid residues other than the cysteine residue coordinated to the Mo ion, and therefore their isotropic hfi constants are completely negligible. Also, the Cα and Cβ protons of the cysteine ligand are far from the sulfur atom that is directly bonded to Mo(V), and rather far from Mo(V) itself. It is therefore unlikely for these protons to have any appreciable isotropic hfi. Since the hfi of these “second sphere” protons are rather small, they are not resolved in cw-EPR spectra. In pulsed EPR experiments these protons are certainly detectable, but the overlapping spectra of several of them usually make the assignment of spectral features to specific protons very difficult or completely impossible even in the orientation-selective experiments. One can still use the pulsed EPR spectra to make comparisons between samples of different origin and/or preparation (e.g., differing in pH). Without assigning at least some of the spectral features to individual protons, however, these comparisons will invariably result in vague conclusions that the spectra, and thus the overall proton surroundings, are similar, or that they are different. In the latter case it is rather difficult to tell what structural rearrangements brought about the observed spectral change.
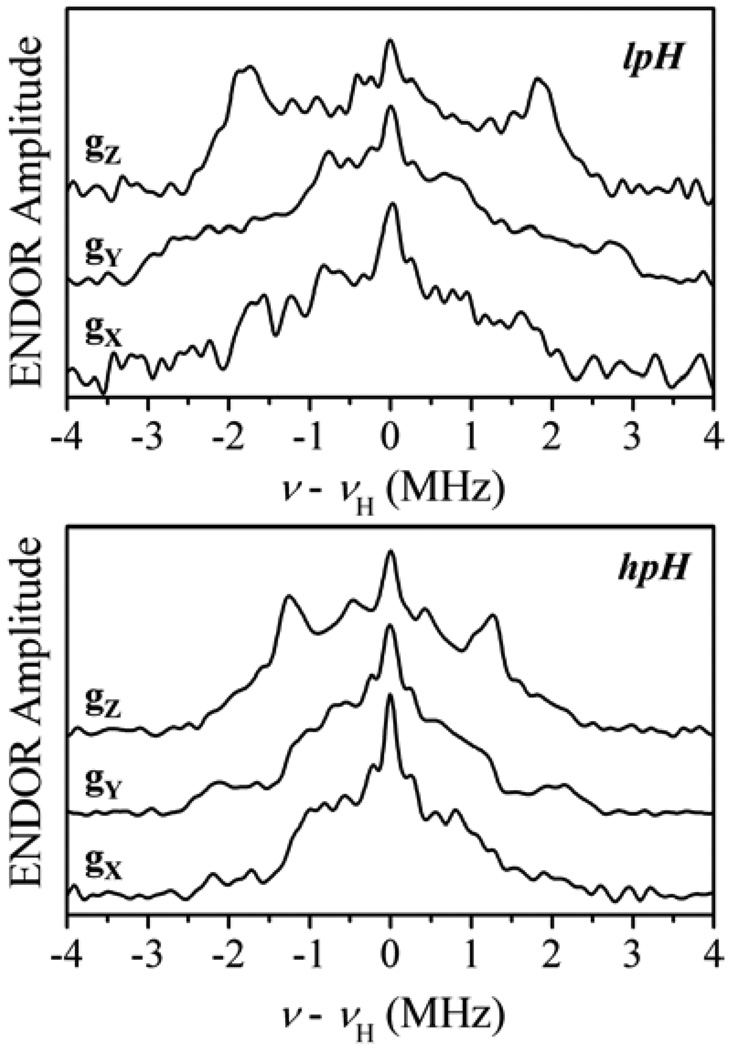
The only situation that can potentially result in positive assignments is when the pulsed EPR (e.g., ENDOR) spectrum has features that stand out from the overlapped spectral region, and there is an x-ray map of the site that allows one to assign these features with small degree of uncertainty. To illustrate such a situation we present examples of the Davies ENDOR spectra of nonexchangeable protons of lpH and hpH SO (Fig. 17). In both cases the spectra consist of multiple overlapping lines, and their appearance depends on the observation magnetic field. The spectral shapes and overall spectral widths for the lpH and hpH SO are different, irrespective of which EPR positions are compared. Apart from this general observation, one feature is immediately obvious: in the ENDOR spectra of lpH SO the largest observed splitting is about 6 MHz, while in the spectrum of hpH SO it is only about 4.4 MHz. These observations can be interpreted as pH-induced conformation changes that result in a change of distance between Mo and the closest nonexchangeable proton of the protein surroundings [50].
Figure 17.
Davies 1H ENDOR spectra of lpH CSO (top) and hpH CSO (bottom) in D2O buffer recorded at the EPR turning points. Experimental conditions: νmw = 9.449 GHz; mw pulse durations, 120, 60, and 120 ns.
In addition to the general conclusion made above, we can discuss the 6-MHz splitting in the lpH SO spectrum in some detail. Since this is the largest splitting in the set of ENDOR spectra taken at various EPR positions, it has to be assigned to the largest hfi tensor component. As we discussed above, for the second sphere protons it is a good approximation to assume the hfi tensor to be axial, with aiso ≈ 0 MHz and T‖ = −2T⊥ ≈ 6 MHz. Although from the ENDOR data it was impossible to tell just how small aiso really is, the measurement of the νσ line shift in the four-pulse ESEEM spectra performed at the mw frequency of 4.75 GHz resulted in T⊥ = −3.2 MHz. Combining this with the maximum ENDOR splitting of about 6 MHz, we immediately find that |aiso| does not exceed 0.5 MHz.
Now we can estimate the distance to the proton responsible for the 6 MHz feature, and the direction to this proton relative to the g-frame. In doing so we will reasonably assume that the anisotropic hfi is largely determined by the “through-space” Mo–H dipole interaction given by Eq. (19). The Mo–H distance estimated this way is about 2.8 Å [50]. To assign this distance to a specific nearby proton, we used the x-ray crystal structure for CSO. The best candidate for the evaluated distance was the Cα-proton of the coordinated cysteine residue.
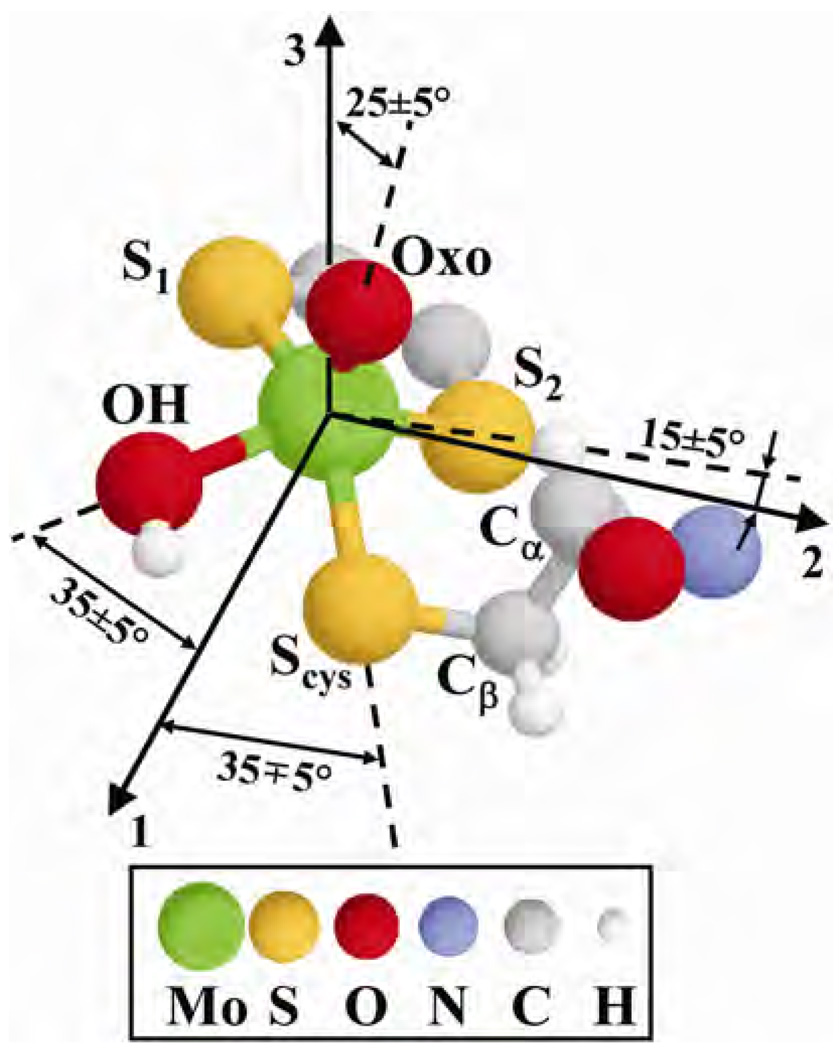
The decrease of the maximal splitting in the ENDOR spectra of hpH SO was then attributed to the slight variations of the conformation of the cysteine residue with pH, which consisted of two consecutive 15° rotations around the Cα–Cβ and Cβ–Sγ bonds. (Figure 18, which depicts the composite structure of SO obtained from all pulsed EPR experiments, gives an idea about the mentioned rotations.) This conformational change might reflect the overall change of the protein geometry with pH. To get more definitive information on the geometry of the coordinated cysteine residue will require preparation of SO enzyme in which the cysteine protons are selectively substituted by deuterons.
Figure 18.
Composite structure of lpH forms of SOs based on pulsed EPR results obtained for the OH ligand proton, cysteine Cα-proton, and 17O-exchanged oxo ligand (see data below). 1, 2, and 3 denote the g-frame axes. Reprinted from [64]. Please visit http://www.springer.com/978-0-387-84855-6 to view a high-resolution full-color version of this illustration.
7.4. Exchangeable Oxygen Ligands
7.4.1. Equatorial Oxygen Ligand
The importance of detailed knowledge of spin delocalization on the equatorial oxygen ligand has been repeatedly emphasized in this chapter because it is a key element in reconstructing the Mo–H anisotropic hfi tensor for the hydroxyl proton. It has long been known from cw-EPR that the –OH(n) moiety in SO is easily exchangeable in H2 17O buffer, and that the equatorial 17O hfi is strong (~25–30 MHz), and readily detectable [16,17,20]. A similar situation was observed in related enzymes and model compounds [51–54]. However, the cw EPR only gives general information on the magnitude of the hfi, from which it is impossible to extract the details of spin density distribution and the parameters of the quadrupole interaction. Investigation of equatorial oxygen ligands by pulsed EPR is potentially able to provide much more detailed information, but it is quite difficult because of the combination of strong hfi (tens of MHz) and the low magnetic moment of the 17O nucleus. As a result, the strong hfi condition (νI < |aiso + TZZ|/2) is satisfied for the equatorial 17O up to B0 ~ 20 kG, which corresponds to νmw ~ 60 GHz. In Ka-band (~ 30 GHz), the highest mw band currently available for our ESEEM measurements, the 17O ESEEM was only observable for lpH SO, which has somewhat weaker 17O hfi (~25 MHz), while the hpH SO did not show any 17O ESEEM in Ka band. The situation with such measurements is expected to improve when the construction of a high-power (1 W) W-band ESEEM spectrometer (which is in progress [55]) is completed. However, even in that case the spectra will only be possible to detect under the conditions close to Zeeman-hfi cancellation, νI ~ |aiso + TZZ|/2, which may complicate their interpretation because of nqi. At present we can only show the results of initial Ka-band experiments (see Fig. 19) that have helped to understand the experimental conditions necessary to optimize the ESEEM measurements for equatorial 17O in SO.
Figure 19.
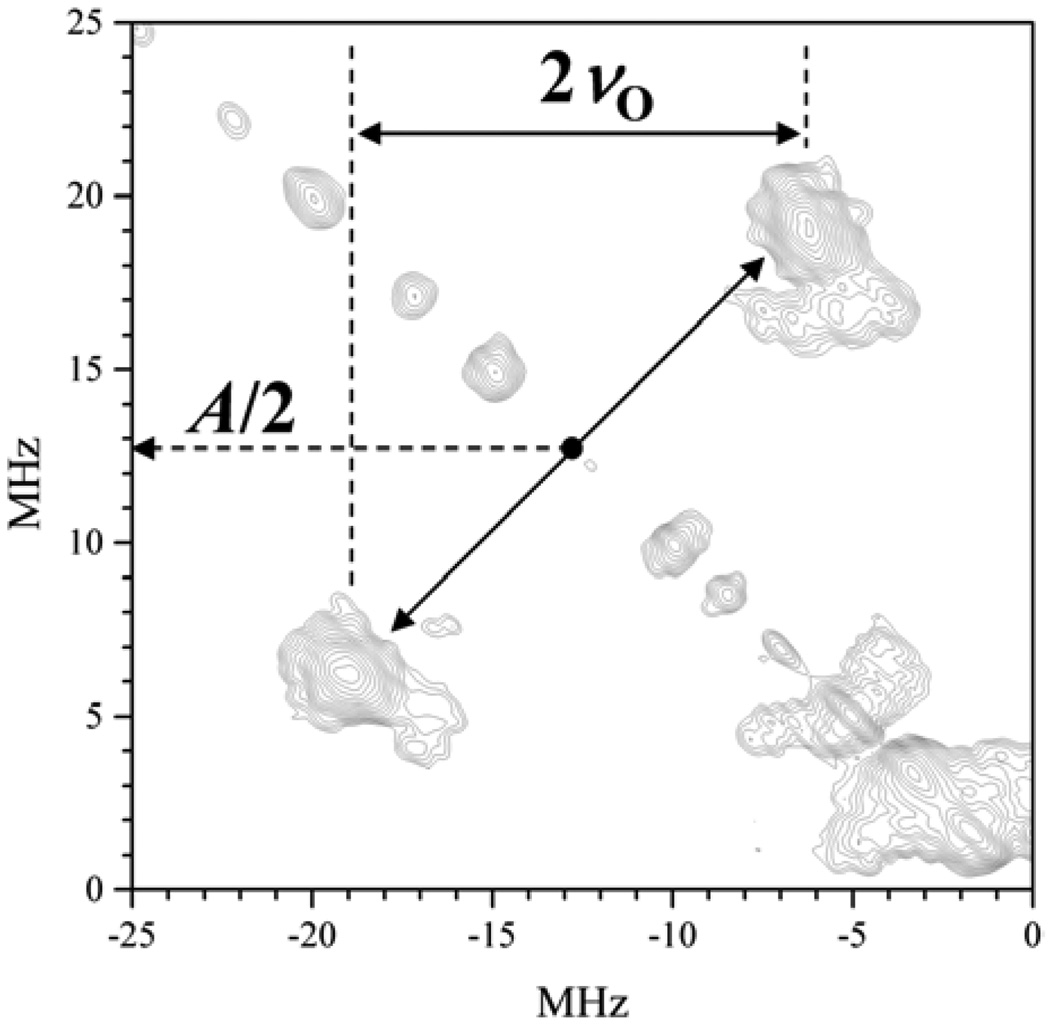
(−,+) quadrant of the HYSCORE spectrum of Mo(V) center in the lpH form of CSO in H2 17O buffer. The observed correlation lines are due to the strongly magnetically coupled equatorial 17OH ligand. They are located at A/2 ± νO, where A is the hfi constant and νO is the Zeeman frequency of 17O. Experimental conditions: νmw = 32.02 GHz; B0 = 1.1599 T (near gY); mw pulses, 10, 10, 11(π), and 10 ns; time interval between the first and second mw pulses, τ = 200 ns; temperature, 20 K. Reprinted from [42].
7.4.2. Axial Oxygen Ligand (oxo group)
Even though the situation with observing the equatorial 17O still remains complicated, it is at present completely resolved for the axial oxygen ligand that has been detected in both high- and low-pH forms of SO from various organisms [56]. To facilitate understanding of the spectral features for the axial oxygen ligand in the ESEEM spectra of SO, we will first describe the data obtained for a well-characterized model system, [Mo17O(SPh)4]− [57–61]. This compound has a well-defined geometry and is highly symmetrical (C4), with the symmetry axis coinciding with the Mo≡O bond. Accordingly, its EPR spectrum is characterized by axial g-anisotropy, with the principal g-values g‖ and g⊥ corresponding, respectively, to parallel and perpendicular orientations of the main g-tensor axis, Z, with respect to B0. The Z axis for this symmetric compound obviously coincides with the direction of the Mo≡O bond. The pulsed EPR measurements performed at an EPR position characterized by some g-value between g‖ and g⊥ select the complexes whose Z axis is oriented at a certain angle with respect to B0. This angle, θ, is defined by
| (20) |
The orientational selectivity in an axial spectrum is quite high and limited by either the intrinsic linewidth of the EPR spectrum or the spectral width of the mw pulses (whichever is larger).
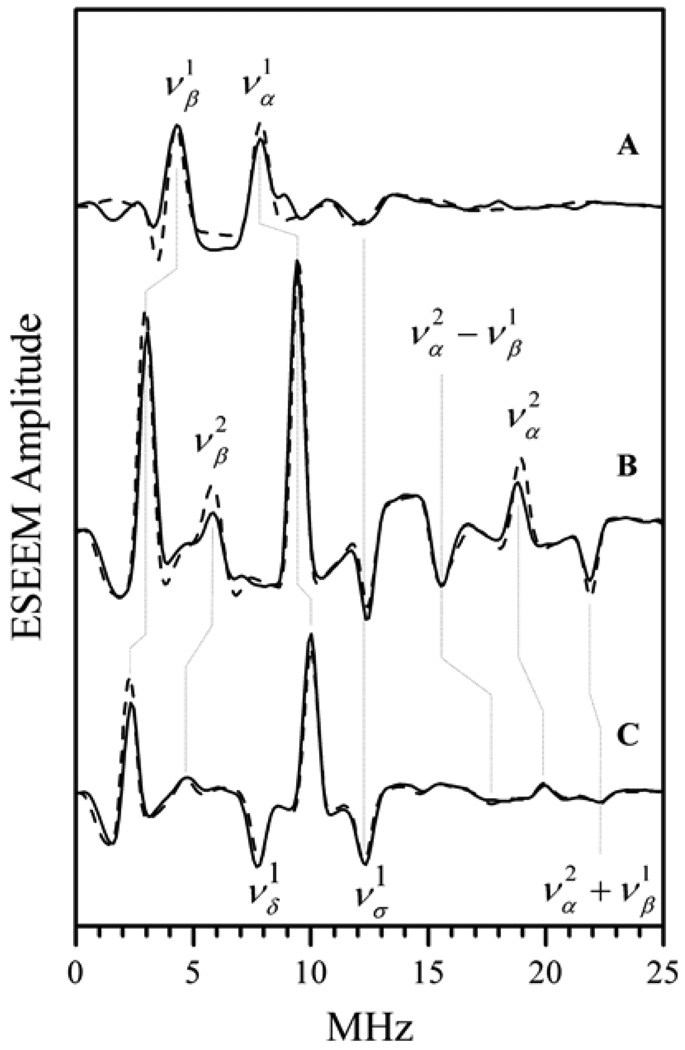
Investigations using cw EPR of this compound in liquid solution allowed one to estimate the axial 17O aiso ~ 6.5 MHz [52,53]. To improve the accuracy of aiso, as well as to measure the anisotropic hfi and nqi tensors, ESEEM measurements in a frozen solution were performed. From the cw-EPR aiso estimate we calculated that the weak hfi condition for this system can be reached at νmw ≥ 20 GHz. Therefore, our ESEEM measurements were performed at νmw ≈ 29 GHz, which is one of the frequencies we routinely use in our Ka-band experiments. After some experimenting we found that all the information we were interested in could most conveniently be obtained from basic two-pulse and integrated four-pulse ESEEM spectra. Due to high orientational selectivity, good mw excitation conditions and weak hfi conditions provided by our choice of the mw frequency, the primary ESEEM spectra were, as seen from an example presented in Figure 20, textbook illustrations of Eq. (12). The spectra of Figure 20 show the four generic lines (two fundamental and two combination) that would be observed in a system with I = 1/2, and their numerous combinations that are recognizable by their amplitude, phase, and position.
Figure 20.
Solid traces A, B, and C, cosine Fourier transforms (low-frequency part) of the primary ESEEM of [Mo17O(SPh)4]− obtained at various positions of the EPR spectrum: (A) B0 = 1040 mT, g⊥; (C) B0 = 1058.3 mT, g‖; and intermediate position (B) B0 = 1053.5 mT. Experimental conditions: mw frequency, 29.372 GHz, T = 20 K. Dashed traces show the corresponding simulated primary (2-pulse) ESEEM spectra. The simulation parameters were as follows: nucleus, 17O; isotropic hfi constant, aiso = 6.5 MHz; axial anisotropic hfi tensor with T⊥ = 1.6 MHz; axial nqi tensor with the quadrupole coupling constant (e2Qq/h) = 1.45 MHz. The axes of the hfi, nqi, and g-tensors were coincident. The assignments of the clearly visible lines are indicated. Reprinted from [57].
The νσ line in the two-pulse ESEEM spectra does not clearly show the 17O nqi-related splittings, but in the integrated four-pulse ESEEM these splittings are well resolved (see Fig. 21). The dependence of the nqi splitting on angle θ (see Eq. (20))) was measured by performing the ESEEM experiments at several EPR positions. This dependence is presented in Figure 22a, and it shows that the nqi tensor is axial and its main axis with good accuracy coincides with the Z axis of the g-frame and thus with the Mo≡O bond direction. The quadrupole coupling constant calculated from this dependence is e2Qq/h ≈ 1.45 MHz. The hfi tensor was also measured in the same experiments. As one can see from Figure 22b, the hfi tensor is also axial and its main axis is also parallel to the g-tensor axis Z. From the hfi orientation dependence, aiso ≈ 6.5 MHz and T⊥ ≈ 1.6 MHz were determined, the isotropic part being close to that found earlier from cw-EPR measurements [56]. As for the oxo- 17O nqi, this, to our knowledge, was the first such measurement for an oxo group in a metal complex. It is important that e2Qq/h of the oxo–17O is about four times smaller than that of 17O in water. Such a dramatic difference certainly allows one to unambiguously distinguish between ≡O and –OHn types of ligands. The well-defined geometry of this model compound allowed reliable DFT calculations to be performed that gave information about the electronic and spin populations of the oxygen orbitals. From these calculations it was instructional to learn that the s-character in the –oxo bond is nearly zero, and all three oxygen p-orbitals carry similar spin populations of about −0.017 per orbital. As a consequence, the total contribution of these spin populations to the anisotropic hfi is close to zero, and the experimental anisotropic hfi is thus mostly determined by the Mo–O dipolar interaction. Therefore, the model system investigations yielded detailed characterization of the hfi and nqi parameters of an oxo group.
Figure 21.
Cosine FT of integrated four-pulse ESEEM. Upper trace: [Mo17O(SPh)4]−, B0 = 10400 G, (g‖), νmw = 29.372 GHz. Low trace: hpH CSO; B0 = 10550 G (gZ), νmw = 29.34 GHz. In both experiments: mw pulses, 14, 14, 17, and 14 ns; dead time, Td = 20 ns. T = 20 K. Reprinted from [64].
Figure 22.
The dependences of the quadrupole (top panel) and dipolar (bottom panel) splittings on (1 – 3 cos2 θ), where θ is the angle between the g‖ axis (direction to the oxo group) and B0. The quadrupole splitting, was determined as the separation between the adjacent component lines of the νσ quintet and hfi as a frequency difference between fundamental lines, as shown in Fig. 21. Reprinted from [57].
In CSO and b-SO prepared in H2 17O-enriched buffer, very similar 17O hfi and nqi parameters were observed indicating that the oxo group of these compounds is exchangeable. As an example, Figure 23 presents the HYSCORE spectrum of the hpH form of CSO, which clearly demonstrates a 17O-related spectrum with an hfi constant of about 4–6 MHz, substantially less than that observed for an equatorial 17O. The HYSCORE spectra did not show resolved quadrupole splittings, indicating that quadrupole splittings are small. To resolve the quadrupole splittings, we have obtained the integrated four-pulse ESEEM spectra, in which these splittings were nicely resolved (see Fig. 21). It is obvious from Figure 21 that the quadrupole splittings in the model complex and in SO are similar. Numerical simulations of the spectra resulted in e2Qq/h ≈ 1.5 MHz, aiso ≈ 6.3 MHz, and |T‖/2| ≈ 1.7 MHz (see Table 2). The similarity in all parameters between the model system and SO unambiguously confirmed that the oxygen of the oxo ligand of CSO and b-SO is exchangeable. Some possible mechanisms of oxo group exchange are discussed in section 8.
Figure 23.
Quadrant(++) of the 17O HYSCORE spectrum of hpH CSO in H2 17O obtained at the gY position of the EPR spectrum. Experimental conditions: mw frequency, 29.252 GHz; Bo = 1063.2 mT; mw pulses, 4 × 15 ns; time interval τ between the first and second mw pulses, 200 ns; measurement temperature, 20 K; The value of the 17O Zeeman frequency νO is indicated by an arrow. Reprinted from [56].
Table 2.
hfi and nqi Parameters of 17O in [Mo17O(SPh)4]− and the Mo(V) Center of hpH CSO in H217O (orientations of hfi and nqi tensors relative to g-frames)
| System | [Mo17O(SPh)4]− | hpH CSO |
|---|---|---|
| aiso (MHz) | 6.5 | 6.3 |
| (T11, T22, T33) (MHz) | (1.6, 1.6, −3.2) | (2.4, 1, −3.4) |
| (θh, φh, ψh) | (0°, NA, NA) | (20°, 55°, −10°) |
| e2Qq/h (MHz) | 1.45 | 1.5 |
| η | 0 | 1 |
| (θq, φq, ψq) | (0°, NA, NA) | (20°, 55°, 0°) |
8. BIOLOGICAL IMPLICATIONS
X-ray structure determinations of CSO, pl-SO, and b-SO show nearly identical coordination about the molybdenum atom. A common chemical mechanism has been proposed for SOs involving the Mo(VI/V/IV) oxidation states, as shown in Scheme 1. A key feature of the catalytic mechanism is the generation of a transient paramagnetic Mo(V) state through a series of coupled electron–proton transfer steps. Consequently, detailed knowledge of the nearby proton environment of the Mo(V) states is essential for evaluating Scheme 1. Particularly important are the effects of changes in pH, anions in the medium, and mutations on the reactivities of SOs. X-ray crystallography cannot detect the hydrogen atoms in these complex, but similar, structures; however, pulsed EPR methods provide an extremely sensitive probe of protons that are close to the paramagnetic Mo(V) center. Addition of D2O enables exchangeable and nonexchangeable protons to be distinguished from one another. The above sections have reviewed the experimental procedures for investigation of the Mo(V) active site structures of SOs by high-resolution variable frequency pulsed EPR. These EPR studies show substantial structural diversity of the Mo(V) sites, particularly the arrangement of nearby exchangeable protons, even though the coordinates of the non-hydrogen atoms, as determined from x-ray crystallography, are very similar for all SOs.
Two examples illustrate the structural diversity of the Mo(V) sites of SOs that is beginning to be recognized. The dimeric pl-SO contains no prosthetic groups other than the molybdenum cofactor. The EPR spectra of this pl-SO depend upon the mode of reduction as well as pH. The signal resulting from reduction by sulfite at low pH shows no coupling to nearby exchangeable protons, even with careful pulsed experiments. However, reduction at low pH by Ti(III) citrate shows clear splitting from a single nearby exchangeable proton that is in the equatorial plane of the Mo(V) center and hydrogen bonded to the sulfur atom of the coordinated cysteine residue. Reduction of pl-SO by sulfite at high pH results in pulsed EPR spectra with couplings to nearby exchangeable protons, similar to the spectra of other SOs at high pH. Scheme 2 shows the postulated active site species that are consistent with these results. These unusual EPR properties of pl-SO are proposed to be directly related to the “open” and “closed” forms of the active site modulated by conformations of the active site arginine (Arg374) in combination with a more restricted substrate and water access to the active site of the plant enzyme than that found in vertebrate SOs plant SO paper?
Scheme 2.
Proposed reactions for formation of the Mo(V) forms of pl-SO observed by EPR. (1) pl-SO species formed by sulfite reduction at low pH that shows no exchangeable protons; (2) hpH species formed in both pl-SO and vertebrate SO; (3) lpH species formed in both pl-SO and vertebrate SO by direct reduction of the Mo(VI) center.
A second example illustrates the sensitivity of the Mo(V) site to perturbations of the hydrogen bonding environment through mutations of hydrogen bonding groups near the active site. All SOs have a conserved active site tyrosine that is hydrogen bonded to the equatorial oxygen ligand. In b-SO, mutation of this residue to phenylalanine (Tyr236Phe) substantially changes the EPR spectrum even though x-ray crystallography shows that the overall structure of the residues near the Mo active site is little changed [62]. In the wild-type b-SO enzyme the EPR spectrum is independent of pH [13,43], and pulsed EPR shows a nearby exchangeable proton (Figs. 9–11). However, for the Tyr236Phe mutant the EPR spectrum shows a strong pH dependence that closely resembles wild-type vertebrate enzymes, indicating that the hydrogen bonding network near the active site has been altered. This mutant also has reduced catalytic activity and does not undergo intramolecular electron transfer from Fe(II) to Mo(VI) [62]. At this point it is clear that high-resolution pulsed EPR methods can provide a detailed view of changes in the proton environment of the active site arising from mutations of nearby residues, especially those that disrupt the hydrogen bonding network that involves the oxo/hydroxo/aquo ligands of the Mo active site. However, direct information about the oxygen atoms of these coordinated oxo/hydroxo/aquo ligands of the Mo(V) center is essential for critically assessing the generally accepted mechanism proposed in Scheme 1.
SOs and other molybdenum enzymes use water as the source or sink of the oxygen atoms in the redox reactions of substrates. The mechanism for SOs shown in Scheme 1 involves hydrolysis of the Mo(IV)–SO4 complex by water (or OH−) followed by one-electron oxidation to give species that contain the MoVO(OHn) fragment. In the proposed mechanism of Scheme 1, the equatorial oxo ligand that is in a solvent exposed pocket exchanges with H2 17O to become an equatorial Mo–OHn unit. Support for this view comes from the large 17O hyperfine interactions originally observed for the hpH and lpH forms of CSO in H2 17O enriched solution. However, our high-resolution pulsed EPR studies of several SOs at Ka band (~30 GHz) have clearly shown that the axial Mo=O group of SOs also exchanges with H2 17O, from the unambiguous hfi and nqi interactions for an axial MoV≡O moiety. This result raises the intriguing possibility that the axial oxo group plays a more active role in the catalytic cycle of these enzymes than previously thought. Additional studies in H2 17O enriched systems, especially of mutant proteins and other molybdenum enzymes, will be needed to assess alternatives to the general mechanism for SOs of Scheme 1.
9. CONCLUSION
The technique of cw-EPR spectroscopy has been used to characterize SOs since 1971 [63]. This chapter demonstrates that structures of the transient Mo(V) states of SOs can be investigated by high-resolution pulsed EPR studies of the hfi and nqi of magnetic nuclei, such as 1H, 2H, 31P, and 17O. However, variable frequency instrumentation is essential to obtain the optimum experimental conditions for measuring the couplings of each type of nucleus; moreover, the optimum frequency may also depend upon the chemical nature of the ligand, e.g., Mo≡O, Mo–OH or Mo–OH2. Thus, ESEEM measurements at Ka band (~30 GHz) have enabled the first determination of the 17O hfi and nqi parameters for a terminal oxo ligand (Mo≡O), and the nqi parameters have clearly demonstrated that Mo≡O, Mo–OH, and Mo–OH2 can be distinguished from one another by their nqi signatures. The analysis of variable-frequency pulsed EPR data from SOs is aided by parallel studies of model compounds that contain key functional groups or which are isotopically labeled and thus provide benchmark data for enzymes, e.g., [Mo17O(SPh)4]−. These well-characterized Mo(V) centers are also amenable to high-level theoretical calculations of the spin density of the individual magnetic nuclei for direct comparison with experiment. Investigation of 17O-labeled systems has also required the development of simulation software and protocols for pulsed EPR spectra of magnetic nuclei with I > ½. An additional complication for analyzing the spectra of many types of ligands, e.g., –OH, –OH2, and –OPO33− results from their distributed orientations. Nonetheless, enormous progress has been made on the use of high-resolution variable frequency pulsed EPR methods to investigate the structures (Fig. 18 and Structure 1) and mechanisms (Schemes 1 and 2) of SOs during the past ~15 years [64], and the future is bright for the continued development and application of this technology to SOs, other molybdenum enzymes, and other problems in metallobiochemistry.
For SOs, some specific immediate challenges are: (1) synthesize model compounds with an Mo–17OH ligand to obtain reliable hfi and nqi parameters for this group; (2) synthesize model compounds labeled with 33S to obtain hfi and nqi parameters and spin densities for various types of S-containing ligands; (3) expand the library of mutants with compromised function and relate function to the hydrogen bonding structure of the active site; and (4) use pulsed electron–electron double resonance (ELDOR) to determine the Mo⋯Fe distance in CSO and b-SO.
Supplementary Material
ACKNOWLEDGMENTS
We gratefully acknowledge support by the National Institutes of Health (GM-37773 to J.H.E.) and grants from the National Science Foundation (DBI-0139459, DBI-9604939, and BIR-9224431) and the NIH Shared Instrumentation Program (S10 RR020959) for construction of the pulsed EPR spectrometers.
REFERENCES
- 1.Hille R. The mononuclear molybdenum enzymes. Chem Rev. 1996;96:2757–2816. doi: 10.1021/cr950061t. [DOI] [PubMed] [Google Scholar]
- 2.Hille R. Structure and function of mononuclear molybdenum enzymes. J Biol Inorg Chem. 1996;1:397–404. [Google Scholar]
- 3.George GN, Kipke CA, Prince RC, Sunde RA, Enemark JH, Cramer SP. Structure of the active site of sulfite oxidase: x-ray absorption spectroscopy of the Mo(IV), Mo(V), and Mo(VI) oxidation states. Biochemistry. 1989;28:5075–5080. doi: 10.1021/bi00438a026. [DOI] [PubMed] [Google Scholar]
- 4.Kisker C, Schindelin H, Pacheco A, Wehbi WA, Garrett RM, Rajagopalan KV, Enemark JH, Rees DC. Molecular basis of sulfite oxidase deficiency from the structure of sulfite oxidase. Cell. 1997;91:973–983. doi: 10.1016/s0092-8674(00)80488-2. [DOI] [PubMed] [Google Scholar]
- 5.Kisker C, Schindelin H, Rees DC. Molybdenum-cofactor-containing enzymes: structure and mechanism. Ann Rev Biochem. 1997;66:233–267. doi: 10.1146/annurev.biochem.66.1.233. [DOI] [PubMed] [Google Scholar]
- 6.Karakas E, Wilson HL, Graf TN, Xiang S, Jaramillo-Busquets S, Rajagopalan KV, Kisker C. Structural insights into sulfite oxidase deficiency. J Biol Chem. 2005;280(39):33506–33515. doi: 10.1074/jbc.M505035200. [DOI] [PubMed] [Google Scholar]
- 7.Bray RC. The inorganic biochemistry of molybdoenzymes. Q Rev Biophys. 1988;21:299–329. doi: 10.1017/s0033583500004479. [DOI] [PubMed] [Google Scholar]
- 8.George GN, Garrett RM, Prince RC, Rajagopalan KV. The molybdenum site of sulfite oxidase: a comparison of wild-type and the cysteine 207 to serine mutant using x-ray absorption spectroscopy. J Am Chem Soc. 1996;118:8588–8592. [Google Scholar]
- 9.Schrader N, Fischer K, Theis K, Mendel RR, Schwarz G, Kisker C. The crystal structure of plant sulfite oxidase provides insights into sulfite oxidation in plants and animals. Structure. 2003;11:1251–1263. doi: 10.1016/j.str.2003.09.001. [DOI] [PubMed] [Google Scholar]
- 10.Eilers T, Schwarz G, Brinkmann H, Witt C, Richter T, Nieder J, Koch B, Hille R, Hänsch R, Mendel RR. Identification and biochemical characterization of Arabidopsis thaliana sulfite oxidase a new player in plant sulfur metabolism. J Biol Chem. 2001;276:46989–46994. doi: 10.1074/jbc.M108078200. [DOI] [PubMed] [Google Scholar]
- 11.Kappler U, Bailey S. Molecular basis of intramolecular electron transfer in sulfite-oxidizing enzymes is revealed by high resolution structure of a heterodimeric complex of the catalytic molybdopterin subunit and a c-type cytochrome subunit. J Biol Chem. 2005;280:24999–25007. doi: 10.1074/jbc.M503237200. [DOI] [PubMed] [Google Scholar]
- 12.Toghrol F, Southerland WM. Purification of Thiobacillus novellus sulfite oxidase: evidence for the presence of heme and molybdenum. J Biol Chem. 1983;258:6762–6766. [PubMed] [Google Scholar]
- 13.Kappler U, Bennett B, Rethmeieri J, Schwarz G, Deutzmann R, McEwan AG, Dahl C. Sulfite:cytochrome c oxidoreductase from Thiobacillus novellu. J Biol Chem. 2000;275:13202–13212. doi: 10.1074/jbc.275.18.13202. [DOI] [PubMed] [Google Scholar]
- 14.Barber MJ, Neame PJ. A conserved cysteine in molybdenum oxotransferases. J Biol Chem. 1990;265:20912–20915. [PubMed] [Google Scholar]
- 15.Garton SG, Garrett RM, Rajagopalan KV, Johnson MK. Resonance Raman characterization of the molybdenum center in sulfite oxidase: identification of Mo=O stretching modes. J Am Chem Soc. 1997;119:2590–2591. [Google Scholar]
- 16.Lamy MT, S Gutteridge S, Bray RC. Electron-paramagnetic-resonance parameters of molybdenum(V) in sulphite oxidase from chicken liver. Biochem J. 1980;185:397–403. doi: 10.1042/bj1850397. [DOI] [PMC free article] [PubMed] [Google Scholar]
- 17.Gutteridge S, Lamy MT, Bray RC. The nature of the phosphate inhibitor complex of sulphite oxidase from electron-paramagnetic-resonance studies using oxygen-17. Biochem J. 1980;191:285–288. doi: 10.1042/bj1910285. [DOI] [PMC free article] [PubMed] [Google Scholar]
- 18.Bray RC, Gutteridge S, Lamy MT, Wilkinson T. Equilibria amongst different molybdenum(V)-containing species from sulphite oxidase: evidence for a halide ligand of molybdenum in the low-pH species. Biochem J. 1983;211:227–236. doi: 10.1042/bj2110227. [DOI] [PMC free article] [PubMed] [Google Scholar]
- 19.Bray RC, Gutteridge S, Lamy MT, Wilkinson T. Evidence from electron-paramagnetic-resonance spectroscopy for a complex of sulphite ions with the molybdenum centre of sulphite oxidase. Biochem J. 1982;201:241–243. doi: 10.1042/bj2010241. [DOI] [PMC free article] [PubMed] [Google Scholar]
- 20.Cramer SP, Johnson JL, Rajagopalan KV, Sorrell TS. Observation of 17O effects on MoV EPR spectra in sulfite oxidase; xanthine dehydrogenase, and MoO(SC6H5)4. Biochem Biophys Res Commun. 1979;91:434–439. doi: 10.1016/0006-291x(79)91540-7. [DOI] [PubMed] [Google Scholar]
- 21.George GN. The proton spin-flip lines of Mo(V) EPR signals from sulfite oxidase and xanthine oxidase. J Magn Reson. 1985;64:384–394. [Google Scholar]
- 22.Dikanov SA, Tsvetkov YuD. Electron spin-echo envelope modulation (ESEEM) spectroscopy. Boca Raton, FL: CRC Press; 1992. [Google Scholar]
- 23.Raitsimring AM, Astashkin AV, Baute D, Goldfarb D, Caravan P. W-band 17O pulsed electron nuclear double resonance study of gadolinium complexes with water. J Phys Chem A. 2004;108:7318–7323. [Google Scholar]
- 24.Liao PF, Hartmann SR. Determination of Cr–Al hyperfine and electric quadrupole interaction parameters in ruby using spin-echo electron-nuclear double resonance. Phys Rev B. 1973;8:69–80. [Google Scholar]
- 25.Schweiger A, Jeschke G. Principles of pulse electron paramagnetic resonance. Oxford UP: Oxford; 2001. [Google Scholar]
- 26.Höfer P, Grupp A, Nebenfüher H, Mehring M. Hyperfine sublevel correlation (HYSCORE) spectroscopy: a 2D ESR investigation of the squaric acid radical. Chem Phys Lett. 1986;132:279–282. [Google Scholar]
- 27.Epel B, Arieli D, Baute D, Goldfarb D. Improving W-band pulsed ENDOR sensitivity—random acquisition and pulsed special TRIPLE. J Magn Reson. 2003;164:78–83. doi: 10.1016/s1090-7807(03)00191-5. [DOI] [PubMed] [Google Scholar]
- 28.Mims WB. Pulsed ENDOR experiment. Proc Roy Soc. 1965;283A:452–457. [Google Scholar]
- 29.Davies ER. A new pulse ENDOR technique. Phys Lett A. 1974;47:1–2. [Google Scholar]
- 30.Doan PE, Hoffman BM. Making hyperfine selection in Mims ENDOR independent of deadtime. Chem Phys Lett. 1997;269:208–214. [Google Scholar]
- 31.Astashkin AV, Raitsimring AM. Refocused primary echo: a zero dead time detection of the ESEEM. J Magn Reson. 2000;143:280–291. doi: 10.1006/jmre.1999.1988. [DOI] [PubMed] [Google Scholar]
- 32.Van Doorslaer S, Schweiger A. A two-dimensional sum combination frequency pulse EPR experiment. Chem Phys Lett. 1997;281:297–305. [Google Scholar]
- 33.Raitsimring A, Astashkin AV, Feng C, Enemark JH, Nelson K, Rajagopalan KV. Pulsed EPR studies of the exchangeable proton at the molybdenum center of dimethyl sulfoxide reductase. J Biol Inorg Chem. 2003;8:95–104. doi: 10.1007/s00775-002-0393-8. [DOI] [PubMed] [Google Scholar]
- 34.Cosper M, Neese F, Astashkin AV, Carducci MD, Raitsimring A, Enemark JH. Determination of the g-tensors and their orientations for cis,trans-(L–N2S2)MoVOX (X = Cl, SCH2Ph) by single-crystal EPR spectroscopy and molecular orbital calculations. Inorg Chem. 2005;44:1290–1301. doi: 10.1021/ic0483850. [DOI] [PubMed] [Google Scholar]
- 35.Astashkin AV, Hood BL, Feng C, Hille R, Mendel RR, Raitsimring AM, Enemark JH. Structures of the Mo(V) forms of sulfite oxidase from Arabidopsis thaliana by pulsed EPR spectroscopy. Biochemistry. 2005;44:13274–13281. doi: 10.1021/bi051220y. [DOI] [PubMed] [Google Scholar]
- 36.Codd R, Astashkin AV, Pacheco A, Raitsimring AM, Enemark JH. Pulsed ELDOR spectroscopy of the Mo(V)/Fe(III) state of sulfite oxidase prepared by one–electron reduction with Ti(III) citrate. J Biol Inorg Chem. 2002;7:338–350. doi: 10.1007/s00775-001-0303-5. [DOI] [PubMed] [Google Scholar]
- 37.Kappler U, McEwan AG. A system for the heterologous expression of complex redox proteins in Rhodobacter capsulatus: characterization of recombinant sulphite:cytochrome c oxidoreductase from Starkeya novella. FEBS Lett. 2002;529:208–214. doi: 10.1016/s0014-5793(02)03344-6. [DOI] [PubMed] [Google Scholar]
- 38.Temple CA, Graf TN, Rajagopalan KV. Optimization of expression of human sulfite oxidase and its molybdenum domain. Arch Biochem Biophys. 2000;383:281–287. doi: 10.1006/abbi.2000.2089. [DOI] [PubMed] [Google Scholar]
- 39.Raitsimring AM, Pacheco A, Enemark JH. ESEEM investigation of the high and low pH forms of chicken liver Sulfite Oxidase. J Am Chem Soc. 1998;120:11263–11273. [Google Scholar]
- 40.Borbat P, Raitsimring A. A new pulse EPR spectrometer at the University of Arizona. Abstracts of 36th Rocky Mountain Conference on Analytical Chemistry; July 31–Aug 5, 1994; Denver, CO. 1994. p. 94. [Google Scholar]
- 41.Astashkin AV, Raitsimring A, Walker FA. Two- and four-pulse ESEEM studies of the heme binding center of a low spin ferriheme proteine: the importance of a multi-frequency approach. Chem Phys Lett. 1999;306:9–17. [Google Scholar]
- 42.Astashkin AV, Raitsimring A, Enemark JH. 26.5–40 GHz Ka-band pulsed EPR spectrometer. Conc Magn Reson B (Magn Reson Engineering) 2006;29B:125–136. [Google Scholar]
- 43.Raitsimring A, Kappler U, Feng C, Astashkin AV, Enemark JH. Pulsed EPR studies of a bacterial sulfite-oxidizing enzyme with pH-invariant hyperfine interactions from exchangeable protons. Inorg Chem. 2005;44:7283–7285. doi: 10.1021/ic0509534. [DOI] [PubMed] [Google Scholar]
- 44.Astashkin A, Mader ML, Pacheco A, Enemark JH, Raitsimring A. Direct detection of the proton-containing group coordinated to Mo(V) in high-pH form of chicken liver sulfite oxidase. J Am Chem Soc. 2000;122:5294–5302. [Google Scholar]
- 45.Astashkin AV, Raitsimring AM, Feng C, Johnson JL, Rajagopalan KV, Enemark JH. The Mo—OH proton of the low-pH form of sulfite oxidase: comparison of the hyperfine interactions obtained from pulsed ENDOR, CW-EPR and ESEEM measurements. Appl Magn Reson. 2002;22:421–430. [Google Scholar]
- 45a.Wilson GL, Greenwood RJ, Pilbrow JR, Spence JT, Wedd AG. Molybdenum(V) sites in xanthine oxidase and relevant analog complexes: comparison of molybdenum–95 and sulfur-33 hyperfine coupling. J Am Chem Soc. 1991;113:6803–6812. [Google Scholar]
- 46.Pacheco A, Basu P, Borbat P, Raitsimring AM, Enemark JH. Multi-frequency ESEEM spectroscopy of sulfite oxidase in phosphate buffer: direct evidence for coordinated phosphate. Inorg Chem. 1996;35:7001–7006. doi: 10.1021/ic9607806. [DOI] [PubMed] [Google Scholar]
- 47. Dikanov SA, Liboiron BD, Thompson KH, Violet EV, Yuen G, McNeill JH, Orvig C. In vivo electron spin-echo envelope modulation (ESEEM) spectroscopy: first observation of vanadyl coordination to phosphate in bone. J Am Chem Soc. 1999;121:11004–11005. [see comment as ref. [20] therein: Variation of the hf couplings for three P atoms can be attributed to different O–V–O(–P) angles. The isotropic constant is proportional to the unpaired 3s spin density and the coefficient 13306 MHz computed for a unit 3s electron. The anisotropic coupling results from dipole–dipole interaction (mainly from the V–P distance), and indirect spin transfer on a 3p orbital of P. A V–P distance of 3.44 Å for a V–O–P fragment in ADP complexes corresponds to T = 0.79 MHz for point dipoles; computed T for a unit 3p electron is 367 MHz. Thus, the isotropic coupling should be far more sensitive to structural variations than the anisotropic coupling.]
- 48.Buy C, Matsui T, Andrianambininstoa S, Sigalat C, Girault G, Zimmerman J-L. Binding sites for Mg(II) in H+-ATPase from Bacillus PS3 and in the subcomplex studied by one-dimensional ESEEM and two-dimensional HYSCORE spectroscopy of oxovanadium(IV) complexes: a possible role for -His-324. Biochemistry. 1996;35:14281–14293. doi: 10.1021/bi961811b. [DOI] [PubMed] [Google Scholar]
- 49.Mustafi D, Telser J, Makinen MW. Molecular geometry of vanadyl–adenine nucleotide complexes determined by EPR, ENDOR, and molecular modeling. J Am Chem Soc. 1992;114:6219–6226. [Google Scholar]
- 50.Astashkin AV, Raitsimring AM, Feng C, Johnson JL, Rajagopalan KV, Enemark JH. Pulsed EPR studies of nonexchangeable protons near the Mo(V) center of sulfite oxidase: direct detection of the α-proton of the coordinated cysteinyl residue and structural implications for the active site. J Am Chem Soc. 2002;124:6109–6118. doi: 10.1021/ja0115417. [DOI] [PubMed] [Google Scholar]
- 51.Greenwood RJ, Wilson GL, Pilbrow JR, Wedd AG. Molybdenum(V) sites in xanthine oxidase and relevant analog complexes: comparison of oxygen-17 hyperfine coupling. J Am Chem Soc. 1993;115:5385–5392. [Google Scholar]
- 52.Hanson GR, Wilson GL, Bailey TD, Pilbrow JR, Wedd AG. Multifrequency electron spin resonance of molybdenum(V) and tungsten(V) compounds. J Am Chem Soc. 1987;109:2609–2626. [Google Scholar]
- 53.Hanson GR, Brunette AA, McDonell AC, Murray KS, Wedd AG. Electronic properties of thiolate compounds of oxomolybdenum(V) and their tungsten and selenium analogs: effects of oxygen-17, molybdenum-98, and molybdenum-95 isotope substitution upon ESR spectra. J Am Chem Soc. 1981;103:1953–1959. [Google Scholar]
- 54.Boyd IW, Dance IG, Murray KS, Wedd AG. Mononuclear oxo-thiolato compounds of molybdenum(V) Aust J Chem. 1978;31:279–284. [Google Scholar]
- 55.Goldfarb D. New W-band spectrometer which is scheduled to be completed in 2007 will be able generate a 15 ns π-pulse providing >30 MHz of B1. private communication.
- 56.Astashkin AV, Feng C, Raitsimring AM, Enemark JH. 17O ESEEM evidence for exchange of the axial oxo ligand in the molybdenum center of the high pH form of sulfite oxidase. J Am Chem Soc. 2005;127:502–503. doi: 10.1021/ja0461466. [DOI] [PubMed] [Google Scholar]
- 57.Astashkin AV, Neese F, Raitsimring AM, Cooney JJA, Bultman E, Enemark JH. Pulsed EPR investigations of systems modeling molybdenum enzymes: hyperfine and quadrupole parameters of Oxo–17O in [Mo17O(SPh)4]−. J Am Chem Soc. 2005;127:16713–16723. doi: 10.1021/ja055472y. [DOI] [PubMed] [Google Scholar]
- 58.Dance IG, Wedd AG, Boyd IW. The formation and molecular structure of the di-μ-oxo-di[di(benzenethiolato)oxomolybdate(V)] dianion. Aust J Chem. 1978;31:519–526. [Google Scholar]
- 59.Bradbury JR, Mackay MF, Wedd AG. The crystal and molecular structure of tetraphenylarsonium tetrakis(benzenethiolato)oxomolybdate(V) Aust J Chem. 1978;31:2423–2430. [Google Scholar]
- 60.Boyd W, Dance IG, Landers AE, Wedd AG. Triply bridged binuclear thiolate complexes of oxomolybdenum(V): synthesis of [Mo2O2(SR)6Z]− (Z = OR', SR', NR'2) and crystal structures of (Et4N)[Mo2O2(SCH2CH2O)2Cl3, (Et4N) [Mo2O2(SCH2CH2O)3Cl] and (Pr3NH)[Mo2O2(SCH2CH2O)3(SCH2CH2OH)] Inorg Chem. 1979;18:1875–1885. [Google Scholar]
- 61.Cleland WE, Jr, Barnhart KM, Yamanouchi K, Collison D, Mabbs FE, Ortega RB, Enemark JH. Syntheses, structures, and spectroscopic properties of six-coordinate mononuclear oxo-molybdenum(V) complexes stabilized by the hydrotris(3,5-dimethyl-1-pyrazolyl)borate ligand. Inorg Chem. 1987;26:1017–1025. [Google Scholar]
- 62.Kappler U, Bailey S, Feng C, Honeychurch M, Hanson GR, Bernhardt PV, Tollin G, Enemark JH. Kinetic and structural evidence for the importance of Tyr236 for the integrity of the Mo-active site in a bacterial sulfite dehydrogenase. Biochemistry. 2006;45:9696–9705. doi: 10.1021/bi060058b. [DOI] [PubMed] [Google Scholar]
- 63.Cohen HJ, Fridovich I, Rajagopalan KV. Hepatic sulfite oxidase: a functional role for molybdenum. J Biol Chem. 1971;246(2):374–382. [PubMed] [Google Scholar]
- 64.Enemark JH, Astashkin AV, Raitsimring AM. Investigation of the coordination structures of the molybdenum(V) sites of sulfite oxidizing enzymes by pulsed EPR spectroscopy. Dalton Trans. 2006;29:3501–3514. doi: 10.1039/b602919a. [DOI] [PubMed] [Google Scholar]
Associated Data
This section collects any data citations, data availability statements, or supplementary materials included in this article.


