Abstract
We studied ten individuals from eight families showing features consistent with the immuno-osseus dysplasia spondyloenchondrodysplasia (SPENCD). Of particular note was the diverse spectrum of autoimmune phenotypes observed in these patients, including systemic lupus erythematosus (SLE), Sjögren's syndrome, haemolytic anemia, thrombocytopenia, hypothyroidism, inflammatory myositis, Raynaud's disease, and vitiligo. Haplotype data indicated the disease gene to be on chromosome 19p13 and linkage analysis yielded a combined multipoint lod score of 3.6. Sequencing of the ACP5 gene, encoding tartrate resistant acid phosphatase (TRAP), identified biallelic mutations in each of the patients studied, and in vivo testing confirmed a loss of expressed protein. All eight patients assayed demonstrated elevated serum interferon alpha activity, and gene expression profiling in whole blood defined a type I interferon signature. Our findings reveal a previously unrecognised link between TRAP activity and interferon metabolism, and highlight the importance of type I interferon in the genesis of autoimmunity.
We initially ascertained three patients demonstrating a wide range of autoimmunity in association with intracranial calcification and spasticity. We considered the immuno-osseous dysplasia spondyloenchondrodysplasia (MIM 271550) as a differential diagnosis in these cases. Although regarded primarily as a skeletal dysplasia1, SPENCD patients have been reported to show immune dysfunction and neurological involvement2,3. Radiological investigations in our patients revealed the characteristic metaphyseal and vertebral bone lesions described in SPENCD. We therefore sought to determine the genetic basis of this phenotype.
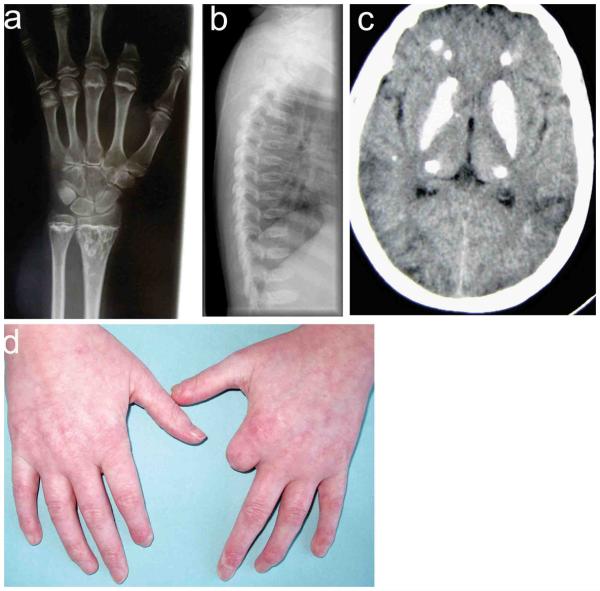
The demographic characteristics and clinical features of a total of ten patients with SPENCD are summarised in Table 1, Fig. 1, and Supplementary Table 1. Four patients fulfilled American College of Rheumatology classification criteria for a diagnosis of SLE4. These included elevated anti-nuclear antibodies, anti-dsDNA antibodies, thrombocytopenia, and nephritis or non-erosive arthritis. Additionally, patient 1 demonstrated overlapping features of systemic sclerosis, Sjögren's syndrome and an inflammatory myositis. Three further patients exhibited significantly elevated anti-dsDNA and anti-nuclear antibody titers. Possibly related to immune activation, four of six patients assessed showed intracranial calcification, a recognized feature of neuro-lupus5.
Table 1.
Demographic, molecular and immunological characteristics of SPENCD patients.
| Sex | Country of origin |
Consanguinity | Relationship to other patients |
Nucleotide / amino acid alteration |
Antinuclear antibodies (titer) |
Anti-dsDNA antibodies (titer) |
Thrombocytopenia | Autoimmune haemolytic anemia |
Lupus nephritis |
ACR* diagnosis of lupus |
Treated hypothyroidism |
Raynaud's / vasculitis |
|
|---|---|---|---|---|---|---|---|---|---|---|---|---|---|
| Patient 1† |
Female | France | No | None | Hom Del 11543542- 11558411 |
Yes (1:1280) | No | No | No | No | No | Yes | Yes |
| Patient 2 |
Female | Austria | No | Sister of 3 | 369C>A/ Y123X Het 721G>A/ D241N Het |
Yes (1:640) | Yes (1:320) | Yes | No | Yes | Yes | Yes | No |
| Patient 3 |
Male | Austria | No | Brother of 2 | 369C>A/ Y123X Het 721G>A/ D241N Het |
No | No | Yes | No | No | No | No | No |
| Patient 4 |
Male | Turkey | Yes | Brother of 5 | 266C>T/ T89I Hom |
Yes (1:640) | Yes (100 IU/ml) |
No | No | No | No | No | Yes |
| Patient 5 |
Female | Turkey | Yes | Sister of 4 | 266C>T/ T89I Hom |
No | No | No | No | No | No | No | Yes |
| Patient 6 |
Male | Pakistan | Yes | None | 667C>T/ Q223X Hom |
Yes (>1:320) | Yes (1:1280) | No | Yes | No | No | No | No |
| Patient 7 |
Male | India | Yes | None | Hom Del 11543690- 11548656 |
Yes†† | Yes†† | Yes | No | Yes | Yes | No | No |
| Patient 8§ |
Female | Portugal | Yes | None | 791 T>A/ M264K Hom |
Yes (1:1280) | Yes (500 IU/ml) |
Yes | No | No | Yes | Yes | No |
| Patient 9 |
Female | Mali | Unknown | None | 643 G>A/ G215R Hom |
Yes (1:1600) | Yes†† 121 (n<100) |
Yes | Yes | Yes | Yes | No | No |
| Patient 10 |
Female | Egypt | Yes | None | Hom Del c.771-790 S258W fsX39 |
Yes (1:640) | Yes†† 33 (n<20) |
No | No | No | No | No | No |
This patient also had a biopsy proven diagnosis of Sjögren's syndrome and an inflammatory myositis.
This patient demonstrated a non-erosive arthropathy involving more than 2 joints.
Strongly positive on immunoblot/ELISA.
ACR: American College of Rheumatology. Hom= Homozygous. Del= Deletion.
Figure 1. Bone, brain and skin involvement in patients with mutations in ACP5.
Enchondromatous lesions are seen in the distal ulna and radius of patient 1, with sclerosis and irregularity of the metaphyseal plate (panel a). Lateral spine radiographs demonstrate platyspondyly and irregularity of the vertebral endplates in patient 4 (panel b). Dense calcification of the basal ganglia, thalami and deep gyri is observed in patient 1 (panel c). The hands of patient 1 illustrate significant sclerotic changes (panel d). Note the loss of tissue from several digits. Severe gangrenous changes led to amputation of the left index finger.
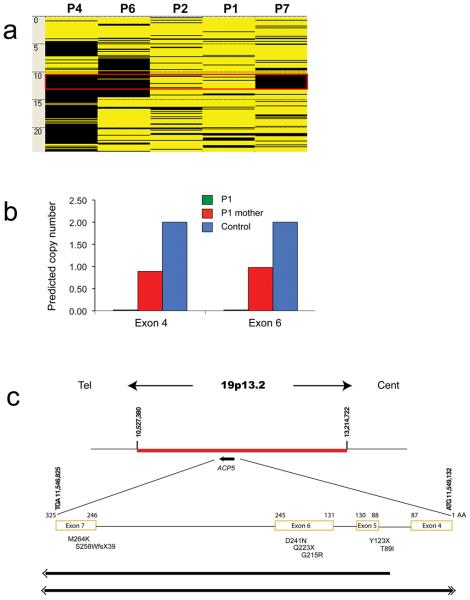
Whole-genome genotyping analysis in three unrelated patients born to consanguineous parents determined an overlapping region of homozygosity on chromosome 19p13 (Fig. 2). Linkage analysis gave a maximum multipoint lod score of 3.6 between base-pair positions 10,527,380-13,214,722. This region contained a total of 95 RefSeq annotated genes. Genotyping of patient 1 demonstrated two contiguous markers, one copy number probe (CN_784690) and one SNP (rs2071484), which failed to hybridize, indicating a possible homozygous deletion within the ACP5 gene. DNA from this patient was refractory to PCR amplification of all exons of ACP5, despite good amplification of non-ACP5 PCR products, and good amplification of DNA from the single available parent and from control DNA. Further evidence of a homozygous deletion in this patient came from quantitative multiplex PCR of short fluorescent fragments (QMPSF) of DNA from the patient and her mother, and reverse transcription PCR analysis (Supplementary Fig. 1). We were not able to define the precise breakpoints of the deletion by PCR. Although the parents of patient 1 were not knowingly consanguineous, genotype data demonstrated a run of 35 homozygous SNPs in a 270kb segment between rs4804628 and rs318699 encompassing ACP5, possibly suggesting distant shared ancestry.
Figure 2. Summary of mutation data.
Panel a shows the AutoSNPa output for Chromosome 19p generated from whole-genome SNP analysis of five unrelated individuals (P denotes patient). A shared region of homozygosity (indicated by the red box) was identified in three patients (4, 6 and 7) born to consanguineous parents, between base-pair positions 10,527,380-13,214,722 (black and yellow bars indicate homozygous and heterozygous SNPs respectively). Within this homozygous region, patient 1 demonstrated a failure of hybridization for a copy number probe and an adjacent SNP probe. QMPSF was performed to confirm the presence of the putative deletion in this patient (panel b). Representative data from an analysis of exons 4 and 6 indicates that no products were seen using DNA from the proband (predicted copy number of 0), consistent with a homozygous ACP5 gene deletion, whilst her mother carries a heterozygous deletion as expected (predicted copy number of 1, compared to predicted copy number of 2 in the control). DNA from the father was unavailable.
A schematic of the disease critical interval on chromosome 19p is shown in panel c. The deleted region included sequence for the gene ACP5, in which single base-pair mutations, a frame shift mutation and two gene deletions were identified. Deletions are indicated by solid lines and double arrows indicate extension beyond the coordinates shown. No other genes were involved in either of these deletions.
Sequencing of the complete coding region of ACP5 revealed mutations in the further nine patients tested (Table 1). All mutations segregated with the disease in the families investigated, and all parents tested were heterozygous for a relevant familial mutation. All missense mutations were in highly conserved residues from a representative sample of eukaryotic species containing TRAP (Supplementary Fig. 2). None of the mutations identified were present on 210 alleles from control samples of mixed ethnicity.
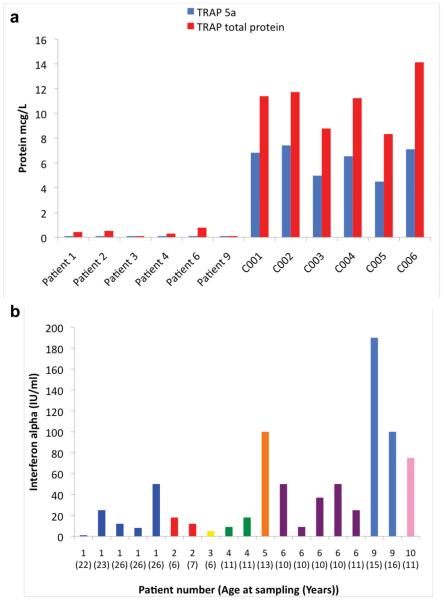
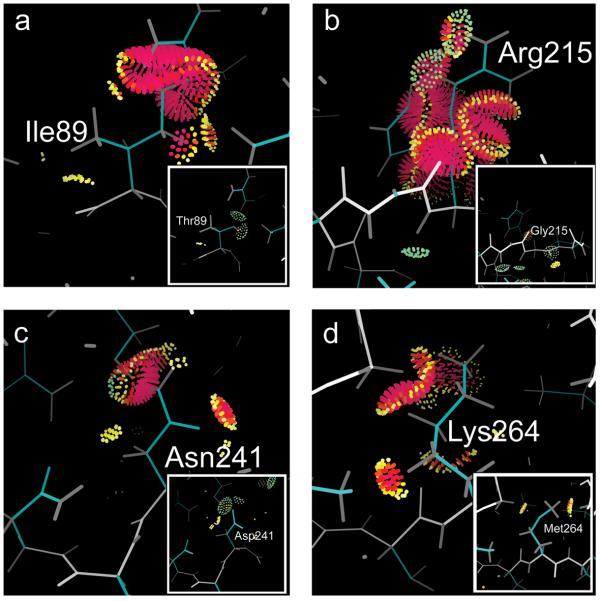
The observation of biallelic null mutations in four of eight families indicated that the SPENCD phenotype results from a loss of TRAP activity. To explore this possibility further, we measured levels of total TRAP protein and its 5a isoform in plasma from six patients. Compared to five age-matched controls, and an unaffected sibling to patients 2 and 3 who was homozygous for the wild-type allele on gene sequencing, levels of total TRAP protein were negligible, and TRAP 5a protein undetectable, indicating an almost complete lack of TRAP synthesis or secretion in the affected patients tested (Fig. 3). It is of note that patients 4 and 9 were homozygous for missense mutations, and that patients 2 and 3 carried a missense alteration on one allele, suggesting that these missense changes also act as null mutations, perhaps through protein misfolding and the induction of protein degradation. This hypothesis is supported by bioinformatic assessment of the protein structure, in which all four missense changes are predicted to result in significant protein destabilisation (Fig. 4).
Figure 3. Levels of TRAP protein and interferon alpha activity in patients with mutations in ACP5.
We used monoclonal antibodies to measure levels of total TRAP protein and TRAP isoform 5a in plasma from six patients with ACP5 mutations, and compared them with levels in age and sex-matched control samples (panel a). We also tested an unaffected sibling to patients 2 and 3 who was homozygous for the wild-type allele on gene sequencing (designated control 001). All six patients demonstrated only background levels of total protein and an absence of 5a protein.
Serum samples were obtained from eight patients with mutations in ACP5, and interferon alpha levels measured using a biological assay of antiviral activity (panel b). Five patients were assayed serially, at greater than one month intervals between assay points. On only one occasion was the level of interferon alpha within the normal range (< 2 IU/ml) in any of the patients sampled.
Figure 4. Computational analysis of missense mutations in the context of protein structure.
Each of the four missense mutations was modelled in the context of the crystal structure22. Interactions between the mutated side chains and the rest of the protein are indicated; pink and yellow spikes indicate destabilising van der Waals overlaps, green lenses represent stablising hydrogen bonds. Van der Waals contacts are omitted for clarity. The least destabilising side chain conformation (“rotamer”) is shown in each case. Insets illustrate the wild type residues and their interactions with the rest of the protein shown from the same viewpoint. Panel a illustrates the mutation of Ile 89 to Thr; panel b the mutation of Gly 215 to Arg; panel c the mutation of Asp 241 to Asn and panel d the mutation of Met 264 to Lys. For each mutation, van der Waals overlaps are large enough that they are likely to substantially destabilise the structure. In addition, for panel c there is loss of a hydrogen bond that is stabilising in the wild type, and for panel d the charged NH3 group of the lysine is buried from solvent and not able to make a neutralising charge-charge interaction, further destablising the mutant structure.
Although ACP5 null mice demonstrate a skeletal dysplasia highly reminiscent of the human disease SPENCD6, they do not develop an overt autoimmune phenotype. However, these mice do show disordered macrophage pro-inflammatory cytokine production7. Considering both the importance of the cytokine interferon alpha in the pathogenesis of the prototypic autoimmune disorder SLE8, and the clinical overlap with the Mendelian interferon-opathy Aicardi-Goutières syndrome3,9, we sought to assess type I interferon activation in patients affected with SPENCD. Remarkably, type I interferon activity was elevated in serum from all eight patients sampled (Fig. 3), with a persistent elevation demonstrated in five patients where two or more measurements were recorded. This activity was completely abolished with anti-sera against interferon alpha, but not with anti-sera against interferon beta (Supplementary Table 2).
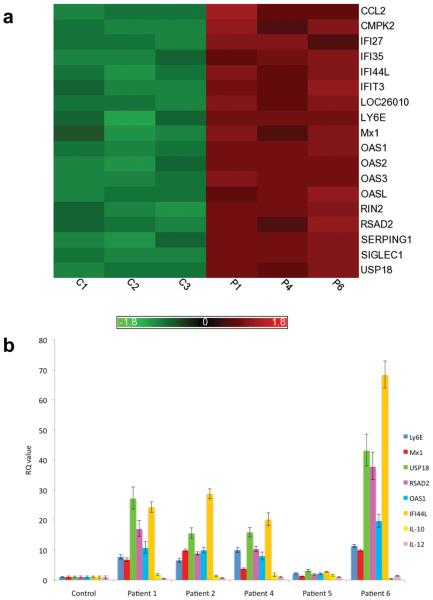
SLE patients frequently demonstrate an increased expression of type I interferon stimulated genes, a so-called interferon signature10. To determine if a similar signature was present in SPENCD patients, we undertook whole-genome microarray analysis in three affected individuals. This analysis identified 18 genes which were greater than four-fold over-expressed in patient whole blood compared to age-matched controls (Fig. 5a, Supplementary Fig. 3 and Supplementary Table 3), 15 of which are recognized as interferon stimulated genes. These data were confirmed by qPCR analysis in five patients. We did not find evidence of a circulating inducer of interferon activity in patient sera (Supplementary Table 4), possibly suggesting an up-regulation of type I interferon via a cell-intrinsic mechanism.
Figure 5. Gene expression analysis in patients with TRAP deficiency.
Whole transcriptome microarray expression analysis was undertaken in three patients, and compared to the data derived from three age-matched control samples (panel a). We identified a subset of 18 genes that were four or more fold up-regulated in patients, with a significance level for the comparisons of p<0.0005 and a false discovery value of <0.2 (Supplementary Fig. 3). Fifteen of these genes are known to be interferon stimulated, characteristic of a type I interferon signature. The intensity plot was generated from the gene expression values (log 2) that had been standardized (for each gene the mean set to zero, standard deviation to 1) using Partek Genomics Solution (version 6.5, Copyright 2010, Partek Inc., St. Charles, MO, USA). Panel b shows qPCR data for a representative sample of these up-regulated genes Ly6E, Mx1, USP18, RSAD2, OAS1, IFI44L, IL-10 and IL-12. All genes assessed in the patient group were significantly up-regulated (p<0.001) compared to controls, except for IL-10 and IL-12, confirming the type 1 interferon signature seen on microarray analysis and showing an absence of up- or down-regulation of IL-10 and IL-12. RQ is equal to 2−ΔΔCt with ΔΔCt +/− SDs. i.e. the normalized fold change relative to a calibrator.
The above data demonstrate that loss of TRAP protein results in a dramatic up-regulation of interferon alpha and type I interferon stimulated genes in patients affected with SPENCD. In marked contrast, we found normal levels of interferon gamma protein (Supplementary Table 5), and IL-10 and IL-12 RNA in patient whole blood (Fig. 5b). Moreover, we saw normal numbers of T and B cells, including T regulatory cell subsets, in two patients, 4 and 6 (data not shown), suggesting that the autoimmune predisposition in TRAP deficiency is not related to a quantitative defect of regulatory T cells. These data indicate a primary role for TRAP in innate immunity, a contention further supported by the observation that TRAP is induced by lipopolysaccharide11 and by nucleic acid ligands in a sequence non-specific and non-TLR9 dependent manner12.
Osteopontin, encoded by the OPN gene, is a recognized substrate for osteoclast-derived TRAP in vivo13. Interestingly, polymorphisms in OPN and serum osteopontin levels show an association with interferon alpha levels in lupus patients14, possibly through an involvement of osteopontin in the regulation of interferon alpha production by plasmacytoid dendritic cells (pDCs)15, a major source of type I interferon. For these reasons, we assayed total osteopontin in patient serum, but did not see a statistically significant difference between patients and controls (Supplementary Fig. 4). Furthermore, although we observed fold-levels of ACP5 expression in pDCs equivalent to peripheral blood mononuclear cells, much higher levels were seen in macrophages and non-plasmacytoid dendritic cells (Supplementary Table 6). Of note, ACP5 mRNA expression by human pDCs (Supplementary Table 7), as well as mouse macrophage and mouse dendritic cells (data not shown), was not increased following interferon alpha stimulation, perhaps indicating that TRAP does not act in a simple feedback regulatory loop within these cells. However, the possibility remains that loss of TRAP activity causes an increase in phosphorylated intracellular osteopontin16 in pDCs or other relevant cell types, leading to an increase in circulating interferon alpha through an as yet undefined pathway.
SPENCD patients demonstrate a truly remarkable spectrum of autoimmunity. In relation to SLE, together with deficiency of early components of the classical complement pathway17 and mutations in TREX118, TRAP deficiency now represents a third monogenic disorder associated with the development of lupus also showing an up-regulation of type I interferon activity19,20,21. Our findings reveal a previously unrecognised link between TRAP activity and interferon metabolism, and further emphasise the importance of the type I interferon response in autoimmunity.
Methods
Genetic analyses
Genome-wide scans were performed in three unrelated patients (4, 6 and 7) born to consanguineous parents, and two unrelated affected individuals (patients 1 and 2) of non-consanguineous parents. Genotypes were generated using the Affymetrix GeneChip® single nucleotide polymorphism (SNP) Human Mapping 6.0 array. Datasets were collated and standardized to a single recent genome build (NCBI36/hg18) using the SNPsetter program (http://dna.leeds.ac.uk/snpsetter/), and the combined data were analyzed using AutoSNPa (http://dna.leeds.ac.uk/autosnpa/). Subsequently, siblings to patients 2 (patient 3) and 4 (patient 5), and a further 3 unrelated children (patients 8, 9 and 10), 2 born to consanguineous parents (paitents 8 and 10), were ascertained and DNA collected.
Linkage analysis was performed assuming autosomal recessive inheritance with a disease allele frequency of 0.001, complete penetrance, and an equal frequency for marker alleles. Lod scores were calculated using the Merlin linkage package (http:www.sph.umich.edu/csg/abecasis/Merlin).
Mutation screening of ACP5, encoding the enzyme tartrate resistant acid phosphatase (TRAP), was performed by polymerase chain reaction (PCR) amplification of genomic DNA segments and direct sequencing of the products using BigDye terminator chemistry and a 3130 DNA sequencer (Applied Biosystems). Mutation description is based on the reference complementary DNA (cDNA) sequence NM_001111035, with the ATG initiation site situated at the beginning of exon 4 and the termination codon in exon 7.
In order to confirm the genomic deletion of ACP5 in patient 1, we used a method of quantitative multiplex PCR of short fluorescent fragments (QMPSF) in which multiple short genomic sequences are amplified simultaneously with dye-labelled primers under quantitative conditions23.
Protein assays
TRAP isoform 5a protein levels in plasma were measured using a monoclonal antibody (mab220) raised against a unique epitope associated with the uncleaved loop peptide, which specifically captures serum TRAP 5a without cross-reaction to other acid phosphatases24. TRAP 5a protein bound by immobilized mab220 was detected with a second anti-TRAP monoclonal antibody (mab162) conjugated to horseradish peroxidase using a validated assay25. Total TRAP protein levels were assayed with a unique monoclonal antibody, mab14G6, to immobilize both isoforms 5a and 5b, which was then detected with the same peroxidase conjugate used for the 5a protein assay.
Interferon assays
Type I interferon activity was measured by determining the cytopathic reduction of Madin-Darby bovine kidney (MDBK) cells infected with vesicular stomatitis virus26. A reference of human interferon alpha, standardized against the National Institutes of Heath reference Ga 023-902-530, was included with each titration. Titers were expressed as International Units (IU) per millilitre (ml). Interferon alpha activity in normal serum is <2 IU/ml27,28.
Gene expression analysis
Total RNA was extracted from whole blood using PAXgene (PreAnalytix) or Tempus Spin (Applied Biosystems) RNA isolation kits. RNA concentration and integrity was assessed using a 2100 Bioanalyzer (Agilent Technologies).
Whole transcriptome microarray expression analysis was performed in patients 1, 4, and 6 plus three age-matched controls. Amplified sense-strand cDNA generated from 100ng of total RNA was fragmented, labeled and hybridized to the Affymetrix Genechip Human Exon 1.0 ST ArrayR, and data analysed using Genomics Solution software (Partek Inc., St. Charles, MO, USA). Differential expression between patients and controls was assessed using t-test/ANOVA analysis. A q-value score was generated as a correction factor for false discovery29. Microarray data has been submitted in a MIAME compliant standard to the Array Express database (Experiment E-MEXP-2699; http://www.ebi.ac.uk/arrayexpress).
Quantitative PCR (qPCR) analysis was performed using the TaqMan Universal PCR Master Mix (Applied Biosystems), and cDNA derived from 40ng total RNA. The relative abundance of target transcripts, measured using TaqMan probes for Ly6E (Hs00158942_m1), Mx1 (Hs00895598_m1), USP18 (Hs00276441_m1), RSAD2 (Hs01057264_m1), OAS1 (Hs00973637_m1), IFI44L (Hs00199115_m1), IL-10 (Hs99999035_m1) and IL-12 (Hs01073447_m1) was normalised to the expression level of HPRT1 (Hs03929096_g1) and 18s (Hs999999001_s1) and assessed with the Applied Biosystems StepOne Software v2.1. Statistical significance between groups was determined by t-tests using DataAssist v2.0 (Applied Biosystems). Patient data is expressed relative to the average of 4 age-matched normal controls.
Structural analysis
Structural analysis was based on the crystal structure of human purple acid phosphatase (PDB code 2bq8)22. Hydrogen atoms were added using “Reduce”30, and interactions between residues of interest calculated with “Probe”31. To model missense mutations, the KiNG software32 was used to computationally substitute mutated residues. For each residue all low-energy side chain conformations (“rotamers”)33 were tested, and the interactions between the modelled mutation and the rest of the protein calculated with Probe. The conformation displayed in Fig. 4 is that with fewest van der Waals overlaps, i.e. the ‘best’ side chain conformation.
Supplementary Material
Acknowledgements
We would like to thank the families for their cooperation in the research presented here; Dr Belen Eguia, AP-HP, Department of Dermatology and Allergy, Hôpital Tenon, Paris, France for providing medical images; Mr Bob Smith for technical support; and Professor David Bonthron for insightful comments on the manuscript. We wish to acknowledge Leanne Wardleworth and Andy Hayes from the Microarray Facility, Faculty of Life Sciences, University of Manchester. T.A.B. is supported as a Wellcome Trust Clinical Fellow. Y.J.C., J.U. and S.D. acknowledge the Manchester NIHR Biomedical Research Centre. The research leading to these results has received funding from the European Union's Seventh Framework Programme (FP7/2007-2013) under grant agreement number 241779.
Footnotes
Accession numbers
ACP5 Ensembl transcript ID: ENSG00000102575; protein ID: ENSP00000218758. The microarray data is publicly available from ArrayExpress accession E-MEXP-2699.
References
- 1.Schorr S, Legum C, Ochshorn M. SPONDYLOENCHONDRODYSPLASIA - enchondromatosis with severe platyspondyly in 2 brothers. Radiology. 1976;118:133–9. doi: 10.1148/118.1.133. [DOI] [PubMed] [Google Scholar]
- 2.Renella R, et al. SPONDYLOENCHONDRODYSPLASIA with spasticity, cerebral calcifications, and immune dysregulation: Clinical and radiographic delineation of a pleiotropic disorder. Am. J. Med. Genet. A. 2006;140A:541–50. doi: 10.1002/ajmg.a.31081. [DOI] [PubMed] [Google Scholar]
- 3.Navarro V, et al. TWO further cases of spondyloenchondrodysplasia (SPENCD) with immune dysregulation. Am. J. Med. Genet. A. 2008;146A:2810–5. doi: 10.1002/ajmg.a.32518. [DOI] [PubMed] [Google Scholar]
- 4.Tan EM, et al. THE 1982 revised criteria for the classification of Systemic Lupus Erythematosus. Arthritis Rheum. 1982;25:1271–77. doi: 10.1002/art.1780251101. [DOI] [PubMed] [Google Scholar]
- 5.Raymond AA, Zariah AA, Samad SA, Chin CN, Kong NC. BRAIN calcification in patients with cerebral lupus. Lupus. 1996;5:123–8. doi: 10.1177/096120339600500207. [DOI] [PubMed] [Google Scholar]
- 6.Hayman AR, et al. MICE lacking tartrate-resistant acid phosphatase (Acp 5) have disrupted endochondral ossification and mild osteopetrosis. Development. 1996;122:3151–62. doi: 10.1242/dev.122.10.3151. [DOI] [PubMed] [Google Scholar]
- 7.Bune AJ, Hayman AR, Evans MJ, Cox TM. MICE lacking tartrate-resistant acid phosphatase (Acp 5) have disordered macrophage inflammatory responses and reduced clearance of the pathogen, Staphylococcus aureus. Immunology. 2001;102:103–13. doi: 10.1046/j.1365-2567.2001.01145.x. [DOI] [PMC free article] [PubMed] [Google Scholar]
- 8.Crow MK. TYPE I interferon in systemic lupus erythematosus. Curr. Top. Microbiol. Immunol. 2007;316:359–86. doi: 10.1007/978-3-540-71329-6_17. [DOI] [PubMed] [Google Scholar]
- 9.Crow YJ, Livingston JH. AICARDI-GOUTIERES syndrome: an important Mendelian mimic of congenital infection. Dev. Med. Child Neurol. 2008;50:410–416. doi: 10.1111/j.1469-8749.2008.02062.x. [DOI] [PubMed] [Google Scholar]
- 10.Baechler EC, et al. INTERFERON-INDUCIBLE gene expression signature in peripheral blood cells of patients with severe lupus. Proc. Natl. Acad. Sci. U.S.A. 2003;100:2610–5. doi: 10.1073/pnas.0337679100. [DOI] [PMC free article] [PubMed] [Google Scholar]
- 11.Hayman AR, Macary P, Lehner PJ, Cox TM. TARTRATE-RESISTANT acid phosphatase (Acp 5): identification in diverse human tissues and dendritic cells. J Histochem. Cytochem. 2001;49:675–84. doi: 10.1177/002215540104900601. [DOI] [PubMed] [Google Scholar]
- 12.Muhonen P, et al. SEQUENCE and TLR9 independent increase of TRACP expression by antisense DNA and siRNA molecules. Biochem. Biophys. Res. Commun. 2007;359:889–95. doi: 10.1016/j.bbrc.2007.05.205. [DOI] [PubMed] [Google Scholar]
- 13.Suter A, et al. OVERLAPPING functions of lysosomal acid phosphatase (LAP) and tartrate-resistant acid phosphatase (Acp5) revealed by doubly deficient mice. Development. 2001;128:4899–910. doi: 10.1242/dev.128.23.4899. [DOI] [PubMed] [Google Scholar]
- 14.Kariuki SN, et al. AGE- and gender-specific modulation of serum osteopontin and interferon-alpha by osteopontin genotype in systemic lupus erythematosus. Genes Immun. 2009;10:487–94. doi: 10.1038/gene.2009.15. [DOI] [PMC free article] [PubMed] [Google Scholar]
- 15.Shinohara ML, et al. OSTEOPONTIN expression is essential for interferon-alpha production by plasmacytoid dendritic cells. Nat. Immunol. 2006;7:498–506. doi: 10.1038/ni1327. [DOI] [PMC free article] [PubMed] [Google Scholar]
- 16.Weber GF, et al. PHOSPHORYLATION-DEPENDENT interaction of osteopontin with its receptors regulates macrophage migration and activation. J. Leuk. Biol. 2002;72:752–61. [PubMed] [Google Scholar]
- 17.Botto M, et al. COMPLEMENT in human diseases: Lessons from complement deficiencies. Mol. Immunol. 2009;46:2774–83. doi: 10.1016/j.molimm.2009.04.029. [DOI] [PubMed] [Google Scholar]
- 18.Lee-Kirsch MA, et al. MUTATIONS in the gene encoding the 3′-5′ DNA exonuclease TREX1 are associated with systemic lupus erythematosus. Nat. Genet. 2007;39:1065–7. doi: 10.1038/ng2091. [DOI] [PubMed] [Google Scholar]
- 19.Stetson DB, Ko JS, Heidmann T, Medzhitov R. TREX1 prevents cell-intrinsic initiation of autoimmunity. Cell. 2008;134:587–98. doi: 10.1016/j.cell.2008.06.032. [DOI] [PMC free article] [PubMed] [Google Scholar]
- 20.Lood C, et al. C1Q inhibits immune complex-induced interferon-alpha production in plasmacytoid dendritic cells: a novel link between C1q deficiency and systemic lupus erythematosus pathogenesis. Arthritis Rheum. 2009;60:3081–90. doi: 10.1002/art.24852. [DOI] [PubMed] [Google Scholar]
- 21.Santer DM, Hall BE, George TC, Tangsombatvisit S, Liu CL, Arkwright PD, Elkon KB. C1Q deficiency leads to the defective suppression of IFN-α in response to nucleoprotein containing immune complexes. J Immunol. 2010;185:4738–4749. doi: 10.4049/jimmunol.1001731. [DOI] [PMC free article] [PubMed] [Google Scholar]
- 22.Sträter N, et al. CRYSTAL structures of recombinant human purple Acid phosphatase with and without an inhibitory conformation of the repression loop. J. Mol. Biol. 2005;351:233–46. doi: 10.1016/j.jmb.2005.04.014. [DOI] [PubMed] [Google Scholar]
- 23.Campos-Xavier AB, et al. MUTATIONS in the Heparan-sulfate Proteoglycan Glypican 6 (GPC6) Impair Endochondral Ossification and Cause Recessive Omodysplasia. Am. J. Hum. Genet. 2009;84:760–70. doi: 10.1016/j.ajhg.2009.05.002. [DOI] [PMC free article] [PubMed] [Google Scholar]
- 24.Chao TY, et al. DEVELOPMENT of immunoassays for serum tartrate-resistant acid phosphatase isofrom 5a. Clin. Chim. Acta. 2005;359:132–40. doi: 10.1016/j.cccn.2005.03.039. [DOI] [PubMed] [Google Scholar]
- 25.Janckila AJ, Neustadt DH, Yam LT. SIGNIFICANCE of serum TRAP in rheumatoid arthritis. J. Bone Miner. Res. 2008;23:1287–95. doi: 10.1359/jbmr.080329. [DOI] [PubMed] [Google Scholar]
- 26.Ankel H, Westra DF, Welling-Wester S, Lebon P. INDUCTION of interferon-alpha by glycoprotein D of herpes simplex virus: A possible role of chemokine receptors. Virology. 1998;251:317–26. doi: 10.1006/viro.1998.9432. [DOI] [PubMed] [Google Scholar]
- 27.Jabs WJ, Henning C, Zawatzky R, Kirchner H. FAILURE to detect antiviral activity in serum and plasma of healthy individuals displaying high activity in ELISA for IFN-alpha and IFN-beta. J. Interferon Cytokine Res. 1999;19:463–9. doi: 10.1089/107999099313901. [DOI] [PubMed] [Google Scholar]
- 28.Dubos F, et al. INTERFERON alpha production in the serum of very young infants after viral infections. Med. Mal. Infect. 2004;34:561–5. doi: 10.1016/j.medmal.2004.09.004. [DOI] [PubMed] [Google Scholar]
- 29.Storey JD, Tibshirani R. STATISTICAL significance for genomewide studies. PNAS. 2003;100:9440–5. doi: 10.1073/pnas.1530509100. [DOI] [PMC free article] [PubMed] [Google Scholar]
- 30.Word JM, Lovell SC, Richardson JS, Richardson DC. ASPARAGINE and glutamine: using hydrogen atom contacts in the choice of side-chain amide orientation. J. Mol. Biol. 1999;285:1735–47. doi: 10.1006/jmbi.1998.2401. [DOI] [PubMed] [Google Scholar]
- 31.Word JM, et al. VISUALIZING and quantifying molecular goodness-of-fit: small-probe contact dots with explicit hydrogen atoms. J. Mol. Biol. 1999;285:1711–33. doi: 10.1006/jmbi.1998.2400. [DOI] [PubMed] [Google Scholar]
- 32.Chen VB, Davis IW, Richardson DC. KING (Kinemage, Next Generation): a versatile interactive molecular and scientific visualization program. Protein Sci. 2009;18:2403–9. doi: 10.1002/pro.250. [DOI] [PMC free article] [PubMed] [Google Scholar]
- 33.Lovell SC, Word JM, Richardson JS, Richardson DC. THE penultimate rotamer library. Proteins. 2000;40:389–408. [PubMed] [Google Scholar]
Associated Data
This section collects any data citations, data availability statements, or supplementary materials included in this article.


