Abstract
Motivation: Next-generation sequencing technologies enable the identification of sequence variation in the genome and transcriptome. Differences between the reference genome and transcript libraries complicate the determination of the effect of genomic sequence variants on protein products; similarly, these differences complicate the mapping of sequence variants found in transcripts to their respective genomic position. We have developed MU2A, a publicly available web service for variant annotation that reconciles differences between the genome and transcriptome, enabling the rapid and accurate determination of the effects of genomic variants on protein products, and the mapping of variants detected in transcripts to genomic coordinates. The MU2A web service is available at http://krauthammerlab.med.yale.edu/mu2a. We have released MU2A as open source, available at http://code.google.com/p/mu2a/.
Contact: michael.krauthammer@yale.edu
Supplementary information: Supplementary data are available at Bioinformatics online.
1 INTRODUCTION
Next-generation sequencing (NGS) technologies enable researchers to identify sequence variants in both germline and disease tissue DNA. In DNA-Seq experiments, genomic DNA is sequenced, and aligned to a reference genome. Variants are detected by identifying the reads with alternative bases compared with the reference. In RNA-Seq, which is primarily intended to identify differential gene expression, cDNA is sequenced and aligned to a reference transcript library. Common downstream processing steps for DNA-Seq experiments include the mapping of the variants to their transcript positions to determine effects on protein function. Common downstream processing steps for RNA-Seq experiments include the mapping of transcript variants to genomic coordinates to determine conservation of the corresponding regions. For both steps, it is imperative to consider conflicts between the reference genome and transcript libraries. The consensus sequence for the reference genome is determined from the DNA of only a few individuals, while the RefSeq transcript library represents a consensus across a vast number of mRNA sequences deposited in GenBank. The most obvious difference can be found at known single nucleotide polymorphism (SNP) positions, where the reference genome may show the minor allele, and the transcript library the major allele (and vice versa). Other differences include insertions or deletions (indels), or rare single base variants. We have developed MU2A, a variant assessment tool that accepts either genomic or transcript positions and reconciles the discordance between the reference genome and transcriptome when predicting the effects of sequence variants.
MU2A rapidly and accurately determines the effects of genomic variants on transcripts and proteins; determines the genomic context of variants detected in transcripts; flags variants with genome transcript misalignments; annotates variants that correspond to known SNPs or known cancer mutations; annotates variants with information on genomic conservation, gene function and determines effect on domain integrity.
2 METHODS
MU2A supports the NCBI version 36.1 (hg18) and GRCh37 (hg19) human genome builds, and NCBI RefSeq as the reference transcript library (Pruitt et al., 2007). We currently focus on single nucleotide variants, as they represent the majority of naturally occurring sequence variants. We constructed a base-to-base mapping between the genome and transcriptome using UCSC's RefSeq mapping as a scaffold (Kent et al., 2002). This mapping allows us to accurately determine the effect of genomic variants on transcripts, and to determine the genomic context of variants found in transcripts. The methods described are applicable to other organisms, genome builds and transcript libraries.
2.1 Reconciling the genome and transcriptome
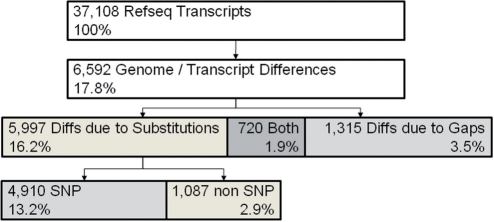
To analyze differences between the genome and transcriptome, we constructed genome-based predicted transcripts by concatenating genomic sequences from GRCh37 according to exon boundaries posted by the UCSC genome browser. We then aligned predicted transcript sequences to RefSeq sequences using the Needleman–Wunsch global alignment algorithm (Needleman and Wunsch, 1970). We found that 17.8% of all RefSeq transcripts differ from the predicted transcript sequence (Fig. 1): 3.5% align with gaps, 16.2% with substitutions and 1.9% with both gaps and substitutions. 13.2% of RefSeq transcripts align to predicted transcripts with substitutions that correspond to known SNPs. The predicted transcripts used here are dependent on the genomic coordinates of the UCSC exon boundaries, and are a result of UCSC's RefSeq to genome mapping procedure. In order to exclude any bias introduced by this mapping procedure, we repeated our calculations with RefSeq transcripts for which both the UCSC mapping as well as an alternative NCBI mapping resulted in exactly the same exon boundaries and predicted transcripts. These ‘consensus’ predicted transcripts exhibited similar discrepancies to the RefSeq sequences as discussed above (refer to Supplementary Material for details). MU2A uses information on predicted transcript to RefSeq misalignments to flag submitted variants that correspond to known single base differences between the genome and transcriptome, or that correspond to base differences due to gaps. For the latter, MU2A attempts to adjust the positional mappings if possible (see Supplementary Material for a specific example).
Fig. 1.
Differences between Refseq and genome.
2.2 Variants at known SNP positions
We found that compared with the transcript library, the reference genome often contains the minor allele of known SNPs. 3634 SNPs are found at positions within the 4910 transcripts where RefSeq and the genome differ (a single SNP may affect multiple transcripts). 1744 of these SNPS have a clear major allele, identical across all populations as determined by dbSNP build 131 (Sherry et al., 2001). For 77% of these SNPs, the RefSeq transcript bears the major allele, whereas for 23%, the genome bears the major allele. MU2A therefore uses RefSeq as the reference sequence for transcribed regions, as it is more likely to bear the major allele. MU2A flags genomic ‘variants’ at SNP positions that result in a transcript identical to RefSeq. MU2A annotates sequence variants for every SNP position and provides allele frequencies, simplifying the identification of sequence variants that represent minor alleles.
2.3 Assessing the functional consequences of sequence variants
One common goal of NGS is to find sequence variants that cause disease. To facilitate this effort, MU2A annotates mutations with the following information: Conservation—conservation score from the 17 or 46-way phylogenetic alignment track of the UCSC genome browser (Kent et al., 2002); Gene Function—includes GO annotations (Ashburner et al., 2000), Panther Pathways (Mi et al., 2007), Cancer Gene Census (Futreal et al., 2004), Pfam Domain (Bateman et al., 2004); Missense mutation effects—includes Catalogue of Somatic Mutations in Cancer (COSMIC) (Bamford et al., 2004), BLOSUM45 (Henikoff and Henikoff, 1992), Panther cSNP analysis (Thomas and Kejariwal, 2004) and LogR.E Score (Clifford et al., 2004).
3 RESULTS
3.1 Annotating somatic mutations of a cancer genome
To demonstrate the utility of MU2A, we processed all single base somatic variants identified in the COLO-829 melanoma cell line (Pleasance et al., 2010). MU2A rapidly annotated all 33 000 variants from this dataset in 2 min; processing the computationally expensive cSNP and LogR.E analyses required an additional 20 min. Pleasance et al. classified mutations as silent, missense, nonsense, intronic and intergenic using Ensembl, version 52. MU2A classified mutation effects using RefSeq; agreement was very high (95%, refer to the Supplementary Material for details). Pleasance et al. used dbSNP build 129 to identify substitutions at known SNPs. For genome build 36.1, MU2A uses dbSNP build 130 and the 1000 genome project, providing greater coverage of known sequence variants, thereby allowing the identification of additional substitutions that correspond to known SNPs (1.8% of total substitutions). To facilitate the identification of deleterious sequence variants, MU2A annotated variants with conservation score, gene function, pathway information and impact on protein function (refer to Supplementary Material). In summary, MU2A rapidly processed substitutions, accurately classified mutation effects and identified variants that correspond to SNPs for the melanoma genome.
3.2 User interface
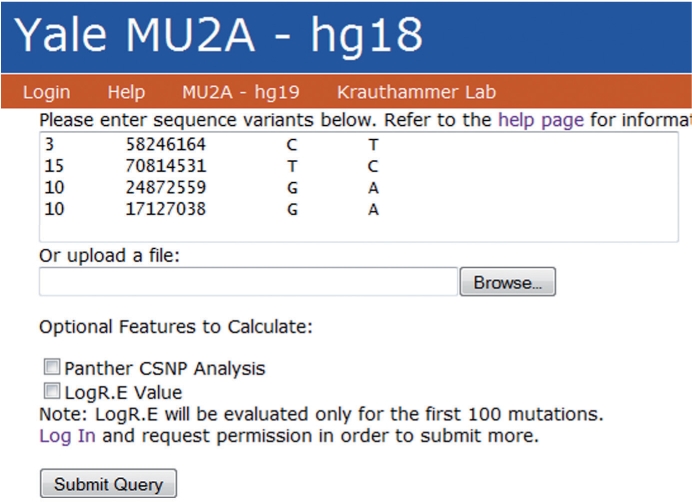
The user interface allows the submission of both the genomic or transcript position of sequence variants, making the tool equally useful for variant annotation from DNA- or RNA-seq data. Variants can be pasted in a text field or uploaded from a file from a local computer (Fig. 2). Users have the choice of performing the analysis with or without the CPU-intensive LogR.E and cSNP analysis. The MU2A WebService provides results in tab-delimited and excel formats. The excel spreadsheet can be easily filtered and is hyperlinked to external databases, simplifying the analysis of sequence variants.
Fig. 2.

MU2A user interface.
Other web-based variant annotation tools include Mutalyzer, SNPNexus, Mutation Assessor (http://xvar.org/), SeattleSeq Annotation (http://gvs.gs.washington.edu/SeattleSeqAnnotation/) and the Genomic Mutation Consequence Calculator (Chelala et al., 2009; Major, 2007; Wildeman et al., 2008). To the best of our knowledge, no other publicly available variant annotation web service accounts for the misalignment between the genome and transcriptome. Another noteworthy feature of MU2A is its availability as open source, allowing local deployment.
Funding: National Cancer Institute (grant number 1 P50 CA121974); Melanoma Research Alliance; Yale School of Medicine.
Conflict of Interest: none declared.
Supplementary Material
REFERENCES
- Ashburner M, et al. Gene Ontology: tool for the unification of biology. Nat. Genet. 2000;25:25–29. doi: 10.1038/75556. [DOI] [PMC free article] [PubMed] [Google Scholar]
- Bamford S, et al. The COSMIC (Catalogue of Somatic Mutations in Cancer) database and website. Br. J. Cancer. 2004;91:355–358. doi: 10.1038/sj.bjc.6601894. [DOI] [PMC free article] [PubMed] [Google Scholar]
- Bateman A, et al. The Pfam protein families database. Nucleic Acids Res. 2004;32:D138–D141. doi: 10.1093/nar/gkh121. [DOI] [PMC free article] [PubMed] [Google Scholar]
- Chelala C, et al. SNPnexus: a web database for functional annotation of newly discovered and public domain single nucleotide polymorphisms. Bioinformatics. 2009;25:655–661. doi: 10.1093/bioinformatics/btn653. [DOI] [PMC free article] [PubMed] [Google Scholar]
- Clifford RJ, et al. Large-scale analysis of non-synonymous coding region single nucleotide polymorphisms. Bioinformatics. 2004;20:1006–1014. doi: 10.1093/bioinformatics/bth029. [DOI] [PubMed] [Google Scholar]
- Futreal PA, et al. A census of human cancer genes. Nat. Rev. Cancer. 2004;4:177–183. doi: 10.1038/nrc1299. [DOI] [PMC free article] [PubMed] [Google Scholar]
- Henikoff S, Henikoff JG. Amino-acid substitution matrices from protein blocks. Proc. Natl Acad. Sci. USA. 1992;89:10915–10919. doi: 10.1073/pnas.89.22.10915. [DOI] [PMC free article] [PubMed] [Google Scholar]
- Kent WJ, et al. The human genome browser at UCSC. Genome Res. 2002;12:996–1006. doi: 10.1101/gr.229102. [DOI] [PMC free article] [PubMed] [Google Scholar]
- Major JE. Genomic mutation consequence calculator. Bioinformatics. 2007;23:3091–3092. doi: 10.1093/bioinformatics/btm339. [DOI] [PubMed] [Google Scholar]
- Mi HY, et al. PANTHER version 6: protein sequence and function evolution data with expanded representation of biological pathways. Nucleic Acids Res. 2007;35:D247–D252. doi: 10.1093/nar/gkl869. [DOI] [PMC free article] [PubMed] [Google Scholar]
- Needleman SB, Wunsch CD. A general method applicable to the search for similarities in the amino acid sequence of two proteins. J. Mol. Biol. 1970;48:443–453. doi: 10.1016/0022-2836(70)90057-4. [DOI] [PubMed] [Google Scholar]
- Pleasance ED, et al. A comprehensive catalogue of somatic mutations from a human cancer genome. Nature. 2010;463:191–196. doi: 10.1038/nature08658. [DOI] [PMC free article] [PubMed] [Google Scholar]
- Pruitt KD, et al. NCBI reference sequences (RefSeq): a curated non-redundant sequence database of genomes, transcripts and proteins. Nucleic Acids Res. 2007;35:D61–D65. doi: 10.1093/nar/gkl842. [DOI] [PMC free article] [PubMed] [Google Scholar]
- Sherry ST, et al. dbSNP: the NCBI database of genetic variation. Nucleic Acids Res. 2001;29:308–311. doi: 10.1093/nar/29.1.308. [DOI] [PMC free article] [PubMed] [Google Scholar]
- Thomas PD, Kejariwal A. Coding single-nucleotide polymorphisms associated with complex vs. Mendelian disease: Evolutionary evidence for differences in molecular effects. Proc. Natl Acad. Sci. USA. 2004;101:15398–15403. doi: 10.1073/pnas.0404380101. [DOI] [PMC free article] [PubMed] [Google Scholar]
- Wildeman M, et al. Improving sequence variant descriptions in mutation Databases and literature using the mutalyzer sequence variation nomenclature checker. Hum. Mutat. 2008;29:6–13. doi: 10.1002/humu.20654. [DOI] [PubMed] [Google Scholar]
Associated Data
This section collects any data citations, data availability statements, or supplementary materials included in this article.


