

Abstract
Motivation: Quality assessment of protein structures is an important part of experimental structure validation and plays a crucial role in protein structure prediction, where the predicted models may contain substantial errors. Most current scoring functions are primarily designed to rank alternative models of the same sequence supporting model selection, whereas the prediction of the absolute quality of an individual protein model has received little attention in the field. However, reliable absolute quality estimates are crucial to assess the suitability of a model for specific biomedical applications.
Results: In this work, we present a new absolute measure for the quality of protein models, which provides an estimate of the ‘degree of nativeness’ of the structural features observed in a model and describes the likelihood that a given model is of comparable quality to experimental structures. Model quality estimates based on the QMEAN scoring function were normalized with respect to the number of interactions. The resulting scoring function is independent of the size of the protein and may therefore be used to assess both monomers and entire oligomeric assemblies. Model quality scores for individual models are then expressed as ‘Z-scores’ in comparison to scores obtained for high-resolution crystal structures. We demonstrate the ability of the newly introduced QMEAN Z-score to detect experimentally solved protein structures containing significant errors, as well as to evaluate theoretical protein models.
In a comprehensive QMEAN Z-score analysis of all experimental structures in the PDB, membrane proteins accumulate on one side of the score spectrum and thermostable proteins on the other. Proteins from the thermophilic organism Thermatoga maritima received significantly higher QMEAN Z-scores in a pairwise comparison with their homologous mesophilic counterparts, underlining the significance of the QMEAN Z-score as an estimate of protein stability.
Availability: The Z-score calculation has been integrated in the QMEAN server available at: http://swissmodel.expasy.org/qmean.
Contact: torsten.schwede@unibas.ch
Supplementary information: Supplementary data are available at Bioinformatics online.
1 INTRODUCTION
In homology modelling, the quality of a model is largely dictated by the evolutionary distance of the protein of interest (target) to the available template structures. The sensitivity of tools for detecting remote homologues with very low sequence identity has increased significantly in recent years due to the development of sophisticated algorithms (Altschul et al., 1997; Dunbrack, 2006; Soding, 2005) and growth in sequence databases (Bairoch et al., 2005; Tramontano and Morea, 2003). However, with decreasing sequence similarity, an increasing amount of structural divergence is observed (Chothia and Lesk, 1986; Rost, 1999), and the resulting models may contain significant inaccuracies, especially models built on distant templates. Typical sources of errors range from misplaced side chains, incorrect loop conformations, backbone distortions, alignment errors, to choice of a template with incorrect fold (Baker and Sali, 2001; Bordoli et al., 2009; Koh et al., 2003).
Ultimately, the accuracy of a protein model determines its suitability for biomedical applications. However, at the time of modelling the quality of a model is unknown and has to be predicted as well. For this purpose, scoring functions have been developed that evaluate different structural features of protein models in order to generate a quality estimate. Most scoring functions are primarily designed to rank alternative models of the same protein sequence (Benkert et al., 2008; Eramian et al., 2008; Marti-Renom et al., 2000; McGuffin, 2008; Melo and Feytmans, 1998; Pettitt et al., 2005; Randall and Baldi, 2008; Samudrala and Moult, 1998; Tosatto, 2005; Wallner and Elofsson, 2003; Zhou and Zhou, 2002). However, variability in model quality between different target proteins is typically by far larger than the variability within the ensemble of models generated by different prediction methods for a given protein (Battey et al., 2007; Koh et al., 2003; Moult et al., 2007). Therefore, relative ranking of alternative models for a given protein is insufficient for determining its usefulness for biomedical applications such as drug design, mutagenesis experiments, analysis of functional sites, etc. Reliable absolute quality estimates are crucial for the scientist intending to use computational models (Schwede et al., 2009).
The prediction of absolute model quality has rarely been addressed in the literature: the pioneering tool ProSA (Sippl, 1993) has primarily been developed to evaluate experimental structures and estimates the statistical significance of a structure by comparing its knowledge-based score to random structures with the same sequence. The ProSA Z-score can hardly be used as a measure of absolute model quality as it is highly dependent on the protein size (i.e. the energy gap between the native fold and random decoy structures increases with protein size). Eramian et al. (2008) apply support vector regression to estimate the quality of models based on other modelling cases with similar properties selected from a large database of precompiled structure-model pairs generated by the same method. Wang et al. (2009) express the agreement of a model with several structural features predicted from the primary sequence as a reliability measure using the SCRATCH suite (Cheng et al., 2005). Most current scoring functions operate on individual protein chains and are not able to deliver quality estimates for biological assemblies.
In this work, we introduce a method for the estimation of the absolute quality of individual protein structure models which is independent of protein size and can be used to both assess isolated chains as well as entire oligomeric assemblies. The absolute quality is estimated by relating the model's structural features to experimental structures of similar size. Based on our recently introduced composite scoring function QMEAN (Benkert et al., 2008, 2009), we analyse different geometrical aspects of proteins. For normalization, the QMEAN score of a model is compared to distributions obtained from high-resolution structures solved by X-ray crystallography. The resulting ‘QMEAN Z-score’ provides an estimate of the ‘degree of nativeness’ of the structural features observed in a model and indicates whether the model is of comparable quality to experimental structures. The Z-scores of the individual terms of the scoring function indicate which structural features of a model exhibit significant deviations from the expected ‘native’ behaviour, e.g. unexpected solvent accessibility, back-bone geometry, inter-atomic packing, etc.
We first describe normalized statistical potential terms and introduce the length-corrected QMEAN scores. We then calculate normalized QMEAN scores on all experimental structures from the PDB, and provide an analysis of proteins exhibiting unusually low and high values. We finally introduce the concept of the QMEAN Z-score and demonstrate the strength of the new score for evaluating both experimental structures and theoretical models.
2 METHODS
2.1 QMEAN
QMEAN is a scoring function consisting of a linear combination of six structural descriptors as described elsewhere in more detail (Benkert et al., 2008, 2009). In short, two distance-dependent interaction potentials of mean force based on C-β atoms (i.e. residue-level) and on all atom types are used to assess long-range interactions—both are secondary structure dependent; a torsion angle potential over three consecutive amino acids is applied to analyse the local back-bone geometry of the structure and a solvation potential to describe the burial status of the residues; finally, the agreement of predicted and calculated secondary structure and solvent accessibility is included in the form of two agreement terms. Secondary structure prediction is performed by PSIPRED (Jones, 1999) and solvent accessibility prediction with ACCpro (Cheng et al., 2005). The secondary structure and solvent accessibility of the model are calculated by DSSP (Kabsch and Sander, 1983). While the agreement terms have a significant impact on the performance of QMEAN on theoretical models, they do not add additional information when experimental structures are evaluated. Evaluations on experimental structures are therefore based on the normalized QMEAN4 score (i.e. statistical potential terms only).
The optimization of the weighting factors for the terms contributing to QMEAN has been performed on models from the seventh round of the CASP experiment (CASP7) (Moult et al., 2007). To evaluate the performance on an independent dataset, QMEAN has been applied on all server models submitted to CASP8. The length-normalized statistical potentials scores are calculated as follows: the scores of single body potentials (solvation potential and torsion angle potential) are normalized by the number of residues and the scores of the non-bonded interaction potentials (all-atom and C-β potential) are divided by the total number of interactions.
GDT_TS values for the benchmark were parsed from the CASP8 website and quality assessment predictions downloaded from: http://predictioncenter.org/download_area/CASP8/predictions/QA.tar.gz.
2.2 Datasets
‘PDB training set’: the statistical potentials were extracted from a non-redundant set of high-resolution structures from the PDB (Berman et al., 2000) selected using the PISCES server (Wang and Dunbrack, 2003). A pairwise sequence identity cut-off of 20% is applied and only structures solved by X-ray crystallography with a resolution better than 2 Å and R-value below 0.25 are included, resulting in a total number of 3544 chains.
‘CASP7 training set’: the weighing factors of the QMEAN composite score were optimized based on CASP7 models (human and server) (Moult et al., 2007) using the GDTTS score as target variable (Zemla, 2003). From the initial set of 47 214 evaluated models, incomplete models covering <95% of the target sequence or lacking side-chain atoms for >10% of the amino acids were removed. The final CASP7 training set contains 34 322 models from various modelling servers.
‘CASP8 test set’: a total of 31 491 server models from CASP8 were used as an independent test set for the comparison of different implementations of QMEAN and for assessing the performance of the QMEAN Z-score.
‘PDB reference set’: a non-redundant reference set of high-resolution PDB structures for the QMEAN Z-score calculation was generated by PISCES using to following criteria: structures longer than 30 amino acids solved by X-ray crystallography, with pairwise sequence identity below 40% and resolution better than 2.5 Å were included, resulting in 9766 structures. Proteins annotated as transmembrane proteins (White, 2009) were excluded. Also, 18 low-scoring outliers showing a normalized QMEANscore (without agreement terms) deviating by more than 3 standard deviations were excluded from the PDB reference set. A complete list of these structures with high scores is provided as Supplementary Data Table S1. The final ‘PDB reference set’ contains 9451 entries.
‘Biological unit reference set’: this set contains the biological assemblies of all chains from the PDB reference set. The PISA database (Krissinel and Henrick, 2007) was used to assign the most likely oligomeric state and generate the coordinates of the assembly for all entries of the dataset. The resulting set contains biological units from 9062 unique PDB identifiers—2999 of them are monomers. A ‘biological active assembly’ may contain multiple chains from the non-redundant chain list.
2.3 QMEAN Z-score
To calculate the QMEAN Z-score, the normalized raw scores of a given model (composite QMEAN score and individual mean force potential terms) are compared to scores obtained for a representative set of high-resolution X-ray structures of similar size (number of residues of query proteins ±10%). For the analysis of isolated chains, the ‘PDB reference set’ is used and oligomeric assemblies are evaluated against the ‘biological unit reference set’. The same procedure is applied to calculate Z-scores for the agreement terms, i.e. for each structure in the two reference sets PSIPRED and ACCpro have been applied to model the background distribution of expected secondary structure and solvent accessibility prediction accuracy.
The raw QMEAN score and the individual terms have different scales and algebraic signs: QMEAN and agreement terms range from 0 to 1 and the statistical potential terms deliver pseudo energies with negative values for energetically favourable states. In the Z-score calculations, we adjusted the sign of the statistical terms such that higher Z-score consistently relate to favourable states, i.e. higher QMEAN Z-score means better agreement with predicted features and lower mean force potential energy.
2.4 Cross-validation
In order to investigate the saturation of the statistics in the QMEAN score calculation and to exclude over-training, a cross-validation experiment has been performed in the form of a leave-1/3-out experiment on the original dataset used to extract the statistical potentials (i.e. the PDB training set). We trained the statistical potentials on 2/3 of the proteins from the original training set and applied the QMEAN score on the remaining 1/3 of the structures. We randomly selected 31 complete SCOP fold classes making up roughly 1/3 of the original set (1523 PDB chains). This results in two sets having no overlap in terms of folds. If the statistics is saturated, the predicted scores of a structure from the test set should not differ considerably between the two potentials implementations, i.e. the one based on the full and the reduced training set. The cross-correlation coefficient between the original QMEAN and the QMEAN score trained on 2/3 of the training set is 0.88 which underlines that the QMEAN score calculation is robust and does not change strongly if applied on folds not used in the generation of the statistical potentials (Figure S7 in the Supplementary Data).
2.5 Comparison of predicted protein stability between thermophilic and mesophilic organisms
The dataset of pairs of homologous proteins as described in Robinson-Rechavi and Godzik (Robinson-Rechavi and Godzik, 2005) has been used. Three protein structures have in the meantime been superseded by newer entries in the PDB: 1un7 has been replaced by 2vhl, 1nrh by 1u8x and 1jsv by 2afb. One pair of homologues of the original dataset has been excluded (1g6p from T.maritima, 1c9o from Bacillus caldolyticus) since both are from thermophilic organisms. The final dataset consist of 72 protein pairs.
As in the work of Robinson-Rechavi and Godzik, proteins were shortened according to a structural alignment (FATCAT w/o flexibility, (Ye and Godzik, 2003)) in order to get homologous protein pairs of similar size.
2.6 Implementation
The current version of the QMEAN scoring function has been implemented based on the open source molecular modelling and visualization framework OpenStructure (www.openstructure.org) (Biasini et al., 2010).
3 RESULTS
3.1 Normalization of the statistical potentials
Statistical potential scores are calculated as a sum of microstates and therefore have a strong dependence on the size of the assessed protein structure and larger proteins tend to have lower energies (i.e. higher QMEAN scores). As long as similarly sized models are compared, the strong size dependence does not present an issue. However, it renders the prediction of absolute quality difficult when only looking at single models.
In this work, we introduce normalized statistical potential QMEAN terms. In order to correct for the length dependence of the statistical potentials scores, the scores of single body potentials (solvation potential and torsion angle potential) are normalized by the number of residues and the scores of the two non-bonded interaction potentials (all-atom and C-β potential) are divided by the total number of interactions considered in the calculation. Figure 1 shows the effect of the normalization on the all-atom potential. The all-atom energies of a non-redundant set of 9766 protein structures (single chains) solved by X-ray crystallography are calculated as normalized and non-normalized scores.
Fig. 1.

Comparison between traditional (A) and normalized all-atom interaction score (B) on a non-redundant set of 9766 high-resolution PDB chains.
A clear correlation with protein size is observed (Fig. 1, left) for the standard all-atom potential whereas the average energy per interaction of the normalized potential converges to an average value of −0.0058 ± 0.0017 (Fig. 1, right). This is in accordance with recent results of Thomas et al. (Thomas et al., 2010) who report an average stability value for protein folds. Smaller proteins adopt a wider range of average per-interaction energies in accordance with the fact that small peptides often exist as a diverse ensemble of conformations or are stabilized in larger complexes. Indeed, the peptides with the highest, i.e. most unfavourable, energies in the dataset are the ribosomal protein THX [PDB:2vqe, (Kurata et al., 2008)] and the disordered protein hypocretin presented on a MHC class II protein [PDB:1uvq (Siebold et al., 2004)]. On the other side of the energy spectrum, we observe three peptide hormones namely hepcidin [PDB:3h0t (Jordan et al., 2009)], endothelin-1 [PDB:1edn (Janes et al., 1994)] and relaxin [PDB:6rlx (Eigenbrot et al., 1991)] with predicted per-interaction energies far below the average value reported above. Energy values and their interpretation are given in Table S2 in the Supplementary Data.
We analysed protein chains with more than 100 amino acids having high predicted interaction energies. The 27 protein chains with highest average interaction values (more precisely those with positive per-interaction energies) all are membrane proteins. These results confirm that the structural features of membrane proteins do not follow the same distribution as proteins in solution, i.e. atomic interactions in membrane proteins and their solvation properties differ considerably from those found in soluble proteins. We decided that these proteins are better treated in a specialized mean force potential. A variant of the QMEAN score for membrane proteins is currently underdevelopment.
In analogy to the all-atom term, the other three statistical potentials of QMEAN have been normalized and for larger proteins show convergence to an average per residue energy, although with a higher variance (see Figure S1–S3 in the Supplementary Data). The same is true for the composite score of the four statistical potentials scores (QMEAN4, Fig. 2). In the course of the article, ‘QMEAN’ denotes the complete scoring function consisting of six terms based on normalized potentials. The version of the scoring function based on statistical potentials only is denoted as QMEAN4 in the following.
Fig. 2.
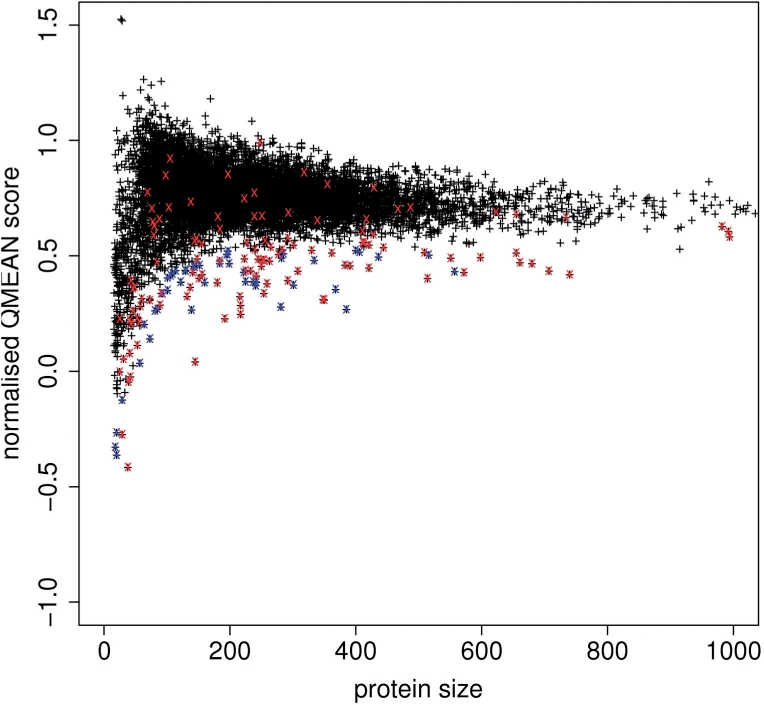
Normalized QMEAN score composed of four statistical potential terms (QMEAN4) of 9766 high-resolution structures. Red crosses indicate chains belonging to membrane proteins, blue crosses denote other proteins deviating by more than 3 standard deviations (see Supplementary Table S1 for details).
3.2 PDB reference set and QMEAN Z-score concept
In analogy to the average energy per interaction, the average normalized QMEAN4 score is constant over a wide range of protein sizes, i.e. experimental structures adopt a relatively narrow distribution of QMEAN4 scores. While the average normalized score is constant, the variance of the distribution depends on protein size (Fig. 2).
These observations lead to the idea to use a non-redundant set of protein structures as a reference to evaluate the quality of individual protein structures and models, i.e. the PDB reference set. The dataset contains 9451 non-redundant high-resolution structures, excluding membrane proteins and energetic outliers (highlighted in Fig. 2). A QMEAN Z-score for a given model is thereby calculated from its normalized QMEAN score by subtracting the average normalized QMEAN score and divided by the standard deviation of the observed distribution. In analogy, Z-scores are calculated for all individual terms of the composite score. In order to facilitate the interpretation, we standardize the algebraic sign of the calculated Z-scores such that higher Z-scores relate to more favourable models.
In the following, we first illustrate the application of QMEAN Z-score for quality estimation on two example proteins, representing a ‘good’ and a ‘bad’ experimental structure. We then extend our analysis on the entire PDB (single chains) and report outliers. The QMEAN Z-score concept is then extended from chains to entire biologically relevant oligomeric assemblies. Finally, we show that the new score can be used as a measure of absolute model quality in the assessment of theoretical models.
3.3 QMEAN Z-score analysis of experimental structures
We have applied QMEAN Z-scores to experimental structures from the PDB database (Berman et al., 2000). Table 1 and Supplementary Figure S5 show the Z-scores analysis of two experimental structures solved by X-ray diffraction: bacteriophage T4 lysozyme [PDB:2lzm, (Weaver and Matthews, 1987)] and Dengue virus NS3 serine protease [PDB:1bef, (2009; Murthy et al., 1999)]. The QMEAN Z-score of the lysozyme structure is 0.5, i.e. the score of the structure is clearly within the expected quality range as it deviates less than 1 standard deviation from the mean score in similar sized high-quality proteins from the reference dataset. In contrast, the structure of the NS3 serine protease has a QMEAN score deviating by more than 5 standard deviations indicating that there is clearly something wrong with this structure. Both the composite QMEAN score, as well as all individual terms deviate strongly from expected values (Figure S5, Supplementary Data and Table 1). Indeed, this structure, as well as several other structures from the same group, have been identified as fabricated and have been retracted (see http://www.wwpdb.org/UAB.html). A QMEAN Z-score analysis of all affected structures can be found in Supplementary Table S3.
Table 1.
Z-score analysis of the T4 bacteriophage lysozyme (2lzm, chain A) and the Dengue virus NS3 serine protease (1bef, chain A)
| PDB | QMEAN | C-β | All-atom | Solvation | Torsion |
|---|---|---|---|---|---|
| T4 lysozyme, 2lzm | 0.5 | 0.6 | 1.1 | 0.7 | −0.3 |
| Serine protease, 1bef | −5.5 | −3.4 | −3.6 | −2.7 | −4.1 |
Both the QMEAN Z-score as well as the Z-scores of individual statistical potential terms are reported. All structural properties of 1bef deviate significantly from expectation values obtained from high-resolution structures. In the meantime, the structure has been retracted from the PDB.
The ProSA (Wiederstein and Sippl, 2007) analysis of the two structure can be found in Supplementary Figure S6. The lysozyme structure receives a very low Z-scores of −8.7. The fabricated structure 1bef, however, also deviates by almost 4 standard deviations from random structures (Z-score = −3.74). In comparison to QMEAN, the score of this model does not differ considerably from many other structures in the PDB. In contrast to QMEAN, the ProSA Z-score shows a clear correlation with protein size which limits its application as an absolute quality measure. We therefore think that a comparison to high-resolution structures instead of random conformations is more meaningful.
We performed the QMEAN Z-score analysis on 144 142 protein chains from the PDB. Of these chains, 134 604 were solved by X-ray diffraction, 7979 by NMR and 1559 by electron microscopy. The Z-score distributions for structures derived by the three different methods show considerable differences (Supplementary Figure S4). The average QMEAN Z-scores are −0.58 for X-ray diffraction, −1.19 for NMR and −2.00 for EM. Among the protein chains solved by X-ray crystallography we observed 1'048 chains (belonging to 417 PDB entries) with a QMEAN Z-score less than −5. The majority of these proteins were either transmembrane or ribosomal proteins: 61 membrane proteins, 99 oxidoreductases, 109 proteins involved in photosynthesis, 46 transporters and 55 ribosomal proteins. These numbers underline the importance of a separate treatment of proteins embedded in membranes or bound to RNA, e.g. ribosomes. The remaining 48 proteins with unfavourable QMEAN Z-scores are provided in the Supplementary Data (Table S4). The majority of these structures are of quite low resolution: 79% of the proteins were solved at a resolution <3 Å.
To this point, we have applied the Z-score formalism on isolated protein chains. However, many proteins are part of oligomeric complexes and analysing protein stability on the level of isolated chains does not capture the physiologically relevant situation in the cell. We have therefore extended our analysis to complete oligomeric assemblies. Figure 3 illustrates this effect on the example of toxofilin in complex with mammalian actin [PDB:2Q97, (Lee et al., 2007)]. In the complex toxofilin (chain T, blue) adopts a non-globular conformation, which is meaningless in isolation. As expected, the QMEAN Z-score of −3.3 for toxofilin (chain T) in isolation is unfavourable, especially the solvation and the C-β interaction terms exhibit large differences between the Z-score of the isolated toxofilin monomer and the complex with actin (Table 2).
Fig. 3.

Oligomeric complex of mammalian actin (in grey) with toxofilin (chain T, blue) from toxoplasma gondii [PDB:2Q97; (Lee et al., 2007)]. In the complex toxofilin adopts a non-globular conformation, which is meaningless in isolation. As expected, the QMEAN Z-score of −3.3 for toxofilin in isolation is unfavourable (Table 2).
Table 2.
Z-score analysis of the toxofilin/actin both for the isolated chains and as well as the biological assembly defined by PISA
| Structure | Size | QMEAN | C-β | All-atom | Solvation | Torsion |
|---|---|---|---|---|---|---|
| 2q97A | 354 | −1.2 | −1.2 | −0.5 | −0.5 | −1.0 |
| 2q97T | 109 | −3.3 | −2.2 | −1.8 | −3.7 | −1.1 |
| PISAa | 926 | −1.6 | −0.9 | −0.6 | −1.2 | −1.0 |
aMost probable assembly as proposed by PISA: a tetramer consisting of two copies of the chains A and T.
Especially the solvation energy and C-β potential terms exhibit large differences between the Z-score of the isolated toxofilin monomer and the complex with actin.
The biological unit reference set contains the most likely biologically relevant oligomeric assembly generated by PISA (Krissinel and Henrick, 2007). Figure 4 shows the QMEAN scores of 9062 oligomeric entries of the biological unit reference set (see Section 2). This dataset is used as a reference set for the assessment of complexes and oligomeric proteins. All structures with extraordinarily high QMEAN scores (Z-score >3 standard deviations; 26 structures) are highlighted with green crosses. Interestingly, 22 out of these 26 are proteins from thermophilic to hyperthermophilic bacteria and archaea, two are designed proteins optimized for stability, and the remaining two are structural genomics targets of unknown function (Supplementary Table S5).
Fig. 4.

QMEAN scores for all structures in the biological unit reference set. Proteins with unusually high QMEAN scores (Z-score >3) marked in green correspond almost exclusively to proteins from thermophilic organisms (see also Supplementary Table S5).
In summary, the proteins at the periphery of the QMEAN score spectrum can be assigned to membrane proteins which exist in a fundamentally different environment compared to soluble proteins and extremely stable proteins found in thermophilic organisms.
3.4 Comparison of homologous proteins from thermophilic and mesophilic organisms
The composite scoring function QMEAN seems to capture structural features which distinguish thermostable proteins from proteins in mesophilic organisms. In order to further investigate which terms are most discriminative, we applied QMEAN on a published dataset of pairs of proteins from Thermatoga maritima and corresponding homologues from mesophilic organisms (Robinson-Rechavi and Godzik, 2005). Out of 72 protein pairs, QMEAN assigns in 75% of the cases higher scores to the proteins from T.maritima. Over the entire data set, the difference between the QMEAN scores assigned to mesophilic and thermophilic proteins is highly significant (P = 0.0001, see Table 3). The comparison is illustrated in form of a diagonal plot in Supplementary Figure S8. These findings indicate that the QMEAN score indeed may be understood as a measure of protein stability.
Table 3.
Analysis of 72 pairs of homologous proteins from Thermotoga maritima and corresponding mesophilic organisms (Robinson-Rechavi and Godzik, 2005)
| Scoring function term | Wilcoxon | t-test |
|---|---|---|
| C-β interaction potential | 0.0029 | 0.0020 |
| All-atom interaction potential | 0.0322 | 0.0293 |
| Solvation potential | 0.0031 | 0.0020 |
| Torsion potential | 0.0051 | 0.0105 |
| QMEAN | 0.0001 | 0.0001 |
The P-values in two statistical tests (Wilcoxon and t-test) on paired samples are reported. The proteins of thermophilic and mesophilic organisms differ significantly in terms of all QMEAN components.
In agreement with a study on Thermatoga maritima in which the authors identified salt bridges and compactness as major determinants of protein stability (Robinson-Rechavi et al., 2006), we observe that the solvation potential and the interaction potentials on residue-level are the most discriminative terms (P = 0.002 for both terms in paired t-test).
3.5 Analysis of theoretical models using normalized QMEAN scores and QMEAN Z-scores
In the following, the normalized QMEAN scoring function is applied on theoretical models from CASP8 and its performance is compared to other methods. We demonstrate the value of the QMEAN Z-score as a statistically well-founded measure of absolute quality and end with a critical discussion of the limitations of this approach for predicting absolute local per-residue errors.
CASP data is a good testing ground for scoring functions since it includes models spanning a wide range of quality generated by a variety of different modelling algorithms. Figure 5 shows the global correlation between the size-normalized QMEAN score and the GDT_TS distance to the native structure of all CASP8 server models. A global correlation coefficient of 0.77 overall CASP8 models is obtained. QMEAN6 scores perform significantly better than QMEAN4 to estimate the quality of predicted structures (correlation on CASP8 data was 0.77 versus 0.66). While for assessing experimental structures, the agreement terms do not provide additional value, these terms are especially effective in the medium to low model quality range (Rykunov and Fiser, 2010).
Fig. 5.

Correlation between QMEAN and GDT_TS for all server models of CASP8. (A) Scatter plot, (B) boxplot.
Table 4 shows a comparison of the normalized QMEAN scoring function (denoted as QMEANnorm) with methods participating in the quality estimation category of CASP8 (Cozzetto et al., 2009). Only scoring functions operating on individual models are used (i.e. no consensus methods and methods using structural information from homologous proteins). Compared to the original QMEAN scoring function, the normalized QMEAN shows a considerably better global correlation to GDT_TS which forms the basis for absolute quality predictions. The new version is also significantly better in ranking the models (P = 0.017) while the difference in picking the good models (mean delta GDT_TS of selected and best model) is not significant (P = 0.43). MetaMQAP and MULTICOM-REFINE have a slightly better global r but the former performs significantly worse in model ranking/selection. In terms of global correlation, the three methods perform equally well on easy targets (mean GDT_TS of top 5 models greater than 50) but QMEAN performs worse on the harder ones (see Supplementary Tables S6 and S7). The performance of QMEAN with respect to other state-of-the-art methods such as ProSA (Sippl, 1993) and DFIRE (Zhou and Zhou, 2002) has also been recently assessed in an independent study (Rykunov and Fiser, 2010). QMEAN was found to be the best performing method in terms of the selecting the best model.
Table 4.
Comparison of normalized QMEAN potentials (QMEANnorm) with single model scoring function of CASP8
| Group name | Targets | Global | Mean | P-value | Mean | P-value |
|---|---|---|---|---|---|---|
| r | r | ΔGDT_TS | ||||
| MULTICOM-REFINE | 122 | 0.786 | 0.729 | 0.258 | 0.093 | 0.936 |
| GS-MetaMQAP | 121 | 0.779 | 0.708 | 2.13E-005 | 0.132 | 0.004 |
| QMEANnorm | 122 | 0.774 | 0.738 | 0.093 | ||
| QMEANfamily | 107 | 0.751 | 0.755 | 0.0016a | 0.089 | 0.260 |
| QMEAN | 121 | 0.750 | 0.724 | 0.017 | 0.088 | 0.430 |
| MULTICOM-CMFR | 122 | 0.740 | 0.759 | 0.063 | 0.083 | 0.227 |
| Bilab-UT | 121 | 0.728 | 0.693 | 2.71E-005 | 0.107 | 0.239 |
| MULTICOM-RANK | 122 | 0.711 | 0.708 | 0.004 | 0.082 | 0.178 |
| ModFOLD | 122 | 0.686 | 0.616 | 6.24E-022 | 0.137 | 0.001 |
| BMF_PP | 96 | 0.683 | 0.615 | 9.25E-019 | 0.197 | 2.06E-007 |
| SIFT_consensus | 117 | 0.678 | 0.686 | 5.16E-007 | 0.106 | 0.117 |
| circle | 122 | 0.665 | 0.712 | 0.002 | 0.111 | 0.143 |
| Pcons_ProQ | 122 | 0.656 | 0.667 | 4.55E-010 | 0.129 | 0.003 |
| DistillSN | 120 | 0.655 | 0.476 | 6.60E-027 | 0.207 | 2.76E-012 |
| MUFOLD-QA | 122 | 0.583 | 0.645 | 2.14E-010 | 0.117 | 0.051 |
| DISTILLF | 118 | 0.581 | 0.650 | 2.07E-011 | 0.141 | 0.001 |
| MODCHECK-HD | 122 | 0.506 | 0.304 | 3.76E-043 | 0.155 | 2.40E-006 |
| SELECTpro | 122 | 0.503 | 0.635 | 3.22E-014 | 0.153 | 6.75E-005 |
| Fiser-QA | 121 | 0.502 | 0.564 | 5.24E-019 | 0.186 | 4.82E-008 |
| Fiser-QA-COMB | 121 | 0.478 | 0.521 | 7.94E-023 | 0.228 | 1.31E-010 |
| SIFT_SA | 112 | 0.469 | 0.636 | 8.98E-011 | 0.115 | 0.086 |
| Fiser-QA-FA | 121 | 0.331 | 0.524 | 2.96E-029 | 0.191 | 2.91E-007 |
| qa-ms-torda-server | 117 | 0.106 | 0.058 | 1.22E-052 | 0.487 | 2.92E-034 |
| ProtAnG_s | 121 | 0.081 | 0.124 | 4.31E-059 | 0.139 | 0.001 |
Global r: correlation against GDT_TS over all models from all targets; mean r: r averaged over individual targets; mean ΔGDT_TS: average deviation of model with best score and best model. The statistical significance of the difference is measures with a paired t-test on common targets (significantly better performance of QMEAN marked in italic, significance level: 0.05).
aQMEANfamily is significantly better than QMEAN in ranking models.
Performance of the methods described in this work (QMEANnorm) is highlighted in bold.
The robustness of the QMEAN Z-score on experimental structures lead us to apply the same concept to describe the absolute quality of theoretical protein structure models. Large deviations from expected values of experimental reference structures may be an indicator for modelling errors. The significance of the deviation as expressed by the QMEAN Z-score provides a quantitative and statistically well-founded measure of model reliability and therefore represents an absolute quality estimate of the model. (Note that the Z-score formalism does not affect QMEAN's ability to rank and select models.)
Figure 6 visualizes the differences in the QMEAN6 Z-score distributions between experimental structures of the PDB reference set (black line) and the CASP8 server models coloured according to model quality ranges (i.e. the GDT_TS distance to the native structure). The Z-score distribution of low-quality models with GDT_TS below 40 is clearly shifted towards lower Z-scores compared to experimental structures (mean Z-score = −3.85). Only a small overlap of the distributions is observed: 85% of the bad models with a Z-score above −2 are small structures below 150 residues. As can be seen inFigure 2, the variance of the QMEAN score increases with decreasing size and as a consequence the separation between good and bad structures becomes less pronounced (see also Supplementary Figure S9). Another reason for the overlap of the distributions is that 36% of the overlapping bad models are incomplete with <80% residues resolved which lowers the GDT_TS score but not the normalized QMEAN score. The ‘good’ models depicted in green reach QMEAN Z-scores comparable to experimental structures (mean Z-score = −0.65) and the ‘medium’ quality models (in blue) are located in between (mean Z-score = −1.75). A clear correlation between the GDT_TS distance of the model to target structure and the QMEAN Z-score for all CASP8 server models larger than 150 residues is observed underlining the suitability of the QMEAN Z-score as an estimate of model quality (Fig. 5 and Supplementary Fig. S10).
Fig. 6.

Density plot visualizing the QMEAN Z-score distribution of theoretical protein structure models. Z-scores for models from CASP8 are shown in relation to scores of experimental reference structures (black line). The models are split into three quality ranges with low-quality models in red, medium-quality models in blue and good models in green.
The prediction of local (per-residue) error estimates is an active field of research. For our previously introduced local QMEAN score (QMEANlocal) (Benkert et al., 2009), normalized interaction potentials lead to a slight performance increase (data not shown). However, the precision of current local scoring functions applied on single models is not sufficient as reliable absolute quality estimate. Nevertheless, a distinction between more and less deviating regions is still possible. Supplementary Figures S11 (boxplot) and S12 (ROC analysis) show the performance of QMEANlocal in estimating per-residue errors on all CASP8 models. Only a weak correlation between local score and C-α deviation exists. The ROC analysis shows that QMEANlocal is able to enrich residues from the models with low deviation from the native structure. More than half of the residues with a calculated C-α deviation below 2.5 Å are identified among the 10% best scoring residues.
4 CONCLUSIONS
In this work, we present a new method for estimating the absolute quality of a single protein structure, i.e. without including additional information from other models or alternative template structures. The measure is based on the composite scoring function QMEAN which evaluates several structural features of proteins. The absolute quality estimate of a model is expressed in terms of how well the model score agrees with the expected values from a representative set of high resolution experimental structures. The resulting QMEAN Z-score is a measure of the ‘degree of nativeness’ of a given protein structure. The Z-scores of the individual components of the composite QMEAN score point to structural descriptors that contribute most to the final score, and thereby indicate potential reasons for ‘bad’ models.
A large-scale benchmark of experimental structures revealed two groups of proteins on the periphery of the QMEAN score distribution: on one side there are membrane proteins whose structural integrity is maintained by the lipid bilayer and as a consequence their physico-chemical properties differ considerably from those of soluble proteins. On the other side of the QMEAN score spectrum, proteins from thermophilic organisms are predominant. In a direct comparison of pairs of homologous proteins, proteins from thermophilic organisms receive significantly higher QMEAN scores compared to their mesophilic counterparts.
Finally, we show that the QMEAN Z-score is a useful measure for the description of the absolute quality of theoretical models and is a valuable measure for identifying experimental structures with significant errors. Compared to most existing scoring functions, QMEAN Z-scores can be both applied on isolated chains or biological assemblies.
The QMEAN Z-score calculation has been integrated in the QMEAN server (http://swissmodel.expasy.org/qmean) (Benkert et al., 2009), and the ‘Structure Assessment’ tools of SWISS-MODEL Workspace (Arnold et al., 2006; Schwede et al., 2003) (http://swissmodel.expasy.org/workspace/). A stand-alone version is available on request from the authors.
Supplementary Material
ACKNOWLEDGEMENTS
The authors thank Florian Kiefer for his support with generating the oligomeric assemblies from PISA and all members of the group for fruitful discussions.
Funding: The development of QMEAN Z-score has been supported by the SIB Swiss Institute of Bioinformatics; Biozentrum der Universität Basel, Switzerland.
Conflict of Interest: none declared.
REFERENCES
- Dengue virus NS3 serine protease. Crystal structure and insights into interaction of the active site with substrates by molecular modeling and structural analysis of mutational effects. J. Biol. Chem. 2009;284:34468. doi: 10.1074/jbc.A005573200. [DOI] [PMC free article] [PubMed] [Google Scholar]
- Altschul SF, et al. Gapped BLAST and PSI-BLAST: a new generation of protein database search programs. Nucleic Acids Res. 1997;25:3389–3402. doi: 10.1093/nar/25.17.3389. [DOI] [PMC free article] [PubMed] [Google Scholar]
- Arnold K, et al. The SWISS-MODEL workspace: a web-based environment for protein structure homology modelling. Bioinformatics. 2006;22:195–201. doi: 10.1093/bioinformatics/bti770. [DOI] [PubMed] [Google Scholar]
- Bairoch A, et al. The Universal Protein Resource (UniProt) Nucleic Acids Res. 2005;33:D154–D159. doi: 10.1093/nar/gki070. [DOI] [PMC free article] [PubMed] [Google Scholar]
- Baker D, Sali A. Protein structure prediction and structural genomics. Science. 2001;294:93–96. doi: 10.1126/science.1065659. [DOI] [PubMed] [Google Scholar]
- Battey JN, et al. Automated server predictions in CASP7. Proteins. 2007;69(Suppl. 8):68–82. doi: 10.1002/prot.21761. [DOI] [PubMed] [Google Scholar]
- Benkert P, et al. QMEAN server for protein model quality estimation. Nucleic Acids Res. 2009;37:W510–W514. doi: 10.1093/nar/gkp322. [DOI] [PMC free article] [PubMed] [Google Scholar]
- Benkert P, et al. QMEANclust: estimation of protein model quality by combining a composite scoring function with structural density information. BMC Struct. Biol. 2009;9:35. doi: 10.1186/1472-6807-9-35. [DOI] [PMC free article] [PubMed] [Google Scholar]
- Benkert P, et al. QMEAN: a comprehensive scoring function for model quality assessment. Proteins. 2008;71:261–277. doi: 10.1002/prot.21715. [DOI] [PubMed] [Google Scholar]
- Berman HM, et al. The Protein Data Bank. Nucleic Acids Res. 2000;28:235–242. doi: 10.1093/nar/28.1.235. [DOI] [PMC free article] [PubMed] [Google Scholar]
- Biasini M, et al. OpenStructure: a flexible software framework for computational structural biology. Bioinformatics. 2010;26:2626–2628. doi: 10.1093/bioinformatics/btq481. [DOI] [PMC free article] [PubMed] [Google Scholar]
- Bordoli L, et al. Protein structure homology modeling using SWISS-MODEL workspace. Nat. Protocols. 2009;4:1–13. doi: 10.1038/nprot.2008.197. [DOI] [PubMed] [Google Scholar]
- Cheng J, et al. SCRATCH: a protein structure and structural feature prediction server. Nucleic Acids Res. 2005;33:W72–W76. doi: 10.1093/nar/gki396. [DOI] [PMC free article] [PubMed] [Google Scholar]
- Chothia C, Lesk AM. The relation between the divergence of sequence and structure in proteins. EMBO J. 1986;5:823–826. doi: 10.1002/j.1460-2075.1986.tb04288.x. [DOI] [PMC free article] [PubMed] [Google Scholar]
- Cozzetto D, et al. Evaluation of CASP8 model quality predictions. Proteins. 2009;77(Suppl. 9):157–166. doi: 10.1002/prot.22534. [DOI] [PubMed] [Google Scholar]
- Dunbrack RL., Jr Sequence comparison and protein structure prediction. Curr. Opin. Struct. Biol. 2006;16:374–384. doi: 10.1016/j.sbi.2006.05.006. [DOI] [PubMed] [Google Scholar]
- Eigenbrot C, et al. X-ray structure of human relaxin at 1.5 A. Comparison to insulin and implications for receptor binding determinants. J. Mol. Biol. 1991;221:15–21. [PubMed] [Google Scholar]
- Eramian D, et al. How well can the accuracy of comparative protein structure models be predicted? Protein Sci. 2008;17:1881–1893. doi: 10.1110/ps.036061.108. [DOI] [PMC free article] [PubMed] [Google Scholar]
- Janes RW, et al. The crystal structure of human endothelin. Nat. Struct. Biol. 1994;1:311–319. doi: 10.1038/nsb0594-311. [DOI] [PubMed] [Google Scholar]
- Jones DT. Protein secondary structure prediction based on position-specific scoring matrices. J. Mol. Biol. 1999;292:195–202. doi: 10.1006/jmbi.1999.3091. [DOI] [PubMed] [Google Scholar]
- Jordan JB, et al. Hepcidin revisited, disulfide connectivity, dynamics, and structure. J. Biol. Chem. 2009;284:24155–24167. doi: 10.1074/jbc.M109.017764. [DOI] [PMC free article] [PubMed] [Google Scholar]
- Kabsch W, Sander C. Dictionary of protein secondary structure: pattern recognition of hydrogen-bonded and geometrical features. Biopolymers. 1983;22:2577–2637. doi: 10.1002/bip.360221211. [DOI] [PubMed] [Google Scholar]
- Koh IYY, et al. EVA: Evaluation of protein structure prediction servers. Nucleic Acids Res. 2003;31:3311–3315. doi: 10.1093/nar/gkg619. [DOI] [PMC free article] [PubMed] [Google Scholar]
- Krissinel E, Henrick K. Inference of macromolecular assemblies from crystalline state. J. Mol. Biol. 2007;372:774–797. doi: 10.1016/j.jmb.2007.05.022. [DOI] [PubMed] [Google Scholar]
- Kurata S, et al. Modified uridines with C5-methylene substituents at the first position of the tRNA anticodon stabilize U.G wobble pairing during decoding. J. Biol. Chem. 2008;283:18801–18811. doi: 10.1074/jbc.M800233200. [DOI] [PubMed] [Google Scholar]
- Lee SH, et al. Toxofilin from Toxoplasma gondii forms a ternary complex with an antiparallel actin dimer. Proc. Natl Acad. Sci. USA. 2007;104:16122–16127. doi: 10.1073/pnas.0705794104. [DOI] [PMC free article] [PubMed] [Google Scholar]
- Marti-Renom MA, et al. Comparative protein structure modeling of genes and genomes. Annu. Rev. Biophys. Biomol. Struct. 2000;29:291–325. doi: 10.1146/annurev.biophys.29.1.291. [DOI] [PubMed] [Google Scholar]
- McGuffin LJ. The ModFOLD server for the quality assessment of protein structural models. Bioinformatics. 2008;24:586–587. doi: 10.1093/bioinformatics/btn014. [DOI] [PubMed] [Google Scholar]
- Melo F, Feytmans E. Assessing protein structures with a non-local atomic interaction energy. J. Mol. Biol. 1998;277:1141–1152. doi: 10.1006/jmbi.1998.1665. [DOI] [PubMed] [Google Scholar]
- Moult J, et al. Critical assessment of methods of protein structure prediction-Round VII. Proteins. 2007;69(Suppl. 8):3–9. doi: 10.1002/prot.21767. [DOI] [PMC free article] [PubMed] [Google Scholar]
- Murthy HM, et al. Dengue virus NS3 serine protease. Crystal structure and insights into interaction of the active site with substrates by molecular modeling and structural analysis of mutational effects. J. Biol. Chem. 1999;274:5573–5580. doi: 10.1074/jbc.274.9.5573. [DOI] [PubMed] [Google Scholar]
- Pettitt CS, et al. Improving sequence-based fold recognition by using 3D model quality assessment. Bioinformatics. 2005;21:3509–3515. doi: 10.1093/bioinformatics/bti540. [DOI] [PubMed] [Google Scholar]
- Randall A, Baldi P. SELECTpro: effective protein model selection using a structure-based energy function resistant to BLUNDERs. BMC Struct. Biol. 2008;8:52. doi: 10.1186/1472-6807-8-52. [DOI] [PMC free article] [PubMed] [Google Scholar]
- Robinson-Rechavi M, et al. Contribution of electrostatic interactions, compactness and quaternary structure to protein thermostability: lessons from structural genomics of Thermotoga maritime. J. Mol. Biol. 2006;356:547–557. doi: 10.1016/j.jmb.2005.11.065. [DOI] [PubMed] [Google Scholar]
- Robinson-Rechavi M, Godzik A. Structural genomics of thermotoga maritima proteins shows that contact order is a major determinant of protein thermostability. Structure. 2005;13:857–860. doi: 10.1016/j.str.2005.03.011. [DOI] [PubMed] [Google Scholar]
- Rost B. Twilight zone of protein sequence alignments. Protein Eng. 1999;12:85–94. doi: 10.1093/protein/12.2.85. [DOI] [PubMed] [Google Scholar]
- Rykunov D, Fiser A. New statistical potential for quality assessment of protein models and a survey of energy functions. BMC Bioinformatics. 2010;11:128. doi: 10.1186/1471-2105-11-128. [DOI] [PMC free article] [PubMed] [Google Scholar]
- Samudrala R, Moult J. An all-atom distance-dependent conditional probability discriminatory function for protein structure prediction. J. Mol. Biol. 1998;275:895–916. doi: 10.1006/jmbi.1997.1479. [DOI] [PubMed] [Google Scholar]
- Schwede T, et al. SWISS-MODEL: an automated protein homology-modeling server. Nucleic Acids Res. 2003;31:3381–3385. doi: 10.1093/nar/gkg520. [DOI] [PMC free article] [PubMed] [Google Scholar]
- Schwede T, et al. Outcome of a workshop on applications of protein models in biomedical research. Structure. 2009;17:151–159. doi: 10.1016/j.str.2008.12.014. [DOI] [PMC free article] [PubMed] [Google Scholar]
- Siebold C, et al. Crystal structure of HLA-DQ0602 that protects against type 1 diabetes and confers strong susceptibility to narcolepsy. Proc. Natl Acad. Sci. USA. 2004;101:1999–2004. doi: 10.1073/pnas.0308458100. [DOI] [PMC free article] [PubMed] [Google Scholar]
- Sippl MJ. Recognition of errors in three-dimensional structures of proteins. Proteins. 1993;17:355–362. doi: 10.1002/prot.340170404. [DOI] [PubMed] [Google Scholar]
- Soding J. Protein homology detection by HMM-HMM comparison. Bioinformatics. 2005;21:951–960. doi: 10.1093/bioinformatics/bti125. [DOI] [PubMed] [Google Scholar]
- Thomas A, et al. Standardized evaluation of protein stability. Biochim. Biophys. Acta. 2010;1804:1265–1271. doi: 10.1016/j.bbapap.2010.02.008. [DOI] [PubMed] [Google Scholar]
- Tosatto SC. The victor/FRST function for model quality estimation. J. Comput. Biol. 2005;12:1316–1327. doi: 10.1089/cmb.2005.12.1316. [DOI] [PubMed] [Google Scholar]
- Tramontano A, Morea V. Exploiting evolutionary relationships for predicting protein structures. Biotechnol. Bioeng. 2003;84:756–762. doi: 10.1002/bit.10850. [DOI] [PubMed] [Google Scholar]
- Wallner B, Elofsson A. Can correct protein models be identified? Protein Sci. 2003;12:1073–1086. doi: 10.1110/ps.0236803. [DOI] [PMC free article] [PubMed] [Google Scholar]
- Wang G, Dunbrack RLJ. PISCES: a protein sequence culling server. Bioinformatics. 2003;19:1589–1591. doi: 10.1093/bioinformatics/btg224. [DOI] [PubMed] [Google Scholar]
- Wang Z, et al. Evaluating the absolute quality of a single protein model using structural features and support vector machines. Proteins. 2009;75:638–647. doi: 10.1002/prot.22275. [DOI] [PubMed] [Google Scholar]
- Weaver LH, Matthews BW. Structure of bacteriophage T4 lysozyme refined at 1.7 A resolution. J. Mol. Biol. 1987;193:189–199. doi: 10.1016/0022-2836(87)90636-x. [DOI] [PubMed] [Google Scholar]
- White SH. Biophysical dissection of membrane proteins. Nature. 2009;459:344–346. doi: 10.1038/nature08142. [DOI] [PubMed] [Google Scholar]
- Wiederstein M, Sippl MJ. ProSA-web: interactive web service for the recognition of errors in three-dimensional structures of proteins. Nucleic Acids Res. 2007;35:W407–W410. doi: 10.1093/nar/gkm290. [DOI] [PMC free article] [PubMed] [Google Scholar]
- Ye Y, Godzik A. Flexible structure alignment by chaining aligned fragment pairs allowing twists. Bioinformatics. 2003;19(Suppl. 2):ii246–ii255. doi: 10.1093/bioinformatics/btg1086. [DOI] [PubMed] [Google Scholar]
- Zemla A. LGA: A method for finding 3D similarities in protein structures. Nucleic Acids Res. 2003;31:3370–3374. doi: 10.1093/nar/gkg571. [DOI] [PMC free article] [PubMed] [Google Scholar]
- Zhou H, Zhou Y. Distance-scaled, finite ideal-gas reference state improves structure-derived potentials of mean force for structure selection and stability prediction. Protein Sci. 2002;11:2714–2726. doi: 10.1110/ps.0217002. [DOI] [PMC free article] [PubMed] [Google Scholar]
Associated Data
This section collects any data citations, data availability statements, or supplementary materials included in this article.