

Abstract
Anterior thalamic lesions are thought to produce ‘covert pathology’ in retrosplenial cortex, but the causes are unknown. Microarray analyses tested the hypothesis that thalamic damage causes a chronic, hypo-function of metabolic and plasticity-related pathways (Experiment 1). Rats with unilateral, anterior thalamic lesions were exposed to a novel environment for 20 minutes, and granular retrosplenial tissue sampled from both hemispheres 30 minutes, 2h, or 8h later. Complementary statistical approaches (analyses of variance, predictive patterning and gene set enrichment analysis) revealed pervasive gene expression differences between retrosplenial cortex ipsilateral to the thalamic lesion and contralateral to the lesion. Selected gene differences were validated by QPCR, immunohistochemistry (Experiment 1), and in situ hybridisation (Experiment 2). Following thalamic lesions, the retrosplenial cortex undergoes profuse cellular transcriptome changes including lower relative levels of specific mRNAs involved in energy metabolism and neuronal plasticity. These changes in functional gene expression may be largely driven by decreases in the expression of multiple transcription factors, including brd8, c-fos, fra-2, klf5, nfix, nr4a1, smad3, smarcc2, and zfp9, with a much smaller number (nfat5, neuroD1, RXRγ) showing increases. These findings have implications for conditions such as diencephalic amnesia and Alzheimer’s disease, where both anterior thalamic pathology and retrosplenial cortex hypometabolism are prominent.
Keywords: Alzheimer’s disease, gene, microarray, pathology, rat, thalamus
Introduction
A growing list is emerging of disorders that exhibit memory impairments associated with retrosplenial cortex dysfunction. Such disorders include Alzheimer’s disease (e.g. Minoshima et al., 1997; Nestor et al., 2003a), vascular dementia (Martinez-Bisbal et al., 2004), diencephalic amnesia (Aupée et al., 2001; Reed et al., 2003), hypoxia-induced amnesia (Reed et al., 1999; Aupée et al., 2001), hypo-thyroidism (Krausz et al., 2004), epilepsy (Archer et al., 2003), and schizophrenia (Mitelman et al., 2003; Laurens et al., 2005; Newell et al., 2005). In many of these cases the retrosplenial cortex exhibits a marked hypoactivity reflecting reductions in glucose utilization, regional cerebral blood flow or blood-oxygen-level-dependent activity (Minoshima et al., 1997; Reed et al., 1999; Aupée et al., 2001; Archer et al., 2003; Nestor et al., 2003a; Reed et al., 2003; Krausz et al., 2004; Martinez-Bisbal et al., 2004; Laurens et al., 2005). A possible explanation of these findings is that pathology in a site directly connected to the retrosplenial cortex is sufficient to impair retrosplenial function and, thereby, disrupt memory processes.
The anterior thalamic nuclei (ATN) project densely upon the retrosplenial cortex (Vogt et al., 1981; van Groen et al., 1993) and there is evidence that these two regions are functionally interdependent (Sutherland and Hoesing, 1993). Furthermore, pathology in the anterior thalamic nuclei is closely associated with diencephalic amnesia (Valenstein et al., 1987; Aggleton and Sahgal, 1993; Harding et al., 2000; Maguire 2001; van der Werf et al., 2003). Likewise, in Alzheimer’s disease ATN pathology is prominent at early stages (Masliah et al., 1989; Braak and Braak, 1991a, 1991b) while the retrosplenial region is often the first area to exhibit metabolic hypoactivity (Minoshima, 1997; Kogure et al., 2000; Desgranges et al., 2002; Matsuda et al., 2002; Drzezga et al., 2003; Nestor et al., 2003a, 2003b). Such findings suggest that anterior thalamic damage could severely disrupt retrosplenial cortex function, so linking these two regions in a shared set of neurological disorders, all displaying memory loss.
Preliminary evidence for this view comes from the finding (van Groen et al., 1993) that large, unilateral thalamic lesions decrease a marker of cell metabolism, cytochrome oxidase, in granular retrosplenial cortex (Rgb). The thalamic lesions in that study were, however, very extensive, involving many nuclei. More direct support comes from the finding that selective ATN lesions (Jenkins et al., 2004) produce a dramatic loss of the immediate-early gene (IEG) products of c-fos and zif268 in Rgb, including a 90% reduction of c-Fos in superficial Rgb (Jenkins et al., 2004). These changes were striking as, 1) they represented the greatest IEG loss found anywhere in these rats’ brains, 2) they occurred even though many other afferents to Rgb were left intact, 3) they are selective as lesions to other input areas such as the entorhinal cortex, the postrhinal cortex, and the laterodorsal thalamic nucleus do not produce such IEG losses in retrosplenial cortex (Jenkins et al., 2004; Poirier et al., 2006). Perhaps more remarkable is the finding from a preliminary in vitro study that prior unilateral anterior thalamic lesions block the induction of long-term depression (LTD) in ipsilateral retrosplenial (Rgb) slices (Garden et al., 2006). This loss of plasticity is confined to the superficial cortical laminae and, hence, in register with the IEG changes, yet the microcircuits are intact in this preparation and so the abnormality cannot be the lack of an afferent signal (Garden et al., 2006). These in vitro data also provide strong evidence for ‘covert pathology’ (i.e. a functional lesion where there is no pathology detectable by standard histological means) as there is no overt pathology in the retrosplenial cortex following anterior thalamic nuclei lesions (van Groen et al., 1993; Jenkins et al. 2004) and the IEG hypoactivity seems permanent (Jenkins et al., 2004). These recent findings all suggest that the impact of anterior thalamic damage might be amplified via covert pathology in the retrosplenial cortex. Lesions were placed unilaterally in the anterior thalamic nuclei, making it possible to compare the retrosplenial cortices in the ‘intact’ and ‘lesioned’ hemispheres. This within-subjects design helped to restrict variance.
Objectives
The present study, therefore, sought to identify candidate molecular mechanisms that could instantiate permanent retrosplenial dysfunctions after ATN damage. Using microarray technology we provide the first comprehensive map of gene expression abnormalities in the retrosplenial cortex after ATN pathology. Particular questions were how ATN lesions might cause retrosplenial cortex hypometabolism and disrupt plasticity-associated functions. In Experiment 1, selected gene differences found by microarray were validated with Quantitative Polymerase Chain Reaction and immunohistochemistry. In Experiment 2, in situ hybridization was used to validate one further gene, gabrd. This gene was selected as GABA(A) activity is critical in regulating glutamatergic afferents to the cortex, such as those from ATN to the retrosplenial cortex (Gonzalo-Ruiz et al., 1997; Ichinohe and Rockland, 2002; Li et al., 2002).
Methods
Both experiments examined the status of the granular retrosplenial cortex following a unilateral anterior thalamic lesion. The principal data were derived from the microarray study (Exp. 1), but these findings were verified for particular genes by the use of immunohistochemistry (IHC, Exp. 1), Quantitative Polymerase Chain Reaction (QPCR, Exp. 1) and in situ hybridization (Exp. 2). All experiments were performed in accordance with the UK Animals (Scientific Procedures) Act (1986) and associated guidelines.
Experiment 1
Subjects
Male pigmented rats (total n = 12, Dark Agouti strain; Harlan, UK) were housed in pairs under a 13 hour light/11 hour dark cycle with ad libitum access to food and water. Each animal was extensively habituated to handling. The weight of the animals was monitored (212-248 g at the time of surgery).
Surgery
Unilateral lesions were placed in the anterior thalamic nuclei as the projections to the retrosplenial cortex remain ipsilateral, making it possible to have within-subject comparisons between the ‘Lesion’ (ipsilateral to the thalamic lesion) and the ‘Intact’ (contralateral to the thalamic lesion) hemispheres. Excitotoxic lesions were made with the goal of minimizing damage to fibers of passage.
Animals (n=12) were first anaesthetized with an intraperitoneal injection of pentobarbitone sodium (Sagatal, 75mg/kg), and then placed in a stereotaxic frame (David Kopf Instruments, CA). A craniotomy was made over both hemispheres. Excitotoxic lesions were produced by injecting 0.19 μl of N-methyl-D-aspartate (NMDA; Sigma Chemicals UK; 0.12 M in phosphate buffered saline (PBS), pH 7.2) into two sites in the same hemisphere using a 1 μl syringe (Hamilton, Switzerland). The stereotaxic coordinates were as follows: anterio-posterior, −0.5 from bregma; medio-lateral, 1.0 and 1.7 from the midline; dorso-ventral, −6.3 and −5.7 from the top of the dura for the medial and lateral injections, respectively. The incisor bar was set at +5.0. Antibiotic powder (Aureomycin, Fort Dodge Animal Health, Southampton, UK) was subsequently applied topically and all rats also received a 5 ml subcutaneous injection of glucose saline. Paracetamol was dissolved in the rats’ drinking water, and they were observed daily until recovery. A period of six to nine weeks preceded tissue sampling.
Behavioral Procedures
Five days preceding tissue extraction, the animals were individually housed. In order to minimize unwanted disruption the rats were first habituated daily to a separate holding room in which there were no other rats. Twenty-four hours prior to tissue extraction, the animals were placed in this new holding room, under the standard feeding regimen and light cycle. The next day, the animals were individually placed for 20 minutes in a novel, larger cage with different flooring in a novel environment of different dimensions and containing different visual stimuli. The purpose of this manipulation was to increase the likelihood of transcript expression, and so minimize floor effects.
Retrosplenial tissue from animals with unilateral anterior thalamic lesions was sampled at three time points following exposure to the novel environment (30 min, 2 and 8hrs from onset of exposure, Fig.1a), but at comparable times of day. The three delays allowed the detection of changes in genes that are expressed early and late after stimulation (e.g. Cavallaro et al., 2002; Hong et al., 2004).
Figure 1.

a) Timetable on experimental day. Animals were individually placed for 20 minutes in a novel cage in a novel environment, then returned to the test room (either 10 min, 1h40min or 7h40min). b) Approximate location of the coronal slices along the rostro-caudal axis, and c) the location of the tissue punches on a coronal plane (adapted from Paxinos and Watson, 1997). ATN, anterior thalamic nuclei; Rgb, granular b retrosplenial cortex; IHC, slices taken for Nissl stains and immunohistochemistry.
Anatomical nomenclature
The retrosplenial cortex of the rat (area 29) comprises two major subregions, granular and dysgranular (Vogt and Peters, 1981). The granular retrosplenial cortex can be subdivided (Vogt and Peters, 1981) into a caudal area a (Rga) and a more rostral and dorsal area b (Rgb). It should be noted that the rat brain does not possess a distinct area 23, rather the retrosplenial cortex occupies all of the posterior cingulate region. For this study, Rgb was the region of interest for three principal reasons. First, Rgb receives dense inputs from the anterior thalamic nuclei (Vogt et al., 1981; van Groen et al., 1993). Second, the most prominent retrosplenial IEG changes are seen in this region after anterior thalamic lesions (Jenkins et al., 2004), iii) its location (immediately above the caudal half of the corpus callosum) can readily be determined in fresh tissue, so aiding both the reliability and validity of the tissue samples.
Tissue microdissection
Rats were killed between 17h and 20h by stunning followed immediately by cervical dislocation. In order to kill the rats at the same time of day, it was necessary to stage their introduction to the novel environment according to their group (8h, 2h, 0.5h prior to sacrifice, Fig. 1a). Following removal from the skull, the brain was rinsed in cold, DEPC-treated 0.1 M phosphate-buffered saline (PBS), and placed dorsal surface up in a Perspex rat brain matrix (WPI, Florida, specific for rats weighing 175-300g). The dissection lasted at most two minutes. Two 2 mm coronal slices were first obtained by making three coronal cuts (Fig. 1b), and then placed on dry ice. Discrete samples of Rgb were then punched out with a 19 gauge punch (Fig. 1c), using techniques already validated for array analysis (Holter et al., 2001). The gauge size ensured that all laminae were involved while minimising any encroachment into adjacent grey or white matter.
One retrosplenial cortex punch was taken from each hemisphere for each slice. For each subject, the two punches from the same hemisphere (i.e. ‘Lesion’ and ‘Intact’) were pooled. This entire procedure was repeated for a total of 6 animals and 12 hemispheres per replicate. The punches were stored at −70°C. Confirmation of the anterior thalamic lesions used the tissue immediately anterior to the more rostral slice (‘IHC’, Fig. 1c). After confirmation of the lesions (see below), the tissue from two rats per time point was pooled together by hemispheric condition (‘Lesion’ or ‘Intact’).
Confirmation of anterior thalamic nuclei lesions
The lesions were confirmed in two ways. First, coronal sections from the rostral thalamus (‘IHC’, Fig. 1b) were processed with a Nissl stain (the anterior thalamic nuclei lie just rostral to the most anterior slice taken for Rgb tissue). Second, coronal sections from the most rostral portion of Rgb (immediately in front of the most anterior slice) were processed immunohistochemically to confirm that the thalamic lesions were sufficient to produce clear reductions of c-Fos levels in Rgb (Jenkins et al., 2004).
The portion of the rat brain anterior to the most rostral coronal slice (IHC, Fig. 1c) was first placed overnight in 4% paraformaldehyde in PBS for fixation, and next again overnight in 25% sucrose in PBS. Coronal sections were cut at 40 μm on a cryostat (Leica Instruments) and three series of adjacent sections retained. One series was for Nissl staining and another for c-Fos immunohistochemistry. For Nissl staining, the sections were first mounted onto gelatine-coated slides, stained with cresyl violet, and coverslipped using DPX mountant (Fisher Scientific). For c-Fos visualization the sections were collected in 0.2 % Triton-X-100 in 0.1 M PBS at pH 7.4 (PBST). Endogenous peroxidase activity was blocked by washing the sections with 0.3 % hydrogen peroxide in PBST for ten minutes, and then four times with PBST alone for the same duration. Sections were incubated at 4°C for 48 hours in PBST with rabbit polyclonal antibody for c-Fos (1:5000, Ab-5, Oncogene Science). Sections were then rinsed for ten minutes in PBST, four times. Next, they were incubated in biotinylated secondary antibody, and then avidin-biotinylated horseradish peroxidase complex in PBST (Elite Kit, Vector Laboratories). Sections were next rinsed in Tris non-saline buffer (pH 7.4). Finally, immunoreactivity was visualized with diaminobenzidine (DAB Substrate Kit, Vector Laboratories) chromogen incubation. Sections were then mounted on gelatinised slides, dehydrated through a series of alcohol gradients and coverslipped.
Sections were viewed on a Leica DMRB microscope, digitally photographed using an Olympus DP70 camera. Counts of c-Fos-positive cells used the program analySIS^D (Olympus, UK). The threshold was set at the same level for all sections and counts were made in a frame area (1768 × 1331 μm, using 5× magnification) that included all Rgb lamina. Counts were typically taken from three consecutive sections from both hemispheres of the retrosplenial cortex (approximately between −2.56 and −3.14 from bregma according to Paxinos and Watson, 1997), and these counts were averaged to produce a mean. A two-way paired-samples t-test compared c-Fos counts between the ‘Intact’ and ‘Lesion’ hemisphere.
RNA extraction and microarray hybridization
RNA was extracted (as described by before by Chomczynski and Sacchi, 1987) from the pooled tissue (cf. Humphries et al., 2002). Briefly, the sample was homogenised in the denaturing solution (guanidinium isothiocyanate/mercaptoethanol) and then sodium acetate, phenol, and chloroform-iso-amyl alcohol mixture were added and the solution shaken vigorously. After 10 minutes incubation on ice, samples were centrifuged for 10 minutes at 14000rpm at 4°C. At this point the RNA was present in the aqueous phase. This phase was removed and mixed with ethanol and placed at −20°C for an hour for the RNA to precipitate. This solution was centrifuged again for 10 minutes and the resulting pellet was dissolved in the denaturing solution and then precipitated with ethanol at −20°C for 1 hour. After a further 10 minute centrifugation, the pellet was washed in 95% ethanol, dried and dissolved in diethyl pyrocarbonate (DEPC)-treated water. Yields of total cellular RNA extracted from the pooled punches in each sample ranged from 1.40 – 2.52μg. A 3 μl aliquot (approx. 0.6 μg) of each sample was supplied to the Wales Gene Park Affymetrix GeneChip Expression Profiling Service, Cardiff University. Before further processing, each RNA sample was quality controlled using Agilent RNA6000 chips. Following this check, 100ng of each sample was used to amplify biotinylated cRNA targets using Affymetrix GeneChip protocols and reagents. The biotinylated cRNA (target) was probed with rat genome 230A GeneChips. Hybridization and washing was performed using a GeneChip fluidics station 400 (Affymetrix). After scanning the microarrays, initial data processing was conducted with Microarray Suite 5.0 (Affymetrix). The average signal intensity of each array was scaled to 100. This procedure normalizes the raw data and corrects for technical variation between the arrays (e.g. differences in hybridization conditions).
QPCR validation of microarray candidate genes
QPCR was used to verify the microarray findings for nine genes. These candidate genes were chosen from different classes of genes identified by the microarray analyses (see below). Using material from the same subjects as for the microarray analyses, for each sample 0.5μg of total RNA was processed in a reverse transcription reaction in either the presence (RT+) or absence (RT−) of reverse transcriptase (Superscript II protocol, Invitrogen). Then 15μl of each cDNA was diluted with 135μl of 10μg/ml tRNA. QPCR analysis of transcript levels was performed according to established protocols (Sugden, 2003). Briefly, QPCR was performed using a LightCycler™ 1.2 (Roche, UK) in a 10 μl volume using sense and anti-sense primers (0.5 μM; sequences given in Supplemental Information) and the dNTPs, Taq DNA polymerase and reaction buffer provided in the QuantiTect SYBR Green kit (Qiagen, UK). All QPCR assays used an initial 15 min., 95°C step to activate Taq polymerase, followed by 35-40 cycles of denaturation 95°C, 15 sec., annealing 56°C, 20 sec. and extension 72°C, 10 sec. The fluorescence of the accumulating product was acquired each cycle after an additional 3 sec. step to 3°C below the product Tm. All assays included a tRNA and RT negative control. Target amplification was verified for all genes as all assays gave a single melting peak and a single band of the expected size on agarose gel/EtBr electrophoresis (2.2% w/v). The standards used for quantification of copy number in cDNA samples were gene specific PCR products purified by agarose gel/EtBr electrophoresis and then quanitated by densitometry against a known quantity of a low molecular weight (109 bp) DNA marker. Standards were diluted to give 101 to 107 copies/assay, aliquoted, stored at −80°C and used in each assay. All assays were highly efficient (>92%) and standard curves were all linear from 101 to 107 with correlation coefficients (r2) >0.9990 (see QPCR Assay Characteristics in Supplemental Information)
Analyses of microarray data
Analyses used GeneSpring™ software (Version 6.1, Silicon Genetics, Agilent, Santa Clara, CA) to characterize mRNA changes in area Rgb following anterior thalamic lesions. The data for all of the analyses were first log transformed. The hybridization intensity was normalized per chip to the 50th percentile (0.01 cut-off value) and per gene to the median. Data filtering was applied using parameters recommended by Silicon Genetics. Genes that were labeled as “absent” based on their absolute signal level in all samples were removed.
In order to augment the replication reliability, the cross-gene error model was applied to the analyses of variance. Calculations for all samples thus relied on the combined within-sample and between-sample variation, taking into account replicate variability, using values produced by the scanning software for the signal precision of each transcript. A control strength cutoff value was thus calculated for “reliable” data and used as a filter for the signal strength of the probes in each condition. The cross-gene error model used by GeneSpring™ generally yields more conservative results than signal strength compared to control.
Analysis of variance
We initially used the widespread approach of fold-change analyses (see below). Lists of genes exhibiting 1.8 fold-change in expression between treatment groups were created for each time condition and then pooled. The application of parametric statistical measures for microarray data using Affymetrix chips is suitable as it has been found that such data sets exhibit good correlation with normality (Wang et al., 2001; Giles and Kipling, 2003). A two-way ANOVA using Surgical Treatment (‘Intact’ and ‘Lesion’) and Time (30 min, 2h, 8h after the beginning of novel context exposure) was performed, followed by one-way ANOVAs for individual Time levels. Correction for multiple testing was applied using a false discovery rate of 0.05 (FDR, Benjamini and Hochberg, 1995), which means that 5 % of the genes that pass the statistical test can be considered to be false positives, i.e. genes that pass the test by chance.
Expression pattern cluster analysis
The Quality Threshold (QT) clustering method uses a set of rules to retain only clusters of a good quality. Only those genes for which expression profiles are within a user-specified level of similarity will be clustered (Minimum cluster size 5; minimum similarity 0.9; similarity measure Pearson correlation). All other genes remained unclassified.
Treatment profiling
The analyses of variance were complemented by using the class prediction function of GeneSpring™. While an ANOVA on differences in gene expression levels based on fold-change may allow the production of a reasonable list of genes affected by the manipulation, the fold-change analysis is based on an arbitrary value (here, 1.8) that has no physiological correlate. For some transcripts, changes smaller than the chosen value (1.8) are biologically meaningful, so it is possible that subtle but robust findings may be hidden by such an analysis (Murphy, 2002; Pavlidis, 2003).
The class prediction function of GeneSpring™ allows the statistical comparison of gene expression levels between treatments, without any arbitrary fold-change threshold. Only those genes whose relative expression level correctly predicted class membership (e.g. treatment condition) were identified, based on robust differential expression levels. In other words, the relative expression level of these genes could predict treatment in any condition of either duplicate.
The class prediction function uses Fisher’s exact test to assign a p-value for the possibility of transcripts being located by chance closer to either of the classes (according to hypergeometric distribution), on either side of a decision cut-off value. This value is created by producing for each transcript the ratio of the p-values from each class. The default cutoff value is 0.2, meaning that the magnitude of the difference between the p-values must be five or more. This forms the basis for the prediction strength value, according to which the transcripts are then ranked. A final filter was applied, limiting the number of regulated genes for further analysis to the top two percent. The class prediction analysis yielded a set of genes that always correctly identified surgical treatment membership.
Pooling the Surgical treatment conditions and producing gene class predictions for Time was unreliable as this yielded numerous group prediction errors. In contrast, pooling across time points and using the class prediction tool for the Surgical treatment variable yielded no prediction errors for the transcriptome profiling of each surgical treatment, and so only these results are presented.
Expression pattern cluster analysis
A QT Cluster analysis was conducted on this class prediction list. The parameters were the same as for the fold change analyses (minimum cluster size 5; minimum similarity 0.9; similarity measure Pearson Correlation). To identify transcripts only labeled as Expressed Sequence Tags (ESTs), we used the Basic Local Alignment Search Tool (Altschul et al., 1997), a nucleotide sequence similarity search program (http://www.ncbi.nlm.nih.gov/BLAST/). Transcripts that were labeled by GeneSpring™ as “similar to” a known gene were also thus confirmed. A positive identity was inferred when high similarity ratings were produced, where the possibility that a similar nucleotide sequence match would be found by chance was low (i.e. the E-value was close to zero).
Where possible, gene transcripts were next annotated using gene ontology information from the Rat Genome Database (www.rgd.mcw.edu), Genecards (www.genecards.org) and literature searches on Pubmed (www.ncbi.nlm.nih.gov/entrez/). In order to capture the overall nature of the changes produced by the thalamic lesions the genes were then classified in terms of their cellular localization and their functional role according to the Kyoto Encyclopedia of Genes and Genomes scheme (http://www.genome.jp/kegg/).
Transcription factor binding site analysis
The evaluation of the potential transcription binding sites shared by the promoter regions of genes identified by the fold-change and treatment profiling microarray analyses used the Match™ program (Kel et al., 2003) with the TRANSFAC database (http://www.gene-regulation.com/pub/programs.html#match).
Gene set enrichment analysis (GSEA)
We applied GSEA as another method of supervised computational data processing. Similarly to the treatment profiling approach described earlier, GSEA compared the two surgical conditions. However, instead of being based on analyses of individual genes, the strength of GSEA lies in the evaluation of the over-representation of pre-defined gene sets that are pathway-related (Subramanian et al., 2005). This approach enabled a formal consideration of pathways in relation to the observed gene expression changes, and was applied as described by Subramanian and co-workers (Subramanian et al., 2005).
Experiment 2
GABAergic signals are central to intrinsic retrosplenial cortex signal integration (Ichinohe and Rockland, 2002; Li et al., 2002) and for the control of the feed-forward communication in thalamocortical circuits (e.g. Daw et al., 2007). In light of the vital role of cortical GABA, the expression levels of the microarray-derived gabrd transcript were tested using a different technology, in situ hybridization. This method required a different group of rats.
Subjects
Male rats (n=10, Dark Agouti strain, Harlan, UK) weighing between 200 and 225 g at the time of surgery were housed in pairs under a 13 hour light/11 hour dark cycle with ad libitum access to food and water. Each animal was extensively habituated to handling.
Tissue preparation
For the in situ hybridization experiment, unilateral anterior thalamic lesions were produced by infusing 0.20 μl of 0.12 M NMDA twice, per hemisphere (for coordinates see Exp. 1). Four weeks after surgery, the rats were killed 30 min after exposure to a novel environment by CO2 exposure and decapitation. Whole brains were rapidly removed and frozen on dry ice, then stored at −70°C until sectioned. Sections (14 μm) were cut on a cryostat (Leica Instruments) and thaw-mounted onto poly-L-lysine (hydrobromide; molecular mass >300,000; Sigma, Poole, UK)-coated glass slides (0.02 mg/ml DEPC-treated water). The sections were air-dried for ≥30 min, fixed in 4% paraformaldehyde in 0.1 M PBS, pH 7.4, for 5 min, rinsed in PBS for 1 min, delipidated in 70% ethanol for 4 min, and stored in 95% ethanol at 4°C.
In situ hybridisation
A DNA antisense probe complementary to nucleotides 119–159 of the rat gabrd gene (Shivers et al., 1989; NCBI accession number NM 017289) was synthesized commercially (Sigma-Genosys, Cambridge, UK). This oligonucleotide was 3′ end-labelled with [α-35S]dATP (1200 Ci/mmol; New England Nuclear, UK) in a 30:1 molar ratio of radio-labelled ATP:oligonucleotide using terminal deoxynucleotidyl transferase (Promega) as described previously (Wisden and Morris, 1994). Specific activity of the 35S-labelled probe was between 1.8 ×10⁵ d.p.m./microlitre probe. To define nonspecific hybridization, adjacent slide-mounted sections were incubated with the radiolabelled gabrd oligonucleotide probe in the presence of an excess (100×) concentration of unlabelled oligonucleotide probe.
After hybridisation, sections were opposed to Eastman Kodak (Rochester, NY) BioMax X-ray film for 2 weeks. After obtaining appropriate x-ray film exposures, sections were dipped in K5 photographic emulsion (Ilford, UK). Sections were exposed for 18 weeks at 4°C prior to development and then counterstained with 0.01% thionin.
Silver grain density was assessed in laminae II (superficial) and V (deep) of Rgb from typically three adjacent sections (−2.8 to −6.0 mm from bregma) using LeicaQWIN imaging software (Leica Microsystems). Grains (total and non-specific) were counted over 8-10 cells per hemisphere for each lamina, and the mean number of silver grains per cell calculated. The specific grain count mean was then obtained by subtracting the non-specific from the total count means. Statistical analyses (SPSS 14.0, Chicago) started with a two-way ANOVA with the factors surgical treatment and lamina. Post hoc tests were made where appropriate. The grain counts were obtained by an investigator blind to the treatment of each hemisphere.
Results
Experiment 1
Histology – Nissl confirmation of thalamic lesions
All animals included for the analyses exhibited discrete lesions in the anterior thalamic nuclei, removing most of the cells in the anterodorsal and anteroventral nuclei (Fig. 2). In the smallest of these 12 lesions there was some light anterior ventral nucleus sparing throughout, though mainly in the rostral part of the nucleus with less sparing further caudally. Complete loss of the anterodorsal nucleus was seen in this case, but little damage was seen in the anterior medial nucleus or the lateral dorsal nucleus. The largest lesion of the 12 cases removed all of the anterior ventral and anterior dorsal nuclei. There was damage in the anterior medial nucleus but it was not completely removed. Very limited cell loss was sometimes observed in the immediately adjacent part of the dentate gyrus, i.e. in the most rostral part of the medial blade of the dentate gyrus (n=8). The fornix always contained two needle tracks. There was also restricted damage to the rostral pole of the lateral dorsal nucleus in all cases. As expected, counts of Nissl-stained cells in the retrosplenial cortex failed to find evidence of a difference between the ‘Lesion’ and ‘Intact’ hemispheres (paired samples t-test, t(11)=1.3, p=0.2; Fig. 3c).
Figure 2.
a) The smallest and largest anterior thalamic nuclei lesions are represented in dark and light grey, respectively, on a series of standard coronal sections. The numbers refer to the distance from bregma. b) Photomicrograph of a Nissl-stained coronal section, contrasting the anterior thalamic nuclei in a normal hemisphere (left) and a lesioned hemisphere (right). The outline highlights the area of gliosis and cell loss. Note that the tissue was not perfused, hence the poor differentiation. AD, anterior dorsal thalamic nucleus; AM, anterior medial thalamic nucleus; AV anterior ventral thalamic nucleus. The scale bar represents 500 um.
Figure 3.

a) Photomicrographs of representative sections showing the very clear c-Fos but not Nissl, reduction indicated by the arrow in Rgb ipsilateral to the anterior thalamic nuclei lesions. The laminae are identified in each photomicrograph. The scale bar represents 200 μm. b) The selective loss of c-Fos protein is shown by the normal pattern of signal intensity in the cresyl violet sections (upper) compared with the c-Fos labelled sections (lower), with 0-600 μm corresponding to laminae I-VI. Note the difference in the superficial laminae. The horizontal mean profile was derived by analySIS^D (Olympus, UK). Measures of the grey value intensity of each pixel were made along a horizontal plane, and all of these were averaged to produce a laminar profile of signal intensity. (c) Significant reduction of c-Fos-positive cells but not Nissl-stained cells in the Lesion hemisphere (**p<0.0001, see text).
Histology – Immunohistochemical confirmation of thalamic lesions
Further confirmation of the effectiveness of the lesions came from the expected (Jenkins et al., 2004) striking decrease in the number of c-Fos-positive cells in Rgb in the ‘Lesion’ hemisphere [paired samples t-test (two-way), t(11)=6.3, p<0.0001, Fig.3].
Microarray analyses
The normalized probe signal intensity profiles of individual samples were similar and normally distributed, and thus no set was removed (see Fig. S1 in supplemental material). All samples were also highly correlated (>.90, .25 weighing coefficient). The data quality filters yielded 9075 satisfactory ‘transcripts’ out of the original 15923 probe sets. As all comparisons were between the ‘Intact’ and the ‘Lesion’ hemisphere, the transcript analyses are based on relative and not absolute levels.
Fold-change ANOVA
A total of 319 transcripts were differentially expressed at the ≥1.8 fold-level. The 2-way ANOVA based on this gene expression fold-change produced a list of 32 genes exhibiting significant changes in expression levels between the surgical conditions (see Table 1), but there was no significant effect of post-novelty Time interval or significant interaction between Time and Surgical Treatment. All genes were significant for Surgical Treatment (p<0.05). In this list, according to the chosen false discovery rate, 1.6 genes would be expected to be false positives. Typically, the 32 genes were expressed at a relatively higher level on the ‘Intact’ than the ‘Lesion’ side (25 vs. 7 genes, respectively). Among the genes showing a 1.8 fold change were a number of transcription factors (c-fos, klf5, fra-2, zfp91), frequent functional associations being with cellular processes and genetic information processing, most prominently relating to immune responses and the regulation of transcription.
Table 1.
Sets of genes exhibiting similar expression patterns as determined by cluster analysis (based on fold-change list).
| Set | Found in class patterning? † |
Time point (h) |
Functional classification |
Common Name |
Synonym | EST* | Genbank | |||
|---|---|---|---|---|---|---|---|---|---|---|
| 0.5 | 2 | 8 | ||||||||

|
y |
|
- | - | Ion transport | Sodium channel, voltage-gated, type I, beta polypeptide (Scn1b) |
GEFSP1 | - | AF182949 | |
| n | - | - | - | Cell adhesion | Nel-like 1 (Nell1) | IDH3GL, NRP1 | - | NM_031069 | ||
| y |
|
- | - | Transcription | Kruppel-like factor 5 (intestinal) (Klf5) |
IKLF, BTEB-2 | - | NM_053394 | ||
| y | - | - | - | Development | Netrin-G1a (Ntng1a) | Laminet1 | 1067 0.0 |
BM391312 | ||
| n |
|
- |
|
Development | Cerebellin 1 precursor protein (cbln1) |
Precerebellin-1 gene |
908 0.0 |
AI227829 | ||
| n | - | - |
|
Signal transduction | Small inducible cytokine subfamily 8 (cys-xcys) member 14 (Scyb14) |
SCYB14, KS1, Kec, BMAC, BRAK, NJAC, MIP-29, bolekine |
178 6e-42 |
BG380414 | ||
| y | - | - | - | Folding, sorting, and degradation | Matrix metalloproteinase 9 (MMP9) |
Gelatinase b, Macrophage gelatinase, ype V collagenase, 92kD type IV collagenase, CLG4B |
- | NM_031055 | ||

|
n |
|
- | - | Cell communication | Chromogranin B (Chgb) | Parathyroid secretory protein; secretogranin I |
- | NM_012526 | |
| n | - | - |
|
Cell adhesion | Olfactomedin 3 (olfm3) | Optimedin form B, NOE3 |
- | AF442822 | ||
| y |
|
- | - | Cell adhesion | Limbic system associated membrane protein (Lsamp) |
LAMP-1, CD107a, LGP120 |
- | U31554 | ||
| y |
|
- | - | Development | Fibronectin type III domain containing 5 (Fndc5) |
Peroxisomal protein (pepgene, Pep), Pxp, FRCP2, LOC260327 |
599 4e-168 |
AI172165 | ||
| y |
|
- | - | Neuroactive ligand-receptor interaction |
5-HT2C receptor (5-HT2cR) | Htr1c | 509 3e-141 |
BF285539 | ||
| y | - | - | - | Unknown | BAC clone RP23-312H15 from 16 |
LOC360483 mRNA |
- | AI412090 | ||
| y |
|
- |
|
Transcription | Retinoblastoma binding protein 5 (RBBP-5) |
RBQ 3 | 396 3e-107 |
AA946518 | ||

|
y |
|
- | - | Neuroactive ligand-receptor interaction |
Adrenergic receptor, beta 3 (Adrb3) |
- | NM_013108 | ||
| n | - | - | - | Immune system | Cysteinyl leukotriene receptor 1 (Cyslt1, Cysltr1) |
- | NM_053641 | |||
| y |
|
- | - | Cell communication | Zyxin (zyx) | HED-2 | - | AA943537 | ||
| Unc | S>L | n | - | - | - | Transcription | zinc finger protein 644 (Zfp644) | 182 3e-43 |
AW916491 | |
| S>L | n | - | - | - | Transcription | c-fos | - | BF415939 | ||
| S>L | n | - | - | - | Lipid metabolism | Hydroxysteroid dehydrogenase, 11 beta type 1 (Hsd11b1) |
Corticosteroid 11-beta- dehydrogenas e isozyme 1 |
- | NM_017080 | |
| S>L | n | - | - | - | Cell adhesion | Non-processed neurexin I-alpha (Nrxn1) |
Nrxn1b | - | NM_021767 | |
| S>L | n | - | - | - | Signal transduction | Solute carrier family 9 (sodium/hydrogen exchanger), isoform 3 regulator 1 (Slc9a3r1) |
Ezrin-radixin- moesin-binding phosphoprotei n |
- | NM_021594 | |
| S>L | n | - | - | - | Transcription | Zinc finger protein 91 (PZF) | ZFP91 | - | BE112093 | |
| S>L | y | - |
|
- | Lipid metabolism | hypothetical protein MGC11324, Hypothetical phospholipid and glycerol acyltransferase |
398 9e-108 |
AI599365 | ||
| S>L | n | - | - | - | Transcription | Fos-related antigen, exon 4 (Fra- 2) |
307 9e-81 |
AI031032 | ||
| S>L | y | - | - | - | Translation | Speckle-type POZ protein (Spop) | TEF2 | 476 2e-131 |
BF283504 | |
| S>L | y | - | - | - | Folding, sorting, and degradation | Ubiquitin specific protease 3 (Usp3) |
- | AI411205 | ||
| L>S | y |
|
|
|
Immune system | CD74 | INVG34, LN2 | - | NM_031069 | |
| L>S | n | - | - | - | Cytoskeleton, Microtubule and actin- movement related |
Desmuslin (Dmn) | KIAA0353, synemin |
- | BG373779 | |
| L>S | n | - | - | - | Immune system | Protein S alpha (ProS1) | PSA, PS21, PS22, PS23, PS24, PS25 |
- | U06230 | |
| S>L | n |
|
- | - | Cytoskeleton, Microtubule and actin- movement related |
Cytoskeleton-associated protein 4 (Ckap4) |
CLIMP-63, P63, MGC99554 |
- | BI278813 | |
| L>S | y |
|
|
|
Immune response | Rat MHC class II RT1.u-D-alpha chain mRNA, 3′ end |
HLA-DRA | - | Y00480 | |
Refers to gene, not necessarily the same transcript.
Level of time condition for which surgical treatment resulted in significant differences in gene expression of ≥ 1.8 fold change.
For Expressed Sequence Tag (EST) similarity searches, the similarity score and the E-value are provided. (S = ‘Intact’ = solid line; L = Lesion = dashed line).
While there was no overall effect of post-novelty time interval on gene expression, the cluster analysis on this list yielded sets of genes exhibiting three major temporal patterns expression patterns according to condition (see Table 1). A one-way ANOVA identified the time points at which 1.8 fold changes in expression levels were seen for each gene between the two surgical treatment conditions (see Table 1). The complementary nature of the profiles of these cluster analyses helps to explain why there was a null effect of post-novelty interval overall. Furthermore, while there were no systematic differences in the post-lesion durations for the three novelty context – intervals, variability in this measure could have increased the likelihood of a null result.
Treatment transcriptome profiling
The class prediction analysis yielded a list of 202 genes (see Table 2 in supplemental material) for which relative expression levels were consistent for data across all time points and both replicates, and so exhibited significant differences according to this method, e.g. a specific transcript was always significantly greater in one level of the Surgical treatment, for all time points and across both replicates. Over three quarters of the 202 genes identified by this method were at greater expression levels in the ‘Intact’ than ‘Lesion’ Rgb tissue (157 vs, 45, respectively). The cluster analysis again allowed us to further segregate genes on this list into sets according to their expression patterns across the time points for each condition (see Table 2 in supplemental material).
Both the fold change and the predictive patterning analyses specified that amongst all cellular compartments, genes found in the nucleus and the membrane appeared to be most affected. Furthermore, transcription emerged as one of the functions most frequently represented in both the fold-change and the predictive patterning analyses. In addition to the expected fall in the expression of c-fos, based on previous immunohistochemical studies of c-Fos protein levels after anterior thalamic lesions (Jenkins et al., 2004), differences between the ‘Intact’ and the ‘Lesion’ hemispheres were also found for the transcription factors fra-2, zfp91 and klf5 based on fold-change differences. The transcription factors identified by predictive patterning included klf5, brd8, nfat5, nfix, nr4a1, smad3, NeuroD1, SMARCC2, and RXRγ, with klf5 common to both methods. It is evident that diverse functions were disturbed by the lesion, affecting more pathways than only those that converge on the c-fos promoter region. The computational analysis of the gene promoter elements identified candidate transcription factor binding sites that were shared by the genes highlighted by the treatment profiling and the fold-change approaches. In descending order, the most common transcription factor binding sites were for FoxD3, Pax-4, Oct-1 and AP-1 for the treatment profiling, and FoxD3, Oct-1 and AP-1 for the fold-change gene lists (cf. Fig. S2 in supplemental material). AP-1, but not FoxD3, Pax-4, or Oct-1 was found to be differentially expressed between the surgical conditions. Two of the heterodimeric AP-1 binding partners, c-fos and fra-2, were lowest in the ‘Lesion’ hemisphere in the fold-change list (cf. Table 1). It is thus plausible that these two transcription factors play an important role in the regulation of the altered retrosplenial cortex response.
Both analyses yielded candidates underlying biological function changes, and we have no a priori reason to believe that the results of either type of analysis are the more important. Thus, in order to simplify the description of the data, the results of the fold-change and the treatment profiling analyses are integrated as they indicate many similar alterations in gene expression.
Evidence was found of widespread alterations in the expression of genes involved in a multitude of biological functions (cf. Fig. 4). These alterations are most likely chronic as acute recovery processes such as an increase in c-Fos protein are thought to peak 3-10 days after injury and return to baseline before one month (Nieto-Sampedro et al., 1982; Buytaert, 2001; Mingorance et al., 2005). In the present study the changes included potential differences in neuroendocrine activity (e.g. hsd11b1, RXRγ, brd8, and adcyap1), cell adhesion, growth, and reorganization (e.g. cyclinD2, klf5, lsamp, neuroD1, nptx2, reprimo ,actin alpha-1, cbln1, lsamp, map2, mmp9, mmp24, myosin Ie, myosin IXa, nelf, nefh, netrin1, netrin-g1a, neurexin1, neuritin1, plexinb2, scn1b and tuba4), as well as immune functions and inflammation (e.g. CD74, CD83, cyslt1, hla-dmb, LOC171412, masp1, ppib, RT1.B beta 1, RT1-Da, tore). The focus will be on gene expression changes reflecting energy metabolism and neuroplasticity, as these best address the goals of the experiment.
Figure 4.

Hierarchical pathway prediction for the Rgb de-regulation associated with the c-Fos production deficit. Representative microarray-derived Rgb genes were annotated into different functional classes, and grouped according to either molecular function (e.g. transcription factor c-Fos) or biological process (e.g. neurotransmission molecule Gabrd). This hierarchical organization of groups of genes affected by the lesion provides the basis for pathway predictions. Representative genes only are provided here in order to maintain clarity.
Left pathway: The transcription factor Fra-2 is phosphorylated and regulates expression of the RGS4 gene (D.A. Carter, unpublished work). RGS4 affects neurotransmission (via GTPase activation). Altered neurotransmission is manifested in altered LTD/P.
Right pathway: The transcription factor c-Fos is phosphorylated and can be sorted to the mitochondrial genome where it associates with mitochondrial DNA (Ogita et al, 2002). Altered mitochondrial function can affect synaptic plasticity (cf. text).
Energy production
Expression differences were found that suggest disturbances in blood, oxygen, and energetic activities (cf. Fig.5). The ‘Lesion’ hemisphere contained lower levels of genes associated with effective hemoglobin oxygen transport (hba1, urod) and glucose transport and metabolism (exoc7, ehd2, pank4; Ishiki and Klip, 2005; Yunfeng et al., 2005). Additionally, the higher expression of COX1/Ptgs1 after the lesion may be associated with this probable alteration in oxygenation and energy as this molecule is an important mediator of neurovascular coupling and vasodilation (e.g. Takano et al., 2006). Pervasive alterations were found in mitochondrial genes, which play an important role in oxidative phosphorylation and can affect the glutamine-glutamate cycle. Deficient metabolic function is suggested by the finding that mitochondrial transcripts exhibited altered expression patterns in all mitochondrial complexes, and were almost exclusively lower in the ‘Lesion’ condition (ndufv2, ndufa8, ndufb6, CoQ9, UCR/QCR9, cox6a, atp5o, atp6s14, mdh2, sdhc, but not cox6b, cf. Table 2 in supplemental material, and Fig. 5). GSEA replicated this finding as gene sets for the electron transport chain (False Discovery Rate, FDR=0.044) and oxidative phosphorylation (FDR=0.040, cf. supplemental material) were both found to be relatively enriched in the ‘Intact’ condition. In fact, these were the only enriched sets having a FDR lower than 0.05 in that condition.
Figure 5.

Schematic depiction of some pathways disrupted by the lesion, involving oxidative phosphorylation (all mitochondrial complexes I-V), the tricarboxylic acid cycle (TCA, Krebs cycle), glutamate-glutamine cycling, and glucose uptake and metabolism. Genes found altered in the current study and associated with these pathways are identified in red. Glu, glutamate; Gln, glutamine.
c-Fos and the AP-1 complex can translocate to the mitochondrion, and there are AP-1-like binding sequences in mouse mitochondrial DNA (Ogita et al., 2002; Ogita et al., 2003). Computational analyses of transcription factor binding sites for the genes altered in the current study identified potential AP-1 binding sites for a number of mitochondrial genes, including ndufv2, ndufa8, COQ9, atp6s14 and mdh2 (genes that were all reduced on the lesioned side). While plausible, the possibility that the deficit in c-fos expression may be directly linked to the mitochondrial deficits could not be tested in the present study.
Neuroplasticity
Genes found to be differentially regulated in this study have been shown to play a role in neuroplasticity. For example, the activity of certain transcripts that were found in lower abundance on the ‘Lesion’ side have been reported to be associated with long term potentiation [LTP, e.g. adcyap1 (Otto et al., 2001; Matsuyama et al., 2003), carbonic anhydrase 4 (White and Platt, 2001), mmp9 (Nagy et al., 2006), ncs-1 (Genin et al., 2001; Brackmann et al., 2004), neuritin1 (Wibrand et al., 2006), ppp1r1a (Allen et al., 2000)], or long term depression [LTD, e.g. cbln1 (Hirai et al., 2005), Nr4a1 (Lindecke et al., 2006), ppp1r1a (Mulkey et al., 1994; Morishita et al., 2001; Jouvenceau et al., 2006), Prkar1b (Brandon et al., 1995)]. In contrast, higher levels were found on the ‘Lesion’ side for nptx2, which is LTP-related (Wibrand et al., 2006), and RXRγ, a gene reported to be involved in LTD, but not LTP (Chiang et al., 1998).
Cell signaling
Cell signaling appears to be grossly affected by the lesion. The tissue in the ‘Intact’ cortex displayed greater quantities of transcripts associated with synaptic signaling (e.g. scamp1, syt5, napa, ap2m1, ncs-1, exoc7, lrp3, neurexin1, but lower for ehd2). Neuronal signaling from the anterior thalamic nuclei to the retrosplenial cortex relies on glutamatergic inputs (Gonzalo-Ruiz et al., 1997) and their interaction with GABA interneurons within the cortex (Ichinohe and Rockland, 2002). It is thus not surprising to find evidence of altered regulation of both neurotransmitters.
While no glutamate receptors were found to be differentially regulated, several transcripts suggest a disturbance in glutamatergic functions (cf. Fig. 5). An immediate-early effector gene, nptx2, reported to be involved in glutamate receptor clustering selectively on interneurons (O’Brien et al., 1999; Mi et al., 2002) was found in greater abundance on the ‘Lesion’ side, hinting at potentially more intense excitatory activity on these cells in this condition. Enzymes involved in the metabolism of glutamate itself and of molecules involved in glutamate functions were also affected by the anterior thalamic nuclei lesion, and likewise point an upregulation in glutamatergic activity. NMDA receptor antagonism leads to increases in glutamine synthetase and also in extended tricarboxylic acid cycling (Brenner et al., 2005). Accordingly, NMDA hyperactivity may be associated with a reduction in glutamine synthetase and in a decrease in tricarboxylic acid cycling. In the present experiment, the finding of a lower expression on the ‘Lesion’ side of gene transcripts for glutamine synthetase, malate dehydrogenase and succinate dehydrogenase is consistent with reduced activity of the tricarboxylic acid cycle, and a potential increase in NMDA agonism.
Relatively lower levels in the ‘Lesion’ hemisphere of glutamine synthetase, as well as glutaminase and asparagine synthetase suggest an alteration in glutamate metabolism and homeostasis. Glutamate is converted to glutamine by glutamine synthetase, a glial-specific enzyme (Norenberg and Martinez-Hernandez, 1979), and as such, the disparity between the surgical conditions may reflect differences in mechanisms of glutamate signaling and metabolism, including neuron-glia interaction (cf. Hertz and Zielke, 2004; Patel et al., 2005).
Evidence of perturbations in glutamate function also arises from apparent alterations in kynurenine metabolism. Transcripts for cyclooxygenase 1 (COX1/ptgs1) and kynurenine 3-monooxygenase (KMO), two enzymes associated with the metabolites of this pathway, were at relatively higher levels on the ‘Lesion’ side. The endpoints of kynurenine metabolism are kynurenic acid and quinolinic acid (Moroni et al., 1999). Kynurenic acid, a neuroprotective molecule (Carpenedo et al., 2002), and quinolinic acid are respectively antagonists and agonists of NMDA receptors. Reduced levels of KMO produce an increase in kynurenic acid (Carpenedo et al., 2002; Erhardt and Engberg, 2002). COX1 has been reported to be associated with NMDA activity and the modulation of kynurenic acid levels. NMDA activation increases levels of this enzyme (Pepicelli et al., 2005), and similarly, COX1 reduction increases kynurenic acid levels (Schwieler et al., 2005).
Finally, adenylate cyclase activating polypeptide 1 increases the re-uptake of glutamate by glia (Figiel and Engele, 2000). A lower level of adcyap1 on the ‘Lesion’ side could be associated with greater glutamatergic activity in this hemisphere. This observation and the evidence presented above converge to indicate a disturbance in glutamatergic signalling, potentially associated with an increase in NMDA activity in Rgb.
Transcripts for various other neurotransmitter receptors and enzymes, in addition to several sodium and potassium ion channels, appear to display robust, consistent differences between the surgical treatment conditions. Such changes were apparent for GABAergic signaling [e.g. gabrd and ubqln1 (a mediator of GABA receptor subunit composition, cf. Bedford et al., 2001)], and also adrenergic (adrb3, adrbk1) and serotonergic (HT2C). Transcripts for HT2C were lower on the ‘Lesion’ side, consistent with previous findings for 5HT1B, those for Adrb3 were relatively higher on the ‘Lesion’ side, opposite to findings for Adrb2 (van Groen et al., 1993).
QPCR validation of candidate genes
Figure 6 shows the total number of transcripts in a 2 μl volume, normalized to β-actin, for the mRNA of nine pre-selected genes. The QPCR results were highly consistent with the microarray results, strengthening confidence in the overall findings of the microarray analyses. All of the gene time point values, except for one (see below), revealed relative patterns of expression that were similar to those found by the microarray analyses (26 out of 27). The sole exception was zyxin at the 30 min time point (Fig. 6).
Figure 6.

QPCR confirmation of candidate genes selected from microarray results. The candidates were selected from the sets of genes derived from fold-change microarray analysis. (S = ‘Intact’; L = ‘Lesion’).
Experiment 2
In situ hybridization was used to validate the microarray data for one selected gene gabrd, which was reduced in the ‘Lesion’ hemisphere. This gene was chosen as GABA(A) activity is critical in regulating glutamatergic afferents to the cortex (e.g. Daw et al., 2007).
Results
The unilateral anterior thalamic lesions (n=10, largest and smallest depicted in Fig. 7a) were very similar to those described for Experiment 1, although there were on average very slightly larger. In Experiment 2, the lesions included most of the cells in the anterodorsal and anteroventral nuclei, while sparing some of the anteromedial nucleus. Cell loss was found in the most rostral portion of the laterodorsal nuclei (n = 5). There was also some restricted cell loss in the immediately adjacent parts of the dentate gyrus and CA3 regions in the cases with the largest lesions. Injection tracts passed through the fornix in all cases.
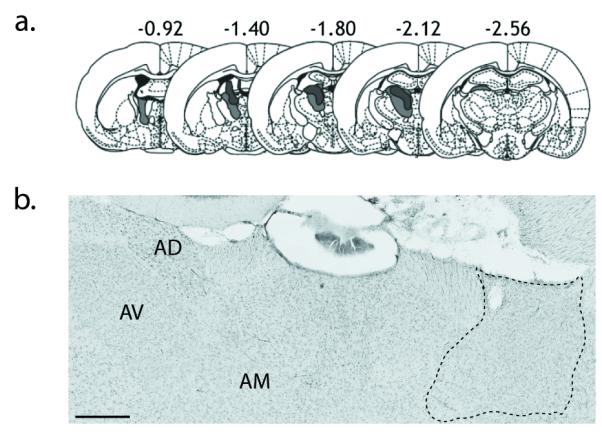
Figure 7.

a) The smallest and largest lesions are represented in dark and light grey, respectively. The plates, from left to right, represent the distances −0.92, −1.4, −1.8, − 2.12, and −2.56 mm from bregma. b) Photomicrograph of a Nissl-stained coronal section, contrasting the anterior thalamic nuclei in a normal hemisphere (left) and a lesioned hemisphere (right). The outline highlights the area of gliosis and cell loss. Note that the tissue was not perfused, hence the poor differentiation. AD, anterior dorsal thalamic nucleus; AM, anterior medial thalamic nucleus; AV anterior ventral thalamic nucleus. The scale bar represents 500 um. c) Anterior thalamic lesions reduced Rgb gabrd expression in a superficial (II) but not a deep (V) lamina. Error bars represent the standard error of the mean, but note that the comparisons are within-subject. *p<0.05. d) Photomicrographs (100×) of small dark silver grains associated with superficial Rgb laminae II in an ‘Intact’ (left) and ‘Lesion’ (right) hemisphere. The scale bar represents 10 μm.
Once more, there was no interhemispheric difference in counts of cresyl-stained material in Rgb after the unilateral thalamic lesions (data not shown). Although there was no overall effect of Surgical Treatment on for gabrd grain counts (F(1,6) = 0.23; p=0.65; Fig. 7c) there was a Lamina by Surgical Treatment interaction (F(1,6) = 10.69; p<0.05). Follow-up comparisons (Bonferroni adjusted) revealed significantly reduced gabrd grain counts in the superficial lamina (II) of the lesioned hemisphere (p<0.05), but there was no interhemispheric difference for lamina V (p=0.24).
Conclusions
The sensitivity of the retrosplenial cortex to damage in one of its key afferents, the anterior thalamic nuclei, extended to many functions, pervading cellular activities represented in the transcriptome.
The transcriptome changes were validated by successfully replicating several findings using a different technique, QPCR.
- Important groups of essential function exhibiting altered transcription patterns included:
- Energy and oxygenation;
- Neuroplasticity;
- Cell signaling, from synaptic to intracellular communication.
- Transcription factors that exhibited expression level changes were not restricted to c-Fos or AP-1 dimer members. These transcription factors could play an important role in mediating the particular retrosplenial cortex response to anterior thalamic nuclei lesions.
- Computational analyses revealed that AP-1 is one of the most common transcription factor binding sites on those genes affected by the lesion, and proved to be the most common transcription factor that was itself (via c-fos) also affected by the lesion. This situation can be contrasted with the transcription FOXD3, which exhibited the most numerous binding sites on those genes affected by the distal lesion, yet its own expression levels were not affected.
The greater sensitivity of the superficial laminae of the retrosplenial cortex to anterior thalamic lesions was reflected in a lamina-specific reduction of a specific GABA receptor subunit.
Discussion
Retrosplenial cortex dysfunction following lesions of the anterior thalamic nuclei was globally analyzed for the first time using microarray techniques. Specific goals were to determine the pervasiveness of any changes and to uncover potential mechanisms that could explain the metabolic hypoactivity and loss of neural plasticity seen in the retrosplenial cortex (van Groen et al., 1993; Garden et al., 2006). The lack of any evidence of neuronal-cell loss in the retrosplenial cortex following ipsilateral thalamic lesions confirmed the appropriateness of the microarray approach and the potential for ‘covert’ pathology. In addition to the biological replications, the microarray results were validated for specific genes using three other techniques (QPCR, in situ hybridization and immunohistochemistry), which all revealed very high concordance.
A general point should be made before considering the actual findings. Any disconnection of a brain site will presumably induce some mRNA changes in the target region. It was deliberately decided, however, not to try and contrast the retrosplenial cortex findings with microarray results from another region as each input will have unique properties, as will the target site itself (Vogt et al., 1981; van Groen et al., 1993). As a consequence, there is no natural ‘baseline’ comparison or control condition. For these reasons, the uniqueness of the reported retrosplenial mRNA changes cannot be ascertained without making multiple comparisons with numerous sites, but this is not practicable at present. At the same time it is known that the loss of other afferents to retrosplenial cortex (e.g. from the entorhinal cortex, postrhinal cortex, and laterodorsal thalamic nucleus) do not have marked effects on the two IEGs c-fos and zif268, strongly indicating that there is a unique relationship between the retrosplenial cortex and the anterior thalamic nuclei. The significance of the present study relates both to a) how the findings inform specific retrosplenial changes already linked to the distal effects of anterior thalamic lesions (e.g. whether any IEGs, in addition to c-Fos and Zif268, are affected by anterior thalamic lesions and how mRNA changes might help to explain the loss of LTD in retrosplenial cortex), and b) help to explain why retrosplenial dysfunction (typically hypoactivity) is observed in a wide array of neurological disorders.
As predicted (Jenkins et al., 2004), the IEG c-fos was hypoactive on the ‘Lesion’ side. This hypoactivity extended to other transcription factors (e.g. brd8, fra-2, klf5, nfat5, neuroD1, nfix, nr4a1, RXRγ, smad3, smarcc2, and zfp91), so providing a fuller picture of how pervasive the changes in cellular function might prove. Markers for energy metabolism were also strikingly affected, another key indicator of the functional status of the retrosplenial cortex cells after anterior thalamic lesions. Energy metabolism and synaptic activity are inter-related (Williams et al., 1998; Vaynman et al., 2006). Glutamate metabolism depends on astrocyte function (Hertz and Zielke, 2004), while synaptic plasticity and energy metabolism are coupled through neuron-astroglia interactions (Hyder et al., 2006). Numerous pathways involved in these exchanges appear to be affected by the lesion, as depicted in Fig. 5.
Cell signaling appears to be grossly affected by the surgical treatment. The results of the current study suggest the possibility that anterior thalamic nuclei lesions result in the promotion of some glutamatergic-related activity in Rgb. This change could be a combined result of the loss of glutamatergic inputs and the disinhibition of GABA regulation within the cortex. The latter may be mediated via the GABA(A) receptor delta subunit, important for tonic inhibition (Mody et al., 2001; Petrini et al., 2004), and for which the gene transcript gabrd was reduced in the lesioned hemisphere in both the microarray and the in situ hybridization studies.
GABAergic, serotonergic, adrenergic as well as potassium, sodium and calcium channel activity all appear to have been affected by the thalamic lesions. These effects are likely to produce functional changes in neuronal excitability and firing pattern modulation, and this is reflected in recent work (Garden et al., 2006) that evaluated the effect of anterior thalamic nuclei lesions on single unit recordings in retrosplenial cortex slices. Recordings were taken in retrosplenial cortex layer II neurons after stimulation in layer II or V. In unilateral lesion preparations, LTD could be induced in layers II and V of the ‘Intact’ cortex but not in layer II in the ‘Lesion’ hemisphere (Garden et al., 2006). This selective lack of plasticity in the superficial layers in the retrosplenial cortex after anterior thalamic lesions accords both with the only mRNA data looking at different cortical lamina i.e. the changes in gabrd transcripts (Exp. 2), and with the previously described superficial reductions of c-Fos and Zif268 proteins after lesions of the anterior thalamic nuclei (Jenkins et al., 2004).
The dendrites of the NMDA-dependent layer II-III Rgb interneurons (Li et al., 2002) are physically associated with those of cells receiving anterior thalamic projections (Ichinohe and Rockland, 2002). The anterior thalamic lesion may result in disruption of the Rgb intrinsic and extrinsic inhibitory/excitatory balance. Like interneuron activity, clustering of delta-subunit containing GABA(A) receptors regulates excitatory signal integration (Mody et al., 2001; Petrini et al., 2004). Together, these changes may reflect altered cortical feed-forward inhibition, producing deficient excitatory input summation and poor spike generation (Daw et al., 2007), contributing to the observed Rgb energy hypometabolism, in addition to potentially deficient energy functions (cf. Fig. 5 for inter-related energy and neuronal activity functions).
The apparent reduction in retrosplenial cortex mitochondrial activity is of potential relevance to Alzheimer’s disease. In the earliest stages of Alzheimer’s disease, the anterior dorsal nucleus of the thalamus and the entorhinal cortex are among the few regions displaying structural changes (Braak and Braak, 1991b). These regions may be preceded by transentorhinal pathology, which coincides with a “clinically silent” phase, according to the staging by Braak and Braak (1991b). Both the entorhinal cortex and the anterodorsal thalamic nucleus are connected to the retrosplenial cortex, the latter with particularly dense connections (Insausti et al., 1997; van Groen and Wyss, 2003). Furthermore, the anterior thalamic nuclei are one of the few regions that exhibit hypoperfusion in patients that convert to Alzheimer’s disease (Johnson et al., 1998).
Interestingly, the progression of Alzheimer’s disease exhibits a discrepancy in retrosplenial cortex between the time-course of overt pathology and metabolic disturbance (e.g. Matsuda et al., 2002). While the retrosplenial area does not typically exhibit overt pathology in early Alzheimer’s disease, the same region displays hypometabolism from the earliest stages of the disease. The severity of the memory loss is correlated with posterior cingulate hypometabolism but not with medial temporal lobe hypometabolism (Salmon et al., 2000; Matsuda et al., 2002).
The memory loss in Alzheimer’s disease is, however, correlated with atrophy in the medial temporal lobe but not in the posterior cingulate cortex (Baron et al., 2001; Chételat et al., 2002; Chételat et al., 2003). Clinical studies, as well as animal experiments, have led to the suggestion that hypometabolism in adults with dementia of the Alzheimer type may be the result of neuroanatomical disconnection (e.g. Fazio et al., 1992; Meguro et al., 1999; Aupée et al., 2001). Studies into the importance of the anterior thalamic nuclei for human memory (Aggleton and Brown, 1999) and studies into the impact of selective anterior thalamic lesions in rodents (Jenkins et al, 2004) not only provide support for this disconnection explanation but also point to the key role of the anterior thalamic nuclei. The present findings add considerable weight to this view as they reveal potential mechanisms underlying some of these effects.
There is some evidence that, just as hypometabolism precedes detectable structural changes in Alzheimer’s disease, so does a reduction in synaptic efficacy (Ho et al., 2001; Small et al., 2001; Selkoe et al., 2002; Yao, 2003). Interestingly, the effect in rats of anterior thalamic lesions on retrosplenial cortex IEG activation, which occurs soon after surgery, is both long-lasting and constant (from 1 week to ~10 months). The loss of IEGs is especially dramatic in the superficial laminae of the retrosplenial cortex (Jenkins et al., 2004; Poirier et al., 2005). This is of particular relevance as in Alzheimer’s disease the superficial layers of posterior cingulate cortex exhibit severely reduced levels of cytochrome oxidase (Valla et al., 2001). Furthermore, beta-amyloid infusions into the anterior thalamic nuclei produce Rgb GABA reductions (Gonzalo-Ruiz, 1999). This final result is notable given the gabrd reductions found in the present study after the selective thalamic lesions.
Several other genes for which expression patterns appear to have been altered and which may be associated with the retrosplenial cortex dysfunction have known associations with processes related to Alzheimer’s disease. These include mmp9, chgB, and Hsd11b1 (Marcus et al. 1998; Lorenzl et al. 2003; Marksteiner et al. 2000; de Quervain et al. 2004). Some of the transcripts found to be differentially expressed are presenilin ligands (e.g. ubqln1, NCS-1), ApoE ligands (e.g. LRP3), or ApoB processors (APOBEC1). Alterations were also found in transcripts having known associations with Lewy bodies (ubqln1, nefh). Metals have been found to be differentially regulated in neurodegenerative disorders (Roloff and Platt, 1999), and pank4, lower in the ‘Lesion’ hemisphere, is an isoform of pantothenate kinases, which play a role in iron deposition and neurodegeneration (Thomas and Jankovic, 2004). Meanwhile, levels of the metal selenium were reported to be reduced in the temporal lobe of persons with Alzheimer’s disease (Wenstrup et al., 1990), and the selenoprotein M (selm) gene has also been found to be expressed at lower levels in mice over-expressing human presenilin-2 in comparison to their wild-type littermates (Hwang et al., 2005). selm was lower in the ‘Lesion’ hemisphere in the current study, and selenium deficits can augment the effects of glutamate overactivity (Savaskan et al., 2003).
In summary, tissue that appears normal when examined with standard histological methods reveals evidence of widespread alterations, including hypoactivity, even though it is distal to the site of overt pathology. These findings mirror reports of posterior cingulate hypometabolism following thalamic atrophy in amnesic patients, again suggestive of alterations in regions distal to those exhibiting overt pathology (e.g. Fazio et al., 1992; Reed et al., 1999; Chételat et al., 2003). Our results also address the controversy over the existence and functional relevance of “covert” pathology (Bachevalier and Meunier, 1996; Squire and Zola, 1996). The widespread transcriptional abnormalities lend further support for the notion that the retrosplenial cortex is responsible for cognitive deficits even though its apparently intact appearance has led it to be largely ignored in these conditions. The present study provides candidate genes and, thereby, mechanisms involved in the retrosplenial dysregulation, and hence a better characterization of the susceptibility of the retrosplenial cortex to distal damage. These results further our understanding of the effects of insults to the brain and reinforce the view that we increasingly need to consider the contributions from regions without overt pathology.
Supplementary Material
Acknowledgements
We thank Prof. Zafir I. Bashir and Prof. Malcolm W. Brown for their assistance. This research was funded by the Medical Research Council (UK, G9713086 to J.P.A).
REFERENCES
- Aggleton JP, Sahgal A. The contribution of the anterior thalamic nuclei to anterograde amnesia. Neuropsychologia. 1993;31:1001–1019. doi: 10.1016/0028-3932(93)90029-y. [DOI] [PubMed] [Google Scholar]
- Aggleton JP, Brown MW. Episodic memory, amnesia, and the hippocampal-anterior thalamic axis. Behavioral and Brain Sciences. 1999;22:425–444. [PubMed] [Google Scholar]
- Allen PB, Hvalby O, Jensen V, Errington ML, Ramsay M, Chaudhry FA, Bliss TVP, Storm-Mathisen J, Morris RGM, Andersen P, Greengard P. Protein phosphatase-1 regulation in the induction of long-term potentiation: Heterogeneous molecular mechanisms. Journal of Neuroscience. 2000;20:3537–3543. doi: 10.1523/JNEUROSCI.20-10-03537.2000. [DOI] [PMC free article] [PubMed] [Google Scholar]
- Altschul SF, Madden TL, Schaffer AA, Zhang J, Zhang Z, Miller W, Lipman DJ. Gapped BLAST and PSI-BLAST: a new generation of protein database search programs. Nucleic Acids Research. 1997;25:3389–3402. doi: 10.1093/nar/25.17.3389. [DOI] [PMC free article] [PubMed] [Google Scholar]
- Archer JS, Abbott DF, Waites AB, Jackson GD. fMRI “deactivation” of the posterior cingulate during generalized spike and wave. NeuroImage. 2003;20:1915–1922. doi: 10.1016/s1053-8119(03)00294-5. [DOI] [PubMed] [Google Scholar]
- Aupée AM, Desgranges B, Eustache F, Lalevée C, de la Sayette V, Viader F, Baron JC. Voxel-based mapping of brain hypometabolism in permanent amnesia with PET. NeuroImage. 2001;13:1164–1173. doi: 10.1006/nimg.2001.0762. [DOI] [PubMed] [Google Scholar]
- Bachevalier J, Meunier M. Cerebral ischemia: are the memory deficits associated with hippocampal cell loss? Hippocampus. 1996;6:553–560. doi: 10.1002/(SICI)1098-1063(1996)6:5<553::AID-HIPO8>3.0.CO;2-J. [DOI] [PubMed] [Google Scholar]
- Baron JC, Chételat G, Desgranges B, Perchey G, Landeau B, de la Sayette V, Eustache F. In vivo mapping of gray matter loss with voxel-based morphometry in mild Alzheimer’s disease. Neuroimage. 2001;14:298–309. doi: 10.1006/nimg.2001.0848. [DOI] [PubMed] [Google Scholar]
- Bedford FK, Kittler JT, Muller E, Thomas P, Uren JM, Merlo D, Wisden W, Triller A, Smart TG, Moss SJ. GABAA receptor cell surface number and subunit stability are regulated by the ubiquitin-like protein Plic-1. Nature Neuroscience. 2001;4:908–916. doi: 10.1038/nn0901-908. [DOI] [PubMed] [Google Scholar]
- Benjamini Y, Hochberg Y. Controlling the false discovery rate: A practical and powerful approach to multiple testing. Journal of the Royal Statistical Society: Series B. 1995;57:289–300. [Google Scholar]
- Braak H, Braak E. Alzheimer’s disease affects limbic nuclei of the thalamus. Acta Neuropathoogica. 1991a;81:261–268. doi: 10.1007/BF00305867. [DOI] [PubMed] [Google Scholar]
- Braak H, Braak E. Neuropathological stageing of Alzheimer-related changes. Acta Neuropathoogica. 1991b;82:239–259. doi: 10.1007/BF00308809. [DOI] [PubMed] [Google Scholar]
- Brackmann M, Zhao C, Kuhl D, Manahan-Vaughan D, Braunewell K-H. MGluRs regulate the expression of neuronal calcium sensor proteins NCS-1 and VILIP-1 and the immediate early gene arg3.1/arc in the hippocampus in vivo. Biochemical and Biophysical Research Communications. 2004;322:1073–1079. doi: 10.1016/j.bbrc.2004.08.028. [DOI] [PubMed] [Google Scholar]
- Brandon EP, Zhuo M, Huang Y, Qi M, Gerhold KA, Burton KA, Kandel ER, McKnight GS, Idzerda RL. Hippocampal long-term depression and depotentiation are defective in mice carrying a targeted disruption of the gene encoding the RIß subunit of cAMP-dependent protein kinase. Proceedings of the National Academy of Sciences of the United States of America. 1995;92:8851–8855. doi: 10.1073/pnas.92.19.8851. [DOI] [PMC free article] [PubMed] [Google Scholar]
- Brenner E, Kondziella D, Haberg A, Sonnewald U. Impaired glutamine metabolism in NMDA receptor hypofunction induced by MK801. Journal of Neurochemistry. 2005;94:1594–1603. doi: 10.1111/j.1471-4159.2005.03311.x. [DOI] [PubMed] [Google Scholar]
- Buytaert KA, Kline AE, Montanez S, Likler E, Millar CJ, Hernandez TD. The temporal patterns of c-Fos and basic fibroblast growth factor expression following a unilateral anteromedial cortex lesion. Brain Research. 2001;894:121–130. doi: 10.1016/s0006-8993(01)01987-4. [DOI] [PubMed] [Google Scholar]
- Carpenedo R, Meli E, Peruginelli F, Pellegrini-Giampietro DE, Moroni F. Kynurenine 3-mono-oxygenase inhibitors attenuate post-ischemic neuronal death in organotypic hippocampal slice cultures. Journal of Neurochemistry. 2002;82:1465–1471. doi: 10.1046/j.1471-4159.2002.01090.x. [DOI] [PubMed] [Google Scholar]
- Cavallaro S, D’Agata V, Manickam P, Dufour F, Alkon DL. Memory-specific temporal profiles of gene expression in the hippocampus. Proceedings of the National Academy of Sciences of the United States of America. 2002;99:16279–16284. doi: 10.1073/pnas.242597199. [DOI] [PMC free article] [PubMed] [Google Scholar]
- Chételat G, Desgranges B, De La Sayette V, Viader F, Eustache F, Baron JC. Mapping gray matter loss with voxel-based morphometry in mild cognitive impairment. Neuroreport. 2002;13:1939–1943. doi: 10.1097/00001756-200210280-00022. [DOI] [PubMed] [Google Scholar]
- Chételat G, Desgranges B, de la Sayette V, Viader F, Berkouk K, Landeau B, Lalevee C, Le Doze F, Dupuy B, Hannequin D, Baron J-C, Eustache F. Dissociating atrophy and hypometabolism impact on episodic memory in mild cognitive impairment. Brain. 2003;126:1955–1967. doi: 10.1093/brain/awg196. [DOI] [PubMed] [Google Scholar]
- Chiang M-Y, Misner D, Kempermann G, Schikorski T, Giguere V, Sucov HM, Gage FH, Stevens CF, Evans RM. An essential role for retinoid receptors RARβ and RXRγ in long-term potentiation and depression. Neuron. 1998;21:1353–1361. doi: 10.1016/s0896-6273(00)80654-6. [DOI] [PubMed] [Google Scholar]
- Chomczynski P, Sacchi N. Single-step method of RNA isolation by acid guanidinium thiocyanate-phenol-chloroform extraction. Analytical Biochemistry. 1987;162:156–159. doi: 10.1006/abio.1987.9999. [DOI] [PubMed] [Google Scholar]
- Daw MI, Ashby MC, Isaac JTR. Coordinated developmental recruitment of latent fast spiking interneurons in layer IV barrel cortex. Nature Neuroscience. 2007;10:453–461. doi: 10.1038/nn1866. [DOI] [PubMed] [Google Scholar]
- Desgranges B, Baron J-C, Lalevée C, Giffard B, Viader F, de la Sayette V, Eustache F. The neural substrates of episodic memory impairment in Alzheimer’s disease as revealed by FDG-PET: relationship to degree of deterioration. Brain. 2002;125:1116–1124. doi: 10.1093/brain/awf097. [DOI] [PubMed] [Google Scholar]
- Drzezga A, Lautenschlager N, Siebner H, Riemenschneider M, Willoch F, Minoshima S, Schwaiger M, Kurz A. Cerebral metabolic changes accompanying conversion of mild cognitive impairment into Alzheimer’s disease: a PET follow-up study. EuropeanJjournal of Nuclear Medicine and Molecular Imaging. 2003;30:1104–1113. doi: 10.1007/s00259-003-1194-1. [DOI] [PubMed] [Google Scholar]
- Erhardt S, Engberg G. Increased phasic activity of dopaminergic neurones in the rat ventral tegmental area following pharmacologically elevated levels of endogenous kynurenic acid. Acta Physiologica Scandinavica. 2002;175:45–53. doi: 10.1046/j.1365-201X.2002.00962.x. [DOI] [PubMed] [Google Scholar]
- Fazio F, Perani D, Gilardi MC, Colombo F, Cappa SF, Vallar G, Bettinardi V, Paulesu E, Alberoni M, Bressi S, Franceschi M, Lenzi GL. Metabolic impairment in human amnesia: a PET study of memory networks. Journal of Cerebral Blood Flow and Metabolism. 1992;12:353–358. doi: 10.1038/jcbfm.1992.52. [DOI] [PubMed] [Google Scholar]
- Figiel M, Engele J. Pituitary adenylate cyclase-activating polypeptide (PACAP), a neuron-derived peptide regulating glial glutamate transport and metabolism. Journal of Neuroscience. 2000;20:3596–3605. doi: 10.1523/JNEUROSCI.20-10-03596.2000. [DOI] [PMC free article] [PubMed] [Google Scholar]
- Garden DLF, Warburton EC, Barker GRI, Aggleton JP, Brown MW, Bashir ZI. A role for anterior thalamic nuclei in determining synaptic plasticity in retrosplenial cortex. FENS Abstracts. 2006;vol. 3:A120.6. [Google Scholar]
- Genin A, Davis S, Meziane H, Doyere V, Jeromin A, Roder J, Mallet J, Laroche S. Regulated expression of the neuronal calcium sensor-1 gene during long-term potentiation in the dentate gyrus in vivo. Neuroscience. 2001;106:571–577. doi: 10.1016/s0306-4522(01)00301-3. [DOI] [PubMed] [Google Scholar]
- Giles PJ, Kipling D. Normality of oligonucleotide microarray data and implications for parametric statistical analyses. Bioinformatics. 2003;19:2254–2262. doi: 10.1093/bioinformatics/btg311. [DOI] [PubMed] [Google Scholar]
- Gonzalo-Ruiz A. Alteraciones en los sistemas de neurotransmisión tras inyectar la proteína beta-amiloide ß(12-28) en el hipotálamo y en el tálamo anterior de la rata. Revista de Neurología. 1999;28:931–941. [PubMed] [Google Scholar]
- Gonzalo-Ruiz A, Sanz JM, Morte L, Lieberman AR. Glutamate and aspartate immunoreactivity in the reciprocal projections between the anterior thalamic nuclei and the retrosplenial granular cortex in the rat. Brain Research Bulletin. 1997;42:309–321. doi: 10.1016/s0361-9230(96)00291-2. [DOI] [PubMed] [Google Scholar]
- Harding A, Halliday G, Caine D, Kril J. Degeneration of anterior thalamic nuclei differentiates alcoholics with amnesia. Brain. 2000;123:141–154. doi: 10.1093/brain/123.1.141. [DOI] [PubMed] [Google Scholar]
- Hertz L, Zielke HR. Astrocytic control of glutamatergic activity: astrocytes as stars of the show. Trends in Neuroscience. 2004;27:735–743. doi: 10.1016/j.tins.2004.10.008. [DOI] [PubMed] [Google Scholar]
- Hirai H, Pang Z, Bao D, Miyazaki T, Li L, Miura E, Parris J, Rong Y, Watanabe M, Yuzaki M, Morgan JI. Cbln1 is essential for synaptic integrity and plasticity in the cerebellum. Nature Neuroscience. 2005;8:1534–1541. doi: 10.1038/nn1576. [DOI] [PubMed] [Google Scholar]
- Ho L, Guo Y, Spielman L, Petrescu O, Haroutunian V, Purohit D, Czernik A, Yemul S, Aisen PS, Mohs R, Pasinetti GM. Altered expression of a-type but not b-type synapsin isoform in the brain of patients at high risk for Alzheimer’s disease assessed by DNA microarray technique. Neuroscience Letters. 2001;298:191–194. doi: 10.1016/s0304-3940(00)01753-5. [DOI] [PubMed] [Google Scholar]
- Holter JL, Humphries A, Crunelli V, Carter DA. Optimisation of methods for selecting candidate genes from cDNA array screens: application to rat brain punches and pineal. Journal of Neuroscience Methods. 2001;112:173–184. doi: 10.1016/s0165-0270(01)00466-6. [DOI] [PubMed] [Google Scholar]
- Hong SJ, Li H, Becker KG, Dawson VL, Dawson TM. Identification and analysis of plasticity-induced late-response genes. Proceedings of the National Academy of Sciences of the United States of America. 2004;101:2145–2150. doi: 10.1073/pnas.0305170101. [DOI] [PMC free article] [PubMed] [Google Scholar]
- Humphries A, Klein D, Baler R, Carter DA. cDNA array analysis of pineal gene expression reveals circadian rhythmicity of the dominant negative helix-loop-helix protein-encoding gene, Id-1. Journal of Neuroendocrinology. 2002;14:101–108. doi: 10.1046/j.0007-1331.2001.00738.x. [DOI] [PubMed] [Google Scholar]
- Hwang DY, Cho JS, Oh JH, Shim SB, Jee SW, Lee SH, Seo SJ, Lee S-K, Lee SH, Kim YK. Differentially expressed genes in transgenic mice carrying human mutant presenilin-2 (N141I): Correlation of selenoprotein M with Alzheimer’s disease. Neurochemical Research. 2005;30:1009–1019. doi: 10.1007/s11064-005-6787-6. [DOI] [PubMed] [Google Scholar]
- Hyder F, Patel AB, Gjedde A, Rothman DL, Behar KL, Shulman RG. Neuronal-glial glucose oxidation and glutamatergic-GABAergic function. Journal of Cerebral Blood Flow and Metabolism. 2006;26:865–877. doi: 10.1038/sj.jcbfm.9600263. [DOI] [PubMed] [Google Scholar]
- Ichinohe N, Rockland KS. Parvalbumin positive dendrites co-localize with apical dendritic bundles in rat retrosplenial cortex. Neuroreport. 2002;13:757–761. doi: 10.1097/00001756-200205070-00005. [DOI] [PubMed] [Google Scholar]
- Insausti R, Herrero MT, Witter MP. Entorhinal cortex of the rat: Cytoarchitectonic subdivisions and the origin and distribution of cortical efferents. Hippocampus. 1997;7:146–183. doi: 10.1002/(SICI)1098-1063(1997)7:2<146::AID-HIPO4>3.0.CO;2-L. [DOI] [PubMed] [Google Scholar]
- Ishiki M, Klip A. Minireview: Recent developments in the regulation of glucose transporter-4 traffic: New signals, locations, and partners. Endocrinology. 2005;146:5071–5078. doi: 10.1210/en.2005-0850. [DOI] [PubMed] [Google Scholar]
- Jenkins TA, Vann SD, Amin E, Aggleton JP. Anterior thalamic lesions stop immediate early gene activation in selective laminae of the retrosplenial cortex: evidence of covert pathology in rats? European Journal of Neuroscience. 2004;19:3291–3304. doi: 10.1111/j.0953-816X.2004.03421.x. [DOI] [PubMed] [Google Scholar]
- Johnson KA, Jones K, Holman BL, Becker JA, Spiers PA, Satlin A, Albert MS. Preclinical prediction of Alzheimer’s disease using SPECT. Neurology. 1998;50:1563–1571. doi: 10.1212/wnl.50.6.1563. [DOI] [PubMed] [Google Scholar]
- Jouvenceau A, Hedou G, Potier B, Kollen M, Dutar P, Mansuy IM. Partial inhibition of PP1 alters bidirectional synaptic plasticity in the hippocampus. European Journal of Neuroscience. 2006;24:564–572. doi: 10.1111/j.1460-9568.2006.04938.x. [DOI] [PubMed] [Google Scholar]
- Kel AE, Gossling E, Reuter I, Cheremushkin E, Kel-Margoulis OV, Wingender E. MATCH™: a tool for searching transcription factor binding sites in DNA sequences. Nucleic Acids Research. 2003;31:3576–3579. doi: 10.1093/nar/gkg585. [DOI] [PMC free article] [PubMed] [Google Scholar]
- Kogure D, Matsuda H, Ohnishi T, Asada T, Uno M, Kunihiro T, Nakano S, Takasaki M. Longitudinal evaluation of early Alzheimer’s disease using brain perfusion SPECT. Journal of Nuclear Medicine. 2000;41:1155–1162. [PubMed] [Google Scholar]
- Krausz Y, Freedman N, Lester H, Newman JP, Barkai G, Bocher M, Chisin R, Bonne O. Regional cerebral blood flow in patients with mild hypothyroidism. Journal of Nuclear Medicine. 2004;45:1712–1715. [PubMed] [Google Scholar]
- Laurens KR, Kiehl KA, Ngan ETC, Liddle PF. Attention orienting dysfunction during salient novel stimulus processing in schizophrenia. Schizophrenia Research. 2005;75:159–171. doi: 10.1016/j.schres.2004.12.010. [DOI] [PubMed] [Google Scholar]
- Li Q, Clark S, Lewis DV, Wilson WA. NMDA receptor antagonists disinhibit rat posterior cingulate and retrosplenial cortices: A potential mechanism of neurotoxicity. Journal of Neuroscience. 2002;22:3070–3080. doi: 10.1523/JNEUROSCI.22-08-03070.2002. [DOI] [PMC free article] [PubMed] [Google Scholar]
- Lindecke A, Korte M, Zagrebelsky M, Horejschi V, Elvers M, Widera D, Prullage M, Pfeiffer J, Kaltschmidt B, Kaltschmidt C. Long-term depression activates transcription of immediate early transcription factor genes: involvement of serum response factor/Elk-1. European Journal of Neuroscience. 2006;24:555–563. doi: 10.1111/j.1460-9568.2006.04909.x. [DOI] [PubMed] [Google Scholar]
- Maguire E. The retrosplenial contribution to human navigation: A review of lesion and neuroimaging findings. ScandinavianJjournal of Psychology. 2001;42:225–238. doi: 10.1111/1467-9450.00233. [DOI] [PubMed] [Google Scholar]
- Martinez-Bisbal MC, Arana E, Marti-Bonmati L, Molla E, Celda B. Cognitive impairment: classification by 1H magnetic resonance spectroscopy. European Journal of Neurology. 2004;11:187–193. doi: 10.1046/j.1468-1331.2003.00746.x. [DOI] [PubMed] [Google Scholar]
- Masliah E, Terry R, Buzsaki G. Thalamic nuclei in Alzheimer disease: evidence against the cholinergic hypothesis of plaque formation. Brain Research. 1989;493:240–246. doi: 10.1016/0006-8993(89)91159-1. [DOI] [PubMed] [Google Scholar]
- Matsuda H, Kitayama N, Ohnishi T, Asada T, Nakano S, Sakamoto S, Imabayashi E, Katoh A. Longitudinal evaluation of both morphologic and functional changes in the same individuals with Alzheimer’s disease. Journal of Nuclear Medicine. 2002;43:304–311. [PubMed] [Google Scholar]
- Matsuyama SCA, Matsumoto A, Hashimoto H, Shintani N, Baba A. Impaired long-term potentiation in vivo in the dentate gyrus of pituitary adenylate cyclase-activating polypeptide (PACAP) or PACAP type 1 receptor-mutant mice. Neuroreport. 2003;14:2095–2098. doi: 10.1097/00001756-200311140-00017. [DOI] [PubMed] [Google Scholar]
- Meguro K, Blaizot X, Kondoh Y, Le Mestric C, Baron JC, Chavoix C. Neocortical and hippocampal glucose hypometabolism following neurotoxic lesions of the entorhinal and perirhinal cortices in the non-human primate as shown by PET: Implications for Alzheimer’s disease. Brain. 1999;122:1519–1531. doi: 10.1093/brain/122.8.1519. [DOI] [PubMed] [Google Scholar]
- Mi R, Tang X, Sutter R, Xu D, Worley P, O’Brien RJ. Differing mechanisms for glutamate receptor aggregation on dendritic spines and shafts in cultured hippocampal neurons. Journal of Neuroscience. 2002;22:7606–7616. doi: 10.1523/JNEUROSCI.22-17-07606.2002. [DOI] [PMC free article] [PubMed] [Google Scholar]
- Mingorance A, Fontana X, Soriano E, del Rio JA. Overexpression of myelin-associated glycoprotein after axotomy of the perforant pathway. Molecular and Cellular Neurosciences. 2005;29:471–483. doi: 10.1016/j.mcn.2005.03.016. [DOI] [PubMed] [Google Scholar]
- Minoshima SG Bruno, Berent Stanley, Frey Kirk A., Foster Norman L., Kuhl David E. Metabolic reduction in the posterior cingulate cortex in very early Alzheimer’s disease. Annals of Neurology. 1997;42:85–94. doi: 10.1002/ana.410420114. [DOI] [PubMed] [Google Scholar]
- Mitelman SA, Shihabuddin L, Brickman AM, Hazlett EA, Buchsbaum MS. MRI assessment of gray and white matter distribution in Brodmann’s areas of the cortex in patients with schizophrenia with good and poor outcomes. American Journal of Psychiatry. 2003;160:2154–2168. doi: 10.1176/appi.ajp.160.12.2154. [DOI] [PubMed] [Google Scholar]
- Mody I. Distinguishing between GABA(A) receptors responsible for tonic and phasic conductances. Neurochemical Research. 2001;26:907–913. doi: 10.1023/a:1012376215967. [DOI] [PubMed] [Google Scholar]
- Morishita W, Connor JH, Xia H, Quinlan EM, Shenolikar S, Malenka RC. Regulation of synaptic strength by protein phosphatase 1. Neuron. 2001;32:1133–1148. doi: 10.1016/s0896-6273(01)00554-2. [DOI] [PubMed] [Google Scholar]
- Moroni F. Tryptophan metabolism and brain function: focus on kynurenine and other indole metabolites. European Journal of Pharmacology. 1999;375:87–100. doi: 10.1016/s0014-2999(99)00196-x. [DOI] [PubMed] [Google Scholar]
- Mulkey RM, Endo S, Shenolikar S, Malenka RC. Involvement of a calcineurin/inhibitor-1 phosphatase cascade in hippocampal long-term depression. Nature. 1994;369:486–488. doi: 10.1038/369486a0. [DOI] [PubMed] [Google Scholar]
- Murphy D. Gene expression studies using microarrays: Principles, problems, and prospects. Advances in Physiology Education. 2002;26:256–270. doi: 10.1152/advan.00043.2002. [DOI] [PubMed] [Google Scholar]
- Nagy V, Bozdagi O, Matynia A, Balcerzyk M, Okulski P, Dzwonek J, Costa RM, Silva AJ, Kaczmarek L, Huntley GW. Matrix metalloproteinase-9 is required for hippocampal late-phase long-term potentiation and memory. Journal of Neuroscience. 2006;26:1923–1934. doi: 10.1523/JNEUROSCI.4359-05.2006. [DOI] [PMC free article] [PubMed] [Google Scholar]
- Nestor PJ, Fryer TD, Ikeda M, Hodges JR. Retrosplenial cortex (BA 29/30) hypometabolism in mild cognitive impairment (prodromal Alzheimer’s disease) European Journal of Neuroscience. 2003a;18:2663–2667. doi: 10.1046/j.1460-9568.2003.02999.x. [DOI] [PubMed] [Google Scholar]
- Nestor PJ, Fryer TD, Smielewski P, Hodges JR. Limbic hypometabolism in Alzheimer’s disease and mild cognitive impairment. Annals of Neurology. 2003b;54:343–351. doi: 10.1002/ana.10669. [DOI] [PubMed] [Google Scholar]
- Newell KA, Zavitsanou K, Huang X-FCA. Ionotropic glutamate receptor binding in the posterior cingulate cortex in schizophrenia patients. Neuroreport. 2005;16:1363–1367. doi: 10.1097/01.wnr.0000174056.11403.71. [DOI] [PubMed] [Google Scholar]
- Nieto-Sampedro M, Lewis ER, Cotman CW, Manthorpe M, Skaper SD, Barbin G, Longo FM, Varon S. Brain injury causes a time-dependent increase in neuronotrophic activity at the lesion site. Science. 1982;217:860–861. doi: 10.1126/science.7100931. [DOI] [PubMed] [Google Scholar]
- Norenberg MD, Martinez-Hernandez A. Fine structural localization of glutamine synthetase in astrocytes of rat brain. Brain Research. 1979;161:303–310. doi: 10.1016/0006-8993(79)90071-4. [DOI] [PubMed] [Google Scholar]
- O’Brien RJ, Xu D, Petralia RS, Steward O, Huganir RL, Worley P. Synaptic clustering of AMPA receptors by the extracellular immediate-early gene product Narp. Neuron. 1999;23:309–323. doi: 10.1016/s0896-6273(00)80782-5. [DOI] [PubMed] [Google Scholar]
- Ogita K, Fujinami Y, Kitano M, Yoneda Y. Transcription factor activator protein-1 expressed by kainate treatment can bind to the non-coding region of mitochondrial genome in murine hippocampus. Journal of Neuroscience Research. 2003;73:794–802. doi: 10.1002/jnr.10720. [DOI] [PubMed] [Google Scholar]
- Ogita K, Okuda H, Kitano M, Fujinami Y, Ozaki K, Yoneda Y. Localization of Activator Protein-1 complex with DNA binding activity in mitochondria of murine brain after in vivo treatment with kainate. Journal of Neuroscience. 2002;22:2561–2570. doi: 10.1523/JNEUROSCI.22-07-02561.2002. [DOI] [PMC free article] [PubMed] [Google Scholar]
- Otto C, Kovalchuk Y, Wolfer DP, Gass P, Martin M, Zuschratter W, Grone HJ, Kellendonk C, Tronche F, Maldonado R, Lipp H-P, Konnerth A, Schutz G. Impairment of mossy fiber long-term potentiation and associative learning in pituitary adenylate cyclase activating polypeptide type I receptor-deficient mice. Journal of Neuroscience. 2001;21:5520–5527. doi: 10.1523/JNEUROSCI.21-15-05520.2001. [DOI] [PMC free article] [PubMed] [Google Scholar]
- Patel AB, de Graaf RA, Mason GF, Rothman DL, Shulman RG, Behar KL. The contribution of GABA to glutamate/glutamine cycling and energy metabolism in the rat cortex in vivo. Proceedings of the National Academy of Sciences of the United States of America. 2005;102:5588–5593. doi: 10.1073/pnas.0501703102. [DOI] [PMC free article] [PubMed] [Google Scholar]
- Pavlidis P. Using ANOVA for gene selection from microarray studies of the nervous system. Methods. 2003;31:282–289. doi: 10.1016/s1046-2023(03)00157-9. [DOI] [PubMed] [Google Scholar]
- Paxinos G, Watson C. The Rat Brain in Stereotaxic Coordinates. Academic Press; 1997. [DOI] [PubMed] [Google Scholar]
- Pepicelli O, Fedele E, Berardi M, Raiteri M, Levi G, Greco A, Ajmone-Cat MA, Minghetti L. Cyclo-oxygenase-1 and -2 differently contribute to prostaglandin E2 synthesis and lipid peroxidation after in vivo activation of N-methyl-d-aspartate receptors in rat hippocampus. Journal of Neurochemistry. 2005;93:1561–1567. doi: 10.1111/j.1471-4159.2005.03150.x. [DOI] [PubMed] [Google Scholar]
- Petrini EM, Marchionni I, Zacchi P, Sieghart W, Cherubini E. Clustering of extrasynaptic GABAA receptors modulates tonic inhibition in cultured hippocampal neurons. Journal of Biological Chemistry. 2004;279:45833–45843. doi: 10.1074/jbc.M407229200. [DOI] [PubMed] [Google Scholar]
- Poirier G, Aggleton JP. The retrosplenial cortex and immediate-early gene reactivity following deafferentation in the rat. Experimental Psychology Society Abstract. 2005 [Google Scholar]
- Poirier G, Bloom Z, Aggleton JP. Temporal effect of anterior thalamic lesions on gene activation in retrosplenial cortex in the rat: Early appearance of “covert” pathology. European Brain and Behaviour Society Abstract. 2005 [Google Scholar]
- Reed LJ, Marsden P, Lasserson D, Sheldon N, Lewis P, Stanhope N, Guinan E, Kopelman MD. FDG-PET analysis and findings in amnesia resulting from hypoxia. Memory. 1999;7:599–612. doi: 10.1080/096582199387779. [DOI] [PubMed] [Google Scholar]
- Reed LJ, Lasserson D, Marsden P, Stanhope N, Stevens T, Bello F, Kingsley D, Colchester A, Kopelman MD. FDG-PET findings in the Wernicke-Korsakoff syndrome. Cortex. 2003;39:1027–1045. doi: 10.1016/s0010-9452(08)70876-1. [DOI] [PubMed] [Google Scholar]
- Roloff EvL, Platt B. Biochemical dysfunction and memory loss: the case of Alzheimer’s dementia. Cellular and Molecular Life Sciences. 1999;55:601–616. doi: 10.1007/s000180050318. [DOI] [PMC free article] [PubMed] [Google Scholar]
- Salmon E, Collette F, Degueldre C, Lemaire C, Franck G. Voxel-based analysis of confounding effects of age and dementia severity on cerebral metabolism in Alzheimer’s disease. Human Brain Mapping. 2000;10:39–48. doi: 10.1002/(SICI)1097-0193(200005)10:1<39::AID-HBM50>3.0.CO;2-B. [DOI] [PMC free article] [PubMed] [Google Scholar]
- Savaskan NE, Brauer AU, Kuhbacher M, Eyupoglu IY, Kyriakopoulos A, Ninnemann O, Behne D, Nitsch R. Selenium deficiency increases susceptibility to glutamate-induced excitotoxicity. FASEB Journal. 2003;17:112–114. doi: 10.1096/fj.02-0067fje. [DOI] [PubMed] [Google Scholar]
- Schwieler L, Erhardt S, Erhardt C, Engberg G. Prostaglandin-mediated control of rat brain kynurenic acid synthesis - opposite actions by COX-1 and COX-2 isoforms. Journal of Neural Transmission. 2005;112:863–872. doi: 10.1007/s00702-004-0231-y. [DOI] [PubMed] [Google Scholar]
- Selkoe DJ. Alzheimer’s disease is a synaptic failure. Science. 2002;298:789–791. doi: 10.1126/science.1074069. [DOI] [PubMed] [Google Scholar]
- Shivers BD, Killisch I, Sprengel R, Sontheimer H, Kohler M, Schofield PR, Seeburg PH. Two novel GABAA receptor subunits exist in distinct neuronal subpopulations. Neuron. 1989;3:327–337. doi: 10.1016/0896-6273(89)90257-2. [DOI] [PubMed] [Google Scholar]
- Small DH, Mok SS, Bornstein JC. Alzheimer’s disease and Abeta toxicity: from top to bottom. Nature Reviews Neuroscience. 2001;2:595–598. doi: 10.1038/35086072. [DOI] [PubMed] [Google Scholar]
- Squire LR, Zola SM. Ischemic brain damage and memory impairment: a commentary. Hippocampus. 1996;6:546–552. doi: 10.1002/(SICI)1098-1063(1996)6:5<546::AID-HIPO7>3.0.CO;2-G. [DOI] [PubMed] [Google Scholar]
- Subramanian A, Tamayo P, Mootha VK, Mukherjee S, Ebert BL, Gillette MA, Paulovich A, Pomeroy SL, Golub TR, Lander ES, Mesirov JP. Gene set enrichment analysis: A knowledge-based approach for interpreting genome-wide expression profiles. Proceedings of the National Academy of Sciences of the United States of America. 2005;102:15545–15550. doi: 10.1073/pnas.0506580102. [DOI] [PMC free article] [PubMed] [Google Scholar]
- Sugden D. Comparison of circadian expression of tryptophan hydroxylase isoform mRNAs in the rat pineal gland using real-time PCR. Journal of Neurochemistry. 2003;86:1308–1311. doi: 10.1046/j.1471-4159.2003.01959.x. [DOI] [PubMed] [Google Scholar]
- Sutherland RJ, Hoesing JM. Posterior cingulate cortex and spatial memory: A microlimnology analysis. In: Vogt BA, Gabriel M, editors. Neurobiology of cingulate cortex and limbic thalamus: A comprehensive handbook. Birkhäuser; 1993. pp. 461–477. [Google Scholar]
- Takano T, Tian G-F, Peng W, Lou N, Libionka W, Han X, Nedergaard M. Astrocyte-mediated control of cerebral blood flow. Nature Neuroscience. 2006;9:260–267. doi: 10.1038/nn1623. [DOI] [PubMed] [Google Scholar]
- Thomas M, Jankovic J. Neurodegenerative disease and iron storage in the brain. Current Opinion in Neurology. 2004;17:437–442. doi: 10.1097/01.wco.0000137534.61244.d1. [DOI] [PubMed] [Google Scholar]
- Valenstein E, Bowers D, Verfaellie M, Heilman KM, Day A, Watson RT. Retrosplenial amnesia. Brain. 1987;110:1631–1646. doi: 10.1093/brain/110.6.1631. [DOI] [PubMed] [Google Scholar]
- Valla J, Berndt JD, Gonzalez-Lima F. Energy hypometabolism in posterior cingulate cortex of Alzheimer’s patients: superficial laminar cytochrome oxidase associated with disease duration. Journal of Neuroscience. 2001;21:4923–4930. doi: 10.1523/JNEUROSCI.21-13-04923.2001. [DOI] [PMC free article] [PubMed] [Google Scholar]
- van der Werf YD, Scheltens P, Lindeboom J, Witter MP, Uylings HBM, Jolles J. Deficits of memory, executive functioning and attention following infarction in the thalamus; a study of 22 cases with localised lesions. Neuropsychologia. 2003;41:1330–1344. doi: 10.1016/s0028-3932(03)00059-9. [DOI] [PubMed] [Google Scholar]
- van Groen T, Wyss JM. Connections of the retrosplenial granular b cortex in the rat. Journal of Comparative Neurology. 2003;463:249–263. doi: 10.1002/cne.10757. [DOI] [PubMed] [Google Scholar]
- van Groen T, Vogt BA, Wyss JM. Interconnections between the thalamus and retrosplenial cortex in the rodent brain. In: Vogt BA, Gabriel M, editors. Neurobiology of cingulate cortex and limbic thalamus: A comprehensive handbook. Birkhäuser; 1993. pp. 123–150. [Google Scholar]
- Vaynman S, Ying Z, Wu A, Gomez-Pinilla F. Coupling energy metabolism with a mechanism to support brain-derived neurotrophic factor-mediated synaptic plasticity. Neuroscience. 2006;139:1221–1234. doi: 10.1016/j.neuroscience.2006.01.062. [DOI] [PubMed] [Google Scholar]
- Vogt BA, Peters A. Form and distribution of neurons in rat cingulate cortex: Areas 32, 24, and 29. Journal of Comparative Neurology. 1981;195:603–625. doi: 10.1002/cne.901950406. [DOI] [PubMed] [Google Scholar]
- Vogt BA, Rosene DL, Peters A. Synaptic termination of thalamic and callosal afferents in cingulate cortex of the rat. Journal of Comparative Neurology. 1981;201:265–283. doi: 10.1002/cne.902010210. [DOI] [PubMed] [Google Scholar]
- Wang B, Gonzalo-Ruiz A, Sanz JM, Campbell G, Lieberman AR. Glutamatergic components of the retrosplenial granular cortex in the rat. Journal of Neurocytology. 2001;30:427–441. doi: 10.1023/a:1015069727171. [DOI] [PubMed] [Google Scholar]
- Wenstrup D, Ehman WD, Markesbery WR. Trace element imbalances in isolated subcellular fractions of Alzheimer’s disease brains. Brain Research. 1990;533:125–131. doi: 10.1016/0006-8993(90)91804-p. [DOI] [PubMed] [Google Scholar]
- White A-M, Platt B. Ionic mechanisms of GABA-induced long-term potentiation in the rat superior colliculus. Experimental Brain Research. 2001;140:486–494. doi: 10.1007/s002210100854. [DOI] [PubMed] [Google Scholar]
- Wibrand K, Messaoudi E, Havik B, Steenslid V, Lovlie R, Steen VM, Bramham CR. Identification of genes co-upregulated with Arc during BDNF-induced long-term potentiation in adult rat dentate gyrus in vivo. European Journal of Neuroscience. 2006;23:1501–1511. doi: 10.1111/j.1460-9568.2006.04687.x. [DOI] [PubMed] [Google Scholar]
- Williams JM, Thompson VL, Mason-Parker SE, Abraham WC, Tate WP. Synaptic activity-dependent modulation of mitochondrial gene expression in the rat hippocampus. Brain Research. Molecular Brain Research. 1998;60:50–56. doi: 10.1016/s0169-328x(98)00165-x. [DOI] [PubMed] [Google Scholar]
- Wisden W, Morris BJ. In situ hybridisation with synthetic oligonucleotide probes. In: Wisden W, Morris BJ, editors. In situ hybridisation protocols for the brain. Academic Press Limited; 1994. pp. 9–34. [Google Scholar]
- Yao PJ, Zhu M, Pyun EI, Brooks AI, Therianos S, Meyers VE, Coleman PD. Defects in expression of genes related to synaptic vesicle trafficking in frontal cortex of Alzheimer’s disease. Neurobiology of Disease. 2003;12:97–109. doi: 10.1016/s0969-9961(02)00009-8. [DOI] [PubMed] [Google Scholar]
- Yunfeng L, Yongsheng C, Lifeng Z, Qiping F, Zhuo L, Yongwei Z, Jin Z, Yan M, Fude F. High glucose upregulates pantothenate kinase 4 (PanK4) and thus affects M2-type pyruvate kinase (Pkm2) Molecular and Cellular Biochemistry. 2005;277:117–125. doi: 10.1007/s11010-005-5535-1. [DOI] [PubMed] [Google Scholar]
Associated Data
This section collects any data citations, data availability statements, or supplementary materials included in this article.