

Summary
Malignant astrocytic brain tumors are among the most lethal cancers. Quiescent, and therapy-resistant neural stem cell (NSC)-like cells in astrocytomas are likely to contribute to poor outcome. Malignant oligodendroglial brain tumors, in contrast, are therapy-sensitive. Using magnetic resonance imaging (MRI) and detailed developmental analyses, we demonstrated that murine oligodendroglioma cells show characteristics of oligodendrocyte progenitor cells (OPCs), are therapy-sensitive; and that OPC rather than NSC markers enriched for tumor formation. MRI of human oligodendroglioma also suggested a white-matter (WM) origin, with markers for OPCs rather than NSCs similarly enriching for tumor formation. Our results suggest that oligodendroglioma cells show hallmarks of OPCs, and that a progenitor rather than a NSC origin underlies improved prognosis in patients with this tumor.
Significance.
The relationship between oligodendroglioma cells and normal stem and progenitor cells is uncertain. Most normal brain structures arise from NSCs in the ventricular zone, an area that persists in adults and generates adult NSCs. Oligodendrocyte progenitor cells (OPCs) located in WM constitute a second postnatal reservoir for generation of glial cells. Whereas astrocytic tumors have been described to contain NSC-like tumor cells that are quiescent and therapy-resistant; the features of tumor-initiating cells in oligodendroglioma remain poorly understood. We show that mouse and human oligodendroglioma cells share hallmarks of progenitors rather than NSCs. Our results suggest that a progenitor origin for oligodendroglioma contribute to its responsiveness to therapy.
Introduction
Oligodendrogliomas comprise a glial fibrillary acidic protein (GFAP) negative glioma, account for ~5–20% of gliomas, and show morphology and markers associated with oligodendrocytes, myelin-forming cells in the brain. Postnatal oligodendrocytes arise from oligodendrocyte progenitor cells (OPC), the most abundant population of cycling cells in the adult brain (Dawson et al., 2003; Geha et al., 2009). OPCs are widely dispersed in the subventricular zone (SVZ), a neural stem cell (NSC)-rich region lining the lateral ventricular walls, and as a resident population in white matter (WM) regions (Levison and Goldman, 1993; Menn et al., 2006; Zhu et al., 2008). OPCs can be identified through co-expression of platelet-derived growth factor receptor α (PDGFRα), transcription factors Sox10 and Olig2, and the neuro-glial chondroitin sulfate proteoglycan 4 (NG2) (Chang et al., 2000). Expression of NG2 is higher in oligodendrogliomas than in the more frequently arising astrocytic tumors, however lineage relationships among oligodendrogliomas, NSCs and OPCs remain poorly understood (Shoshan et al., 1999). In this communication, we investigated and compared NSCs and OPCs as potential cells of origin in murine and human oligodendroglioma.
Results
Murine oligodendrogliomas develop in association with WM tracts through expansion of OPCs
To investigate oligodendroglioma development, we employed a transgenic mouse glioma model driven by an activated allele of EGFR, (v-erbB) under control of the human S100β promoter (Weiss et al., 2003). Aberrant epidermal growth factor receptor (EGFR) signaling in both NSCs and OPCs may contribute to oligodendrocytic tumors (Gonzalez-Perez et al., 2009; Ivkovic et al., 2008). S100β is associated with mature astrocytes, ependymal cells, select neuronal populations, and OPCs. In the adult SVZ, S100β is expressed as GFAP+ cells lose NSC potential (Hachem et al., 2005; Raponi et al., 2007). Mice expressing v-erbB develop low-grade oligodendrogliomas, with expression of v-erbB mRNA localized to the cerebellar granular cell layer, subcortical WM and SVZ (Weiss et al., 2003). Tumors arose with increased grade and shortened latency (average 66 ± 5d) in v-erbB-expressing mice deleted for p53 (E/p53−/−) and were used in most experiments (Figure S1A–B).
To assess proliferation in SVZ prior to development of tumors, we sacrificed mice at postnatal days 10 and 30 (P10 and P30). BrdU labeling in SVZ at P10 and P30 was indistinguishable in E/p53−/− mice and p53−/− littermates (Figure S1C–E). The distribution of BrdU in GFAP+ proliferating NSCs, doublecortin+ neuroblasts, and Olig2+ glial progenitors was also comparable in E/p53−/− and p53−/− mice (Figure S1F–H). These data suggest that v-erbB affected neither proliferation nor differentiation of SVZ NSCs, and are consistent with NSCs being S100β– (Raponi et al., 2007).
In contrast, tumor-bearing transgenic mice showed proliferation in stria terminalis, a WM structure adjacent to SVZ (Figure 1A–B, see insert). Also, irrespective of p53 status, symptomatic transgenic mice displayed massive proliferation in WM regions such as the corpus callosum (CC), illustrated by Ki67 or BrdU labeling (Figure 1C). To further localize tumors, we used MRI and postmortem histology in symptomatic transgenic mice. T1-weighted imaging of a transgenic animal illustrates a typical tumor within CC (Figure 1D). Tumor cells had characteristic oligodendroglioma-like morphology (Figure 1E–F), collectively suggesting that murine oligodendrogliomas arise in WM regions.
Figure 1. NG2 expression in WM regions in developing oligodendrogliomas.

Proliferating regions in transgenic mice (E/p53−/−) were identified by administering BrdU 2 h before sacrifice. (A–B) Identification of BrdU+ cells next to the SVZ in transgenic mice developing tumors. Higher magnification of BrdU labeling (arrows) in stria terminalis of striatum, a WM region. (C) Proliferation (Ki67+) in WM structures (arrows): cc--corpus callosum, ec--external capsule. To investigate if v-erbB expanded NSCs and their progeny at P30, transgenic mice and non-transgenic mice were administered BrdU 2 h before sacrifice (insert). (D) T1 weighted MRI shows a supratentorial tumor (arrow) in a E/p53−/− mouse. (E) Pathology obtained after MRI shows tumor in WM (arrowheads). (F) Tumor cells with round nuclei and perinuclear cytoplasmic retraction (arrows). (G–I) NG2+/Olig2+ cells (*) in CC in control p53−/− mice (G) and in E/p53−/− mice (H), quantification results are shown in (I). ***P < 0.001, Student’s t-test. Values are expressed as mean ± SEM. (J–O) H&E staining of (J–L) and NG2 expression in (M–O) a transgenic mouse brain. Arrows indicate WM tracts, cb--cerebellum, ot--optic tract, sp--septum, ctx--cortex, ob--olfactory bulb, hipp--hippocampus. (J, M) A parasagittal section shows multifocal tumors (*). (K, N) Tumors along CC. Arrows in the insert indicate perinuclear halos. (L, O) Tumors arising in cerebellum. The innermost WM structure is indicated by arrow. * indicates molecular cell layers (*). See also Figure S1.
Murine oligodendrogliomas arise through expansion of OPCs
Glial progenitors, including NG2-expressing OPCs (Gonzalez-Perez et al., 2009; Menn et al., 2006), express high levels of Olig2, allowing us to distinguish these cells from NSCs and prompting us to quantify the fraction of Olig2+ glial progenitor cells that expressed NG2 in SVZ (Dawson et al., 2003). At P30, E/p53−/− mice showed a 3-fold increase in the fraction of Olig2+ cells expressing NG2 in SVZ compared to controls (Figure S1I–K). Further, all NG2+ cells co-expressed S100β (insert Figure S1J). These results suggest that OPCs expand in the SVZ of E/p53−/− mice. Although the SVZ is a region enriched for NSCs, our data are consistent with expression of v-erbB predominantly in OPCs rather than NSCs within the SVZ.
Since NG2+ OPCs are prominent in subcortical WM, we analyzed Olig2+ cells expressing NG2 in CC at P30. Transgenic mice (E/p53−/−) showed a 3-fold increase in the fraction of Olig2+ cells expressing NG2 in CC compared to controls (Figure 1G–I). Tumor regions arising in WM tracts of E/p53−/− mice expressed NG2 (Figure 1J–O). In cerebellum, most tumor cells were found in the innermost WM (Figure 1, panel O). At P30, E/p53−/− mice displayed high numbers of proliferative cells in other WM tracts (Figure 2A–D). These proliferative lesions stained for oligodendroglial markers NG2 and Olig2, and were negative for astrocytic marker GFAP (Figure 2E–J).
Figure 2. Expression of NG2 and GFAP in proliferative regions in premalignant mice.

(A) Illustration of two coronal sections of a mouse brain. Red dots represent brain regions that incorporated BrdU in P30 E/p53−/− mice at 2 hr. Lateral ventricles (lv) are shown in blue. ec--external capsule, cc--corpus callosum, ac--anterior commisure, sp--septum pellucidum, st--stria terminalis, ot--optic tract. (B–D) Incorporation of BrdU (arrows). (E–G) Expresssion of the early glial marker Olig2 and the astrocytic marker GFAP in BrdU+ cells. (H–J) Co-expression of Olig2+ and NG2 in BrdU+ cells. See also Figure S2.
WM tracts in mice are enriched for OPCs, prompting us to investigate expression of additional OPC markers. NG2+ tumor cells co-expressed S100β, the v-erbB transgene, and the OPC markers PDGFRα, A2B5, Sox10, and Olig2 (Figure S2A). This expression profile together with expression of the oligodendrocyte markers MBP and CNPase, and low levels of GFAP are aligned with patterns in oligodendroglioma in humans. Collectively, these data suggest that tumors in this model arise from WM regions and express proteins normally found in OPCs.
To determine whether altered gene expression in transgenic OPCs contributed to tumors, we analyzed Sox10, a gene required for terminal differentiation of OPCs, that also promotes gliomagenesis (Johansson et al., 2004). We generated mice doubly transgenic for S100β-v-erbB and NG2-DsRed (Zhu et al., 2008), allowing us to identify and isolate DsRed+ NG2 cells. WM regions from E/p53−/− mice (NG2-DsRed) were pooled at P30, well before tumors arise. Tissues were micro-dissected and analyzed by FACS, followed by RNA isolation and real-time PCR (Figure S2B). Levels of Sox10 in NG2+ cells were 5-fold higher in E/p53−/− than in p53−/− mice (P < 0.05), suggesting that the S100β-v-erbB transgene regulates gene expression in NG2+ cells, promoting tumorigenesis (Figure S2C). These data demonstrate that expansion of OPCs in WM regions precedes development of tumors, and suggest that oligodendrogliomas in these animals arise from NG2+ cells in WM regions.
Gene expression in murine oligodendrogliomas demonstrate an OPC rather than a NSC profile
It is important to clarify that TICs define a functional population of cells that are tumor propagating, and does not necessarily imply a relationship with a specific cell of origin. TICs in human GBM typically constitute a minority population, and share features of NSCs including self-renewal, multipotency and resistance to therapy (Bao et al., 2006; Bleau et al., 2009; Singh et al., 2004; Stiles and Rowitch, 2008). To study these properties, we isolated cells from SVZ, WM tracts, and tumors of both E/p53−/− mice and p53−/− controls. Cells in Neurobasal media (NB) supplemented with FGF-2 and EGF were studied as acutely isolated, low-passage (< 5 passages), or high-passage (>5 passages).
To delineate the relationship among v-erbB expressing cells isolated from SVZ and tumors (E/p53−/−), normal NSCs from SVZ (p53−/−), and WM progenitors (p53−/−), we performed real-time PCR for NSC and OPCs markers. Transgenic (E/p53−/−) cells from SVZ and tumors expressed high levels of OPC markers and low levels of NSC markers relative to normal SVZ NSCs (Figure S2D). Interestingly, v-erbB-expressing low-passage cells isolated from SVZ, CC, and tumors showed gene expression profiles similar to control cells isolated from CC rather than SVZ (Figure S2E). In fact, levels of OPC markers Sox10 and PDGFRα were elevated in acutely and low-passage cells from E/p53−/− mice compared to WM progenitors from p53−/− mice, suggesting that v-erbB was associated with increased expression of these genes (Figure S2E–F).
In contrast to passaged SVZ cells from E/p53−/− mice (Figure S2E), acutely isolated SVZ cells expressing v-erbB mRNA showed no changes in Sox10 and Hes1 compared to controls (Figure S2F). We confirmed for a subset of these genes, differential protein expression in E/p53−/− tumor cells (10118T) compared to p53−/− SVZ NSCs (Figure S2G). The high expression levels of OPC rather than NSC markers in v-erbB-expressing cells suggest that these cells are more related to WM OPCs rather than SVZ NSCs.
V-erbB-expressing murine oligodendroglioma cells differentiate into oligodendrocytes in response to inhibitors of MAPK
In contrast to SVZ NSCs, murine oligodendroglioma cells showed efficient proliferation independently of growth factors (Figure 3A, S3A–B). Basal levels of pErk1/2 and pAkt (in SVZ NSCs, grown in FGF-2 and EGF) were reduced when compared to low-passage E/p53−/− cells (Figure 3B). We next analyzed proliferation in NG2+ OPCs. Dividing BrdU+ low-passage cells in SVZ NSC cultures from p53−/− mice were NG2−. In contrast proliferating tumor cells were highly NG2+ (Figure S3C–D). NG2+ cells from transgenic mice expressed both S100β and v-erbB (Figure S3E–H). The frequency of NG2+ cells in SVZ cultures from E/p53−/− mice was expanded in and adjacent to SVZ, with unaltered proliferation of SVZ NSCs (Figure S3I–J). These results suggest that v-erbB under control of the S100β promoter promotes expansion of NG2+ OPCs.
Figure 3. Inhibition of MAPK effects differentiation of murine oligodendroglioma cells.

(A) Cells from three low-passage murine oligodendrogliomas or from p53−/− SVZ were grown in the absence (w/o GF) or presence of indicated growth factors (7d) on coated plates and quantified by CyQuant proliferation assay. (B) Immunoblot of pAkt and pErk1/2 in adherent cells on coated plates from p53−/− and E/p53−/− mice. SVZ-subventricular zone, CC-corpus callosum, T-tumor. (C–D) Immunofluoresent analyses of NG2+ and O4+ cells from a representative murine oligodendroglioma without or with treatment with 1 μM PD for 7days (C), quantification data shown in (D). Scale bar: 40 μm. (E–F) Immunofluoresent analyses for the neuronal marker map2ab+ and the glial marker GFAP of SVZ NSCs without or with treatment with 1 μM PD for 7days. Values are expressed as mean ± SEM. See also Figure S3.
To modulate signaling pathways, we used MEK inhibitor PD325901 (1 μM, PD) and PI3K/mTOR inhibitor LY294002 (10 μM, LY). Tumor cells from transgenic (E/p53−/−) mice were incubated without EGF and FGF-2 for 24h. Inhibitors were added (2h) followed by 100 ng/ml EGF (20min) prior to lysis (Figure S3K). To determine effects on low-passage v-erbB-expressing murine oligodendroglioma (E/p53−/−), we incubated cells for 7d with PD (1 μM) and/or LY (10 μM). While PD was more effective than LY in reducing proliferation of SVZ NSC (p53−/−SVZ), both inhibitors were equally effective at reducing proliferation of tumor cells (Figure S3L). Interestingly, inhibition of MEK (but not PI3K/mTOR) induced oligodendrocyte-like differentiation of the tumor cells (Figure S3M–N).
Incubation with PD differentiated acutely isolated murine oligodendroglioma (31194T) cells into oligodendrocytes expressing O4, a marker of immature oligodendrocytes (Figure 3C). PD reduced the percentage of NG2+ tumor cells (67 ± 4% vs. 21 ± 5%, P < 0.001) and increased the percentage of O4+ cells (11 ± 3% vs. 51 ± 3%, P < 0.01) (Figure 3D), specifically inducing oligodendroglial, but not neuronal or astroglial, differentiation. Incubation of SVZ NSCs with PD induced neuronal (map2ab: 32 ± 4% vs. 3 ± 2%, P < 0.001) and astroglial (GFAP: 29 ± 2% vs. 5 ± 1%, P < 0.001), but not oligodendroglial differentiation (Figure 3E–F). These results suggest that the S100β promoter drives expression of v-erbB expression in WM OPCs, resulting in increased pErk1/2, increased proliferation, and formation of oligodendroglioma in transgenic mice.
Oligodendroglioma cells show restricted differentiation and sphere-formation
We next investigated E/p53−/− oligodendroglioma cells for multipotency and sphere-formation. Both ciliary neurotrophic factor (CNTF) and bone-morphogenic protein 4 (BMP4) induce robust astroglial differentiation in low-passage NSC cultures. Incubation with these factors for 7d reduced the expansion of low-passage SVZ NSCs and astrocytoma (GFAP-Ras) cells (Ding et al., 2001), with more modest effects on low-passage oligodendroglioma cells (Figure 4A–C), suggesting that oligodendroglioma cells fail to respond to morphogens that block proliferation in both NSCs and astrocytoma cells.
Figure 4. Expression of OPC and NSC markers in NG2+ oligodendroglioma cells.
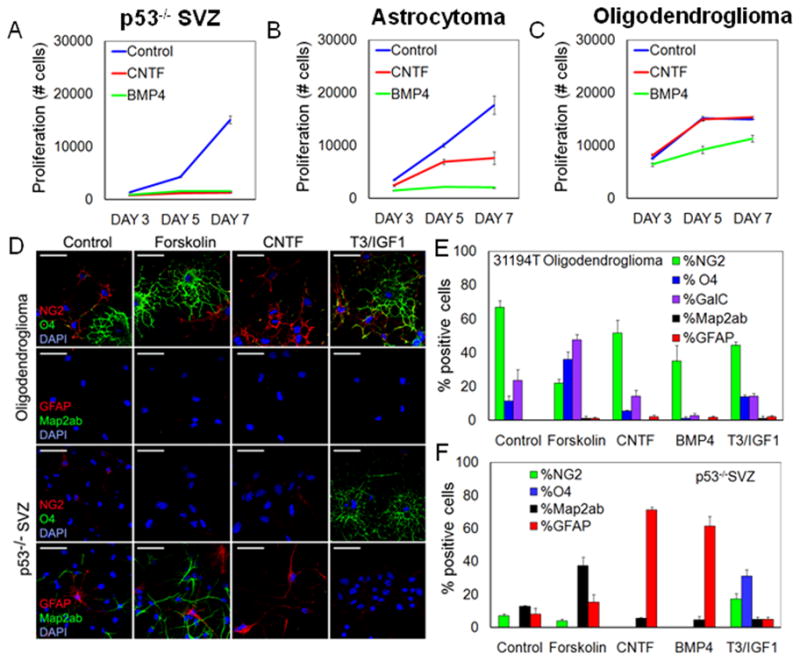
(A–C) Low-passage SVZ NSCs, GFAP-Ras murine astrocytoma cells, and murine oligodendroglioma cells were incubated with CNTF or BMP4 for 7d and their proliferation was measured using CyQuant proliferation assay. (D–F) Potential of acutely isolated SVZ NSCs and murine oligodendroglioma cells to differentiate into three neural cell lineages. (D) Murine oligodendroglioma cells or p53−/− spheres from SVZ were stained for NG2, O4, Map2ab, and GFAP under differentiating conditions for 7d in response to forskolin, CNTF, and T3/IGF1. Scale bars: 40 μm. (E–F) Quantification of response for acutely isolated murine oligodendroglioma cells and SVZ NSC cultures, to agents shown in D, and to BMP4. Values are expressed as mean ± SEM. See also Figure S4.
To further assess the multilineage competence of oligodendroglioma-derived cells, we treated cells with morphogens known to differentiate NSCs into neurons (forskolin), astrocytes (CNTF or BMP4) and oligodendrocytes (combination of T3 and IGF-1), analyzing both acutely isolated SVZ NSCs (p53−/−) and tumor cells (31194T). Consistent with a limited differentiation potential of OPCs, NG2-expressing tumor cells responded to forskolin by differentiating into O4+ oligodendrocytes rather than neurons or astrocytes (Figure 4D–E). While BMP4 showed an inhibitory effect on oligodendrocyte differentiation, neither CNTF nor T3/IGF1 significantly affected differentiation in oligodendroglioma cells (Figure 4D–E).
In contrast to the limited differentiation potential of E/p53−/− oligodendroglioma cells, p53−/− SVZ NSCs were multipotent, and showed robust differentiation into neurons (forskolin), astrocytes (CNTF or BMP4), and oligodendrocytes (T3/IGF-1) (Figure 4D,F). In tumors from a murine astrocytoma model (GFAP-Ras), acutely isolated tumor cells expressed CD15 and readily differentiated into astrocytes in response to forskolin, CNTF, or BMP4 (Figure S4A). Furthermore, continued passage of these astrocytoma cells enriched for the NSC marker CD15 and not the OPC marker NG2 (not shown). Thus, NSCs and murine astrocytoma cells both show multipotent differentiation potential, while differentiation potential in murine oligodendroglioma cells is more restricted.
To determine if the restricted differentiation of murine oligodendroglioma cells was differentially associated with either NG2+ or NG2− subpopulations, we acutely isolated tumor cells, and separated NG2+ and NG2− populations using FACS. One day after isolation many NG2− cells displayed an oligodendrocyte phenotype, whereas NG2+ cells remained undifferentiated morphologically, continuing to divide (Figure S4B). Enzymatic dissociation of murine oligodendroglioma cells cleaved the NG2 epitope, less with accutase than with trypsin (Figure S4C and not shown). Immediately after accutase dissociation, cells analyzed by FACS showed a pure NG2− cell fraction (Figure S4C). Incubation of NG2− and NG2+ oligodendroglioma cells for 7d with forskolin revealed that NG2+, but not NG2− cells, could differentiate into O4+ oligodendrocytes (Figure S4D–E). Few tumor cells (9 ± 4%) in NG2-sorted cultures expressed neuronal marker map2ab. In contrast to NSC cultures (p53−/−SVZ), this number was unchanged in response to forskolin. These results suggest that NG2+ cells can be differentiated along the oligodendrocytic lineage. We found that NG2+ oligodendroglioma cells in this mouse model show poor sphere-formation capacity, and that CD15 labels a population of sphere-forming cells in both tumors and the non-transformed brain (Figure S4F–G). To study how passage affected the fraction of cells expressing NG2 or the NSC marker CD15, we cultured tumors from transgenic mice and performed FACS at different passages. Continued passage enriched for NG2+ cells due to death of non-tumor cells and fast proliferation of NG2+ tumor cells (Figure S4H). Expression of CD15 did not change (Figure S4I).
Progenitor rather than NSC-like murine oligodendroglioma cells drive tumor formation in mice
In murine astrocytoma models, sphere-forming tumor cells effectively establish tumors in-vivo (Alcantara Llaguno et al., 2009; Marumoto et al., 2009), with the NSC marker CD15 enriching for sphere-forming TICs in human GBM (Son et al., 2009). Consistent with a progenitor rather than an NSC-origin in murine oligodendrolioma, cells isolated from tumors of E/p53−/− mice displayed a major population of NG2+ cells that was non-overlapping with a minor CD15+ population (Figure 5A). To investigate whether CD15+ cells could initiate oligodendroglioma, we grafted 1,000 low-passage CD15− (CD15 neg) or CD15+ (CD15 high) tumor cells into recipient mice. CD15+ NSC-like cells isolated from E/p53−/− mice were non-tumorigenic (Figure 5B). In contrast, grafting of 50 acutely isolated NG2+CD15− tumor cells resulted in tumors in 3/4 mice (Figure 5C). Control mice injected with NG2−CD15− or NG2−CD15+ cells showed no tumors over 60d.
Figure 5. Assaying tumorigenicity in response to enrichment for the OPC marker NG2 or the NSC marker CD15.

(A) Expression of the NSC marker CD15 (arrows) and the progenitor marker NG2, in FACS sorted murine oligodendroglioma tumor cells. (B) Allografting of 1,000 low-passage tumor cells (10118T) analyzing tumor-forming ability of CD15− and CD15+ NSC -like cells (n = 5 per group) and survival of mice. (C) Animal survival following injection of 50 cells acutely isolated from tumor 30698, comparing NG2+, NG2−CD15−, and NG2−CD15+ cells. (D) Fraction of NG2+ cells shown as a function of passage (green--acutely isolated tumor cells, blue low passage; red high passage). (E–G) Tumorigencity of NG2+ cells and survival of grafted mice. Tumors isolated from E/p53−/− mice were FACS sorted cells based on expression of NG2. (E) Tumor formation in mice grafted with 1,000 cells (n=5 mice per group) showing high expression of NG2 (NG2 high), low expression of NG2 (NG2 low), and NG2− cells (NG2 neg). (F) In a separate experiment, 50 acutely isolated (31193T), low-passage (10118T), or high-passage (24314T) NG2+ or NG2− tumor cells were grafted orthotopically. Tumor burden is indicated by surviving fraction. See also Figure S5.
Since continued passage of tissues from E/p53−/− mice enriched for NG2 expression (Figure 5D), we used low-passage cells, sorted these into NG2 low, intermediate or high groups, and grafted 1,000 tumor cells into recipient mice. Expression of NG2 correlated with tumorigenicity (Figure 5E). To further define the efficiency by which NG2-directed FACS enriched for TICs, we grafted 50 NG2+ or NG2− tumor cells from acutely, low- and high-passaged tumors into recipient mice. Independently of passage, NG2+ cells were more tumorigenic than NG2− cells (Figure 5F). All tumors showed oligodendroglioma-like morphology, with transplanted and primary tumors showing the same OPC markers (data not shown).
A dye-excluding minority side-population (SP) of tumor cells also shows properties of NSCs (Murayama et al., 2002). To investigate the SP in murine oligodendroglioma, we FACS sorted tumor cells from E/p53−/− mice and compared tumorigenicity in SP and non-SP (NSP) tumor cells injected into recipient mice. The SP (0.9 ± 0.7% of all tumor cells) was abolished by incubation with 20 μM verapamil, known to block SP-enriched multidrug transporters (Figure S5A). No significant difference in tumorigenicity was observed between SP and NSP cells (Figure S5B). Both the SP and S100A6 have been suggested to mark rare NSC-like tumor cells in this model (Harris et al., 2008). We observed broad expression of S100A6 in all tumors (Figure S5C). Our results suggest that neither the SP nor S100A6 enrich for TICs in this model.
The cell-surface marker CD133 also enriches for TICs in human glioma (Singh et al., 2004). The corresponding murine protein prominin, was expressed at low levels in v-erbB+ tumors (5 of 6 tumors showed <1% prominin+ cells), and overlapped with both the NG2− and NG2+ populations (Figure S5D–E). The latency of tumor formation in recipient mice and ability to form tumor spheres in vitro reflected the fraction of NG2+ cells in both prominin− and prominin+ fractions (Figure S5F–H). In a separate experiment, few CD15+ NSCs (p53−/−SVZ) incorporated BrdU after a 24h pulse whereas the majority of NG2+ oligodendroglioma cells (E/p53−/−) were labeled (Figure S5I–L). Collectively, these results demonstrate that NG2 labels a major population of fast-dividing tumor cells displaying higher tumorigenicity than NG2− cells in murine oligodendroglioma.
NG2+ and NG2− oligodendroglioma cells are sensitive to temozolomide
To correlate the OPC origin with response to alkylator therapy in oligodendroglioma, we incubated SVZ NSCs, murine oligodendroglioma cells, and murine astrocytoma (GFAP-Ras) cells with TMZ (TMZ, 10–100 μM). In contrast to SVZ NSC and murine astrocytomas (Figure S6A–B), murine oligodendrogliomas and OPCs (p53−/−CC) were highly temozolomide-sensitive (Figure 6A–E, S6C). Treatment of NG2− and NG2+ fractions showed both populations to have equivalent sensitivity to TMZ (Figure 6F). These data suggest further that OPC rather than NSC-like cells in oligodendroglioma correlate with improved response to alkylating agents.
Figure 6. Tumorigenicity and response of NG2+ oligodendroglioma cells to temozolomide.

Human oligodendrogliomas differ from astrocytomas in their increased sensitivity to alkylating agents. (A–B) Adherent low-passage murine oligodendroglioma cells (10118T) were treated with 100 μM TMZ for 7d (TMZ100). (C–D) Immunofluorescence staining of representative tumor cells demonstrating expression of NG2 before and after incubation with TMZ. (E–F) Proliferation assay demonstrating response of acutely isolated murine oligodendroglioma cells (30698T) to increasing concentrations of TMZ (0–100 μM), as a function of NG2 status. (G–H) Response of low-passage human oligodendroglioma cells (SF8245) to TMZ, as a function of NG2 status. (I) Flow cytometry of SF7987 demonstrating the fraction of NG2+ cells in an acutely isolated 1p/19q deleted grade II oligodendroglioma. (J) FACS analyses: expression of NG2 in high-passage (red) GBMs, acutely dissociated oligodendrogliomas (green), and a low-passage oligodendroglioma (blue). (K–L) Surviving fraction of mice grafted with 1,000 NG2+ or NG2− cells per mouse from acutely isolated oligodendroglioma SF7987 and from an acutely isolated grade II oligodendroglioma SF7891 (showing EGFR expression and p53 mutation). Values are expressed as mean ± SEM. See also Figure S6.
To determine relevance, we isolated human oligodendroglioma cells from a patient with a grade II oligodendroglioma (SF8245). As a comparison, we also isolated tumor cells from a patient diagnosed with a grade II astrocytoma associated with the lateral ventricles (SF8138), and studied low-passage primary human GBM cells (SF6969). When low-passage human tumor cells were cultured in neurobasal media (NBE, see Supplemental Experimental Procedures) on coated plates and incubated for 7d with 10–100 μM TMZ, oligodendroglioma cells proved more sensitive than either astrocytoma or primary GBM cells (Figures 6G, S6D–E). Interestingly both human GBM and astrocytoma cultures showed enrichment of CD15+ cells after treatment with TMZ, with the GBM also demonstrating higher levels of CD133 and podoplanin (not shown). Like murine oligodendroglioma cells, human oligodendroglioma cells, irrespective of NG2 status, were similarly sensitive to TMZ (Figure 6H). These human and murine data collectively suggest that a progenitor-like phenotype may underlie sensitivity of oligodendroglioma cells to TMZ, and that NSC-like properties reciprocally underlie relative resistance to TMZ in astrocytic tumors.
NG2+ cells in human oligodendrogliomas are highly tumorigenic
To study tumorigenicity of NG2+ cells in human glioma, we dissociated tumor cells, grown in NBE supplemented with FGF-2 and EGF, from 2 patients diagnosed with primary grade II oligodendroglioma (SF7987 and SF7891). Flow cytometry verified expression of NG2 in a significant fraction of all samples (Figure 6I–J). Interestingly, continued passage in vitro of human oligodendroglioma cells (SF8245) cultured in NBE supplemented with FGF-2 and EGF, led to further enrichment for NG2, while similar propagation of primary human GBM enriched for CD15 (data not shown).
To study tumorigenicity, we fractionated acutely isolated SF7987 oligodendroglioma cells followed by grafting of 1,000 NG2+ or NG2− cells. Three of 4 mice injected with NG2+ oligodendroglioma cells developed tumors after 5–8 months. No tumors (0/4) established from NG2− SF7987 cells (Figure 6K). Two mice injected with 1,000 acutely isolated NG2+ low grade oligodendroglioma cells SF7891 (2/4), died after almost 1 year, whereas all mice injected with NG2− cells survived (Figure 6L). These results suggest that NG2+ cells from human oligodendrogliomas proliferate and are highly tumorigenic.
Human oligodendrogliomas localize to WM and express OPC markers
If oligodendrogliomas arise from OPCs rather than NSC-like cells, then do these tumors associate with white-matter regions where NG2+ OPCs normally reside? To address this question, we studied 47 grade II and III non-enhancing oligodendrogliomas and astrocytomas. Use of small lower grade tumors simplified localization to WM or ventricular regions. Further, the fact that tumors did not exhibit contrast-enhancement reduced the chances of erroneously identifying the boundaries of leaky vasculature as the boundaries of tumor infiltration.
Using T1-weighted spoiled gradient echo (SPGR) and T2-weighted fast low angle inversion recovery (FLAIR) MRI images, we determined whether 47 grade II–III gliomas were touching the lateral ventricles (Figure 7A). We hypothesized that gliomas touching the lateral ventricles were astrocytomas (Figure 7B). For the remaining gliomas, the diagnosis was predicted using FA and apparent diffusion coefficient (ADC) maps, highlighting regions of fluid movements (Khayal et al., 2009). We first performed a qualitative assement of the FA map to classify as oligodendroglioma (diffuse edges) or astrocytoma (well-circumscribed borders) and then confirmed the classification by calculating the median normalized ADC value (Figure 7C). The qualitative and quantitative assessments matched in 18/20 cases that did not touch the ventricles. When they did not match, the ADC value was used because of the previously reported predictive value (Khayal et al., 2009). The majority of astrocytomas (Type 1: 21/34) were touching the lateral ventricles (Figure 7D). Based on ADC values, we were able to distinguish between 5 astrocytomas (Type 2, ADC: 2.1 ± 0.1) and oligodendrogliomas (ADC: 1.5 ± 0.02 located), not touching the ventricles. A diagnosis for a third group of 8 astrocytomas (Type 3) could not be predicted based on location or ADC values. All human oligodendrogliomas showing loss of chromosomes 1p and 19q (11/11), were associated with WM tracts rather than lateral ventricles (Figure 7E), consistent with an origin from WM progenitor cells. These results suggest that localization of gliomas and diffusion pattern on MRI may be useful future tools to subclassify oligodendrogliomas and astrocytomas with an OPC− or NSC−signature.
Figure 7. Analysis of association with WM and OPC expression profile in human oligodendrogliomas.

(A) Grade II–III gliomas lacking frank contrast-enhancement on T1-weighted MRI were subclassified based on association with the lateral ventricles and measurement of the apparent diffusion coefficient (ADC) according to the flow chart. (B) Example illustrating distance between edge of tumor and lateral ventricle for astrocytoma grade III (A-III), and 1p/19q co-deleted oligodendroglioma (O-II). (C) T1-weighted spoiled gradient echo and T2-weighted fast low angle inversion recovery (FLAIR) images were used to localize the tumor within the brain parenchyma. The next two images were acquired with a diffusion-weighted imaging technique that is sensitive to fluid mobility within the tumor. Image maps of the ADC and the fractional anisotropy (FA) highlight regions of isotropic and directional fluid movement, respectively. Representative images of tumors located within the white matter: one subset typically exhibited well-circumscribed borders (A-II) on the FA maps while a second subset typically showed diffuse borders (O-II) (compare magnifications in (C)). (D) The majority of grade II-III astrocytomas were touching the lateral ventricles (Type 1) and had a well-circumscribed border on both the anatomic MRI (T2-weighted and FLAIR) as well as on the diffusion weighted FA map of directional water mobility along WM structures. A second group of astrocytomas (Type 2) were not touching the lateral ventricles but showed a pattern on FA maps with well-circumscribed borders similar to Type 1 astrocytomas. A third group of astrocytomas (Type 3) were away from the ventricles and showed diffuse borders on FA maps similar to (E) 1p/19q oligodendrogliomas. (F) Gene expression patterns in human oligodendroglioma cells and WM glial progenitors (OPCs). Quantitative real-time PCR identified relative abundance of transcripts in A2B5+ human oligodendroglioma cells (n=3) and human astrocytomas (n=4) relative OPCs (n=3) normalized to their A2B5− remainders. Scale bars: 2 cm.
Based on these data, we predicted that progenitor cells within human oligodendroglioma would express transcripts consistent with human WM glial progenitors (here denoted OPCs), rather than with that of ventricular zone NSCs. To test this, we used magnetic cell immunosorting using an antibody against A2B5, which recognizes glial progenitor cells. A2B5 is expressed in the majority of tumor cells in oligodendroglioma (Ogden et al., 2008), and is typically co-expressed with NG2 (Sim et al., 2006). The relative abundance of a set of NSC− and OPC-related genes was compared in A2B5+ cells isolated from grade II human oligodendrogliomas (n=3), astrocytomas (n=4), and human OPCs, and normalized to their depleted (A2B5−) remainder. In a set of 91 cell-type and pathway-specific genes, 15% and 34% of the studied genes in oligodendroglioma and astrocytoma, respectively, showed significantly (P < 0.05) different mRNA expression levels compared to human OPCs (Figure 7F). Astrocytomas expressed lower levels of the OPC-related genes CSPG4 (NG2), Nkx2.2, and PDGFRα, compared to OPCs. Similar levels of the OPC-related genes (NG2, Olig2, Nkx2.2, PDGFRα, and Sox11) and NSC-related genes (Nestin, Sox2, Sox9, Musashi1/2) in human oligodendroglioma cells and OPCs suggest a progenitor rather than a stem-cell origin.
Human oligodendroglioma cells show limited sphere-formation and differentiation potential
We next investigated sphere-formation and multipotency in human oligodendroglioma. Human tumors were acutely isolated and cultured in N5 media, NBE media, or M41 media supplement with N1 and FGF2 (see Supplemental Experimental Procedures). An oligodendroglioma isolated from frontal cortex grew as elongated cells on coated plates in NBE (SF8245, Figure 8A–B). Incubation in M41 media resulted in slower growth along with differentiation into cells showing oligodendroglial morphology (inset Figure 8B). Some oligodendrogliomas expanded in NBE grew as clusters rather than uniform spheres on ultra-low adherent plates (Figure 8C).
Figure 8. Sphere formation and differentiation potential of human oligodendroglioma cells.

Cells were isolated from a human 1p/19q deleted oligodendroglioma (T2-weighted FLAIR image in A, SF#8245) and cultured as adherent (M41 media in insert, B) or clusters (C). (D) Sphere formation potential in NG2+ and NG2− cells from 2 acutely isolated 1p/19q deleted oligodendrogliomas. (E–F) Incubation of cells from (A) with BrdU 2h before fixation, followed by staining for OPC-related genes NG2 and Nkx2.2, and stem cell marker Nestin. (G–I) To investigate differentiation, we incubated tumor cells that had been passaged once, with forskolin, BMP4, or T3/IGF1 (7d). Quantification (G) with representative images (H–I) demonstrating staining with NG2 and O4 in response to forskolin. Values are expressed as mean ± SEM. See also Figure S7.
To evaluate the ability to form spheres, we plated cells from three low-passage grade IV astrocytomas (primary GBMs), an acutely isolated grade II astrocytoma (SF8138), and 2 acutely isolated grade II oligodendrogliomas in NBE (Figure 8D). In contrast to unsorted, NG2+, and NG2− oligodendroglioma cells, 4 astrocytic tumors efficiently formed spheres. These results suggest that human oligodendrogliomas are deficient at clonogenic expansion, unlike either primary NSCs or cells derived from astrocytomas or GBMs.
We assayed proliferation and differentiation potential by incubating human oligodendroglioma culture SF8245 for 2h with BrdU. Approximately 10% of NG2+ cells incorporated BrdU and expressed the glial progenitor marker Nkx2.2 (Figure 8E). The NG2+ cells expressed nestin (Figure 8F) but at lower levels than GBM cells (Figure S7A–C). We next incubated human oligodendroglioma cells (passaged once) with forskolin, BMP4, and T3/IGF to induce differentiation along the three neural cell lineages. Similar to murine oligodendrogliomas, neither BMP4 nor a combination of T3 and IGF1 induced differentiation in this human oligodendroglioma (Figure 8G). Also similar to the transgenic mouse model, incubation with forskolin reduced the levels of NG2+ oligodendroglioma cells (79 ± 6% vs 33 ± 6%, P < 0.01) and increased the levels of O4+ oligodendrocyte-like cells (0 ± 0% vs 7 ± 0.6%, P < 0.001) (Figure 8G–I).
A significant fraction (13 ± 1%) of the tumor cells expressed the immature neuronal marker TujI, suggesting ability to differentiate into neurons. However, forskolin did not increase neuronal differentiation of human oligodendroglioma cells. Incubation of grade II human oligodendroglioma cells (SF8245) with the MEK inhibitor PD325901 (1 μM) similarly reduced the fraction of NG2+ cells (79 ± 6% vs 32 ± 4%, P < 0.01) and induced expression of O4+ oligodendrocyte-like cells (0 ± 0% vs 8 ± 2%, P < 0.01) (Figure S7D–E). These results are aligned with those obtained using murine v-erbB-expressing oligodendrogliomas, and suggest that human oligodendroglioma cells are not tripotent, mainly differentiating into oligodendrocyte-like cells.
Discussion
Oligodendrogliomas show hallmarks of OPC rather than NSC
Recent studies suggest a relationship between NSCs and their malignant counterparts. However it is equally tenable that in the course of malignant progression, restricted progenitors or even differentiated cells may acquire properties associated with TICs: self-renewal, multipotent differentiation, and asymmetric division. It is entirely possible that tumor cells with a progenitor-like phenotype could arise from stem cells that subsequently commit to a progenitor lineage (e.g. BCR-Abl mutations in stem cells giving rise to myeloid leukemia (Castor et al., 2005)), or from a progenitor that subsequently de-differentiates into a more stem-like cell (Akala et al., 2008). Given these caveats, it is important to distinguish between the normal cells from which the tumor arises, and the cells that are capable of propagating tumors following transplantation.
Unlike NSCs, OPCs undergo a restricted number of cell divisions before they differentiate, a timing mechanism partly controlled by p27Kip1 (Durand et al., 1997). Since expression of v-erbB reduces p27Kip1, and proliferation in human oligodendrogliomas is inversely correlated with p27Kip1 levels (Fan et al., 2003; Fiano et al., 2003), this timing mechanism might be dysregulated in both murine and human oligodendroglioma cells, allowing tumor cells to continuously self-renew and unable to differentiate.
OPCs immortalized with an activated, point-mutated erbB2 oncogene differentiate into immature and mature oligodendrocytes in response to forskolin or erbB2 inhibition (Gobert et al., 2009). Similar to these OPCs, NG2-expressing oligodendroglioma cells in our studies responded to forskolin or a MEK inhibitor by differentiating into O4+ oligodendrocytes (and not into astroglia or neurons), whereas BMP4 treatment inhibited oligodendroglial differentiation.
Nuclear export of Olig2 is essential for complex formation between STAT3 and the transcription activator p300, allowing CNTF-induced differentiation in NSCs and OPCs (Setoguchi and Kondo, 2004). High nuclear expression of Olig2 in NG2+ oligodendroglioma cells might therefore explain why these cells failed to differentiate in response to CNTF. Interestingly, some NG2-sorted tumor cells expressed the neuronal marker map2ab, suggesting that these cells did differentiate into neurons. Similar to the v-erbB driven murine oligodendrogliomas, cultures of a 1p/19q deleted grade II oligodendroglioma (SF8245) contained a subpopulation of cells expressing the neuronal marker TujI along with oligodendroglial differentiation in response to forskolin, T3/IGF1, or a MEK inhibitor. Collectively, these data suggest that murine oligodendroglioma cells show a gene expression profile consistent with OPCs, and are bipotent rather than multipotent, differentiating mainly into oligodendrocytes.
Our previous study in mice transgenic for S100β-v-erbB showed tumors to arise in supratentorial and hindbrain locations (Weiss et al., 2003). Mutation at p53 led to increased grade and penetrance, while also promoting a more supratentorial localization. Perhaps relevant to these data, 13% of oligodendrogliomas and 25% of high-grade gliomas show p53 mutations, whereas mutation in p53 are rare in medulloblastoma, a tumor of the posterior fossa (Adesina et al., 1994). This caudal-rostral shift of tumors suggests that p53 plays region-specific roles in regulating proliferation, differentiation, and senescence in NSCs and progenitors during brain development that influences localization of tumors (Marumoto et al., 2009). We cannot exclude an NSC or radial glial origin for tumors arising in the posterior fossa region. However, S100β is expressed in embryonic radial glia lining the 4th ventricle (Hachem et al., 2007), and from birth is mainly localized to glia in the cerebellar WM (Vives et al., 2003), the region where we observed most NG2+ oligodendroglioma cells.
Loss of chromosomes 1p and 19q occurs commonly in human oligodendroglioma, especially in proneural tumors, while over-expression of EGFR and loss of p53 mark only a subset of tumors (Ducray et al., 2008). Interestingly, a minority of tumors in the v-erbB model shows loss of the distal part of chromosome 4 that corresponds to human 1p (Weiss et al., 2003). We demonstrate that OPC-like human oligodendroglioma cells from both 1p/19q and EGFR-driven tumors were highly tumorigenic. MRI analyses from patients with grade II–III gliomas demonstrated that oligodendrogliomas and astrocytomas could be subclassified based on MRI diffusion patterns (Khayal et al., 2009) and association with the lateral ventricles, a NSC-rich region. Interestingly, all 1p/19q deleted tumors arose in WM regions, while two EGFR-driven p53 mutant human tumors were associated with the lateral ventricles.
Despite the association of different tumors with specific brain regions, the cell of origin in human glioma remains uncertain. Recent subclassifications have demonstrated a classical group of primary GBMs with high levels of the NSC marker nestin and EGFR (Verhaak et al., 2010), and a mesenchymal group controlled by a transcriptional network that transforms NSCs (Carro et al., 2010). These two subclasses of primary GBMs may thus arise from transformation of NSCs. A proneural group of GBMs displays mutation of IDH1 and shows high levels of the OPC-related genes Nkx2.2, Olig2, and PDGFRα (Brennan et al., 2009; Verhaak et al., 2010). In contrast to other groups of GBMs, the gene expression profile of proneural GBMs was aligned with cultured oligodendrocytes (Verhaak et al., 2010), suggesting that IDH1 mutant gliomas may arise from OPCs rather than dedifferentiated astrocytes or NSCs. Proneural oligodendrogliomas also show 1p/19q loss, and express neuronal markers consistent with origin from a bi-potential progenitor capable of generating both oligodendrocytes and neurons (Ducray et al., 2008).
NG2, but not NSC markers, selects for high tumorigenicity in oligodendroglioma
The NSC markers CD133 (prominin), CD15, and the dye-excluding SP enrich for highly tumorigenic cells in the brain tumors medulloblastoma and astrocytomas, in both mice and humans (Bleau et al., 2009; Marumoto et al., 2009; Read et al., 2009; Singh et al., 2004; Son et al., 2009). In our studies, isolated CD15+ cells from murine oligodendroglioma, were unable to form tumors, whereas tumorigenicity of rare CD133+ tumor cells could be explained by partial overlap with the OPC marker NG2. The discrepancy in tumorigenicity between SP and NSP cells between our study and a previous report could reflect NG2+ cells in the NSP (Harris et al., 2008). Higher levels of NG2, PDGFRα, Nkx2.2, Sox2, and S100β were reported in the SP compared to the NSP, suggesting that the NSP contained fewer NG2+ tumor cells (Harris et al., 2008). We observed NG2+ cells in both SP and NSP, perhaps explaining the similar latency between these groups in our experiments.
In contrast to results using NSC-based markers, we found that NG2+ enriched for tumor formation in vivo, in both murine and human oligodendroglioma. Our data suggest that under these conditions, NG2+ cells showed significantly higher (but not exclusive) tumorigenicity compared to NG2− oligodendroglioma cells. Enzymatic treatment with accutase and/or differentiation of NG2−CD15+ cells into NG2+ cells, could contribute to the abundance of NG2+ cells, that accumulated over time in cultured NG2− fractions, and might explain why grafting large numbers of NG2− cells led to tumors in recipient mice.
Progenitor features contribute to improved outcome in oligodendroglioma
A transcriptional network in gliomas similar to either NSCs or OPCs, along with distinct chromosomal changes, may underlie differential response to alkylating agents and other therapies. We observed that murine SVZ NSC and human astrocytoma cultures were relatively resistant to treatment with TMZ. In contrast, murine OPCs and OPC-like tumor cells from transgenic mice and human oligodendrogliomas were highly sensitive. These results suggest that a progenitor origin contributes to the relative therapy-sensitive nature of oligodendroglioma. Parenchymal localization, MRI data, and immunohistochemical markers may help to select the appropriate glioma-selecte therapy, in conjunction with an OPC− or NSC-signature related to specific chromosomal aberrations.
Collectively, our data suggest that murine oligodendroglioma arise from NG2-expressing WM OPCs rather than NSCs. We demonstrate that NG2+ oligodendroglioma cells express genes and proteins associated with OPCs rather than NSCs, that NG2+ oligodendroglioma cells show limited sphere-formation, consistent with a progenitor population, and that NG2+ oligodendroglioma cells are lineage restricted. NG2-expressing cells from both mouse and human oligodendroglioma displayed high tumorigenicity and respond to both alkylating and differentiating agents. We show that these oligodendroglioma cells are neither chemo-resistant nor quiescent and suggest that a progenitor origin for these cells underlies their chemosensitivity. Our results suggest that oligodendroglioma arises from NG2-expressing cells in WM regions, and links the therapy-responsive nature of this tumor to a progenitor origin.
Experimental procedures
Mice
Mice transgenic for S100β-verbB (Weiss et al., 2003) and mice deleted for p53 (Donehower et al., 1992) (E/p53−/−, p53−/−) were maintained in a pure FVB/N background. Mice carrying the GFAP-Ha-V12-Ras transgene were maintained in a CD1 background. Genotypes were confirmed using PCR (Supplemental Experimental Procedures). All experimental procedures involving animals in this study were reviewed and approved by the Institutional Animal Care and Use Committee at UCSF.
Cell Culture
Mouse cells were isolated from brain regions using a stereo-dissection microscope (Leica). Tissues were dissociated using papain. Murine cells were cultured in neurobasal (NB) media (-A, Invitrogen) supplemented with 1xB27 supplement, 20 ng/ml FGF-2 (Peprotech), 20 ng/ml EGF (Sigma-Aldrich), 2 mM L-glutamine, and incubated at 37°C in 5% CO2. Human cells were used after review and approval from the committee on human research at UCSF and University of Rochester. Informed consent was obtained from all subjects. For all assays, human glioma cells were cultured in NBE media that is similar to NB (containing 0.5xB27 plus 0.5xN2 supplement (Gibco) rather than 1xB27 supplement alone). Cell culture based assays are described in Supplemental Experimental Procedures.
Histochemical & Immunohistochemical staining
To detect proliferating cells in mice, BrdU (Sigma-Aldrich) was injected IP at 2 h before sacrifice (50 mg/kg). Paraffin-embedded (5 μm) and fixed (4% para-formaldehyde) free-floating (30 μm) sections were used for light microscopy and fluorescent stainings. See Supplemental Experimental Procedures.
Real-time polymerase chain reaction (RT-PCR)
For details on quantitative RT-PCR see Supplemental Experimental Procedures.
Grafting experiments
FACS-sorted human glioma cells (1,000–10,000 cells/mouse) or FACS-separated mouse tumor cells (50–1,000 cells) isolated from E/p53−/− mice were intracranially grafted into anaesthetized (Ketamine and methamidine) recipient NOD-SCID and FVB/N mice.
Statistical analysis
Statistical analyzes for all experiments including more than two groups were performed using a two-way ANOVA followed by posthoc comparisons using Dunnett’s posthoc test. For experiments with two groups, we used Student’s t-test.
Supplementary Material
Acknowledgments
We acknowledge Abhijit Guha for GFAP-Ras mice, and Michael Burns, Michael Wendland, and Tim Roberts for images. Supported by the Swedish Society for Medical Research, Swedish Medical Research Council, Hjarnfonden, Sandler Postdoctoral Fellowship, and Joel A. Gingras Jr/American Brain Tumor Association Fellowship (AIP); The Sandler Opportunity Award in Basic Science (GB); NIH SPORE CA095103 and R01 GM081635 (EL); The Children’s Brain Tumor Foundation, NIH SPORE CA097257, The Brain Tumor Society, UCSF Academic Senate, Pediatric Brain Tumor, Alex’s Lemonade Stand and Samuel Waxman Cancer Research Foundations, Accelerate Brain Cancer Cure and the Burroughs Wellcome Fund (WAW).
Footnotes
Publisher's Disclaimer: This is a PDF file of an unedited manuscript that has been accepted for publication. As a service to our customers we are providing this early version of the manuscript. The manuscript will undergo copyediting, typesetting, and review of the resulting proof before it is published in its final citable form. Please note that during the production process errors may be discovered which could affect the content, and all legal disclaimers that apply to the journal pertain.
References
- Adesina AM, Nalbantoglu J, Cavenee WK. p53 gene mutation and mdm2 gene amplification are uncommon in medulloblastoma. Cancer Res. 1994;54:5649–5651. [PubMed] [Google Scholar]
- Akala OO, Park IK, Qian D, Pihalja M, Becker MW, Clarke MF. Long-term haematopoietic reconstitution by Trp53−/−p16Ink4a−/−p19Arf−/− multipotent progenitors. Nature. 2008;453:228–232. doi: 10.1038/nature06869. [DOI] [PubMed] [Google Scholar]
- Alcantara Llaguno S, Chen J, Kwon CH, Jackson EL, Li Y, Burns DK, Alvarez-Buylla A, Parada LF. Malignant astrocytomas originate from neural stem/progenitor cells in a somatic tumor suppressor mouse model. Cancer Cell. 2009;15:45–56. doi: 10.1016/j.ccr.2008.12.006. [DOI] [PMC free article] [PubMed] [Google Scholar]
- Bao S, Wu Q, McLendon RE, Hao Y, Shi Q, Hjelmeland AB, Dewhirst MW, Bigner DD, Rich JN. Glioma stem cells promote radioresistance by preferential activation of the DNA damage response. Nature. 2006;444:756–760. doi: 10.1038/nature05236. [DOI] [PubMed] [Google Scholar]
- Bleau AM, Hambardzumyan D, Ozawa T, Fomchenko EI, Huse JT, Brennan CW, Holland EC. PTEN/PI3K/Akt pathway regulates the side population phenotype and ABCG2 activity in glioma tumor stem-like cells. Cell Stem Cell. 2009;4:226–235. doi: 10.1016/j.stem.2009.01.007. [DOI] [PMC free article] [PubMed] [Google Scholar]
- Brennan C, Momota H, Hambardzumyan D, Ozawa T, Tandon A, Pedraza A, Holland E. Glioblastoma subclasses can be defined by activity among signal transduction pathways and associated genomic alterations. PLoS One. 2009;4:e7752. doi: 10.1371/journal.pone.0007752. [DOI] [PMC free article] [PubMed] [Google Scholar]
- Carro MS, Lim WK, Alvarez MJ, Bollo RJ, Zhao X, Snyder EY, Sulman EP, Anne SL, Doetsch F, Colman H, et al. The transcriptional network for mesenchymal transformation of brain tumours. Nature. 2010;463:318–325. doi: 10.1038/nature08712. [DOI] [PMC free article] [PubMed] [Google Scholar]
- Castor A, Nilsson L, Astrand-Grundstrom I, Buitenhuis M, Ramirez C, Anderson K, Strombeck B, Garwicz S, Bekassy AN, Schmiegelow K, et al. Distinct patterns of hematopoietic stem cell involvement in acute lymphoblastic leukemia. Nat Med. 2005;11:630–637. doi: 10.1038/nm1253. [DOI] [PubMed] [Google Scholar]
- Chang A, Nishiyama A, Peterson J, Prineas J, Trapp BD. NG2-positive oligodendrocyte progenitor cells in adult human brain and multiple sclerosis lesions. J Neurosci. 2000;20:6404–6412. doi: 10.1523/JNEUROSCI.20-17-06404.2000. [DOI] [PMC free article] [PubMed] [Google Scholar]
- Dawson MR, Polito A, Levine JM, Reynolds R. NG2-expressing glial progenitor cells: an abundant and widespread population of cycling cells in the adult rat CNS. Mol Cell Neurosci. 2003;24:476–488. doi: 10.1016/s1044-7431(03)00210-0. [DOI] [PubMed] [Google Scholar]
- Ding H, Roncari L, Shannon P, Wu X, Lau N, Karaskova J, Gutmann DH, Squire JA, Nagy A, Guha A. Astrocyte-specific expression of activated p21-ras results in malignant astrocytoma formation in a transgenic mouse model of human gliomas. Cancer Res. 2001;61:3826–3836. [PubMed] [Google Scholar]
- Donehower LA, Harvey M, Slagle BL, McArthur MJ, Montgomery CA, Jr, Butel JS, Bradley A. Mice deficient for p53 are developmentally normal but susceptible to spontaneous tumours. Nature. 1992;356:215–221. doi: 10.1038/356215a0. [DOI] [PubMed] [Google Scholar]
- Ducray F, Idbaih A, de Reynies A, Bieche I, Thillet J, Mokhtari K, Lair S, Marie Y, Paris S, Vidaud M, et al. Anaplastic oligodendrogliomas with 1p19q codeletion have a proneural gene expression profile. Mol Cancer. 2008;7:41. doi: 10.1186/1476-4598-7-41. [DOI] [PMC free article] [PubMed] [Google Scholar]
- Durand B, Gao FB, Raff M. Accumulation of the cyclin-dependent kinase inhibitor p27/Kip1 and the timing of oligodendrocyte differentiation. EMBO J. 1997;16:306–317. doi: 10.1093/emboj/16.2.306. [DOI] [PMC free article] [PubMed] [Google Scholar]
- Fan QW, Specht KM, Zhang C, Goldenberg DD, Shokat KM, Weiss WA. Combinatorial efficacy achieved through two-point blockade within a signaling pathway-a chemical genetic approach. Cancer Res. 2003;63:8930–8938. [PubMed] [Google Scholar]
- Fiano V, Ghimenti C, Schiffer D. Expression of cyclins, cyclin-dependent kinases and cyclin-dependent kinase inhibitors in oligodendrogliomas in humans. Neurosci Lett. 2003;347:111–115. doi: 10.1016/s0304-3940(03)00615-3. [DOI] [PubMed] [Google Scholar]
- Geha S, Pallud J, Junier MP, Devaux B, Leonard N, Chassoux F, Chneiweiss H, Daumas-Duport C, Varlet P. NG2+/Olig2+ Cells Are the Major Cycle-Related Cell Population of the Adult Human Normal Brain. Brain Pathol. 2009 doi: 10.1111/j.1750-3639.2009.00295.x. [DOI] [PMC free article] [PubMed] [Google Scholar]
- Gobert RP, Joubert L, Curchod ML, Salvat C, Foucault I, Jorand-Lebrun C, Lamarine M, Peixoto H, Vignaud C, Fremaux C, et al. Convergent functional genomics of oligodendrocyte differentiation identifies multiple autoinhibitory signaling circuits. Mol Cell Biol. 2009;29:1538–1553. doi: 10.1128/MCB.01375-08. [DOI] [PMC free article] [PubMed] [Google Scholar]
- Gonzalez-Perez O, Romero-Rodriguez R, Soriano-Navarro M, Garcia-Verdugo JM, Alvarez-Buylla A. Epidermal growth factor induces the progeny of subventricular zone type B cells to migrate and differentiate into oligodendrocytes. Stem Cells. 2009;27:2032–2043. doi: 10.1002/stem.119. [DOI] [PMC free article] [PubMed] [Google Scholar]
- Hachem S, Aguirre A, Vives V, Marks A, Gallo V, Legraverend C. Spatial and temporal expression of S100B in cells of oligodendrocyte lineage. Glia. 2005;51:81–97. doi: 10.1002/glia.20184. [DOI] [PubMed] [Google Scholar]
- Hachem S, Laurenson AS, Hugnot JP, Legraverend C. Expression of S100B during embryonic development of the mouse cerebellum. BMC Dev Biol. 2007;7:17. doi: 10.1186/1471-213X-7-17. [DOI] [PMC free article] [PubMed] [Google Scholar]
- Harris MA, Yang H, Low BE, Mukherjee J, Guha A, Bronson RT, Shultz LD, Israel MA, Yun K. Cancer stem cells are enriched in the side population cells in a mouse model of glioma. Cancer Res. 2008;68:10051–10059. doi: 10.1158/0008-5472.CAN-08-0786. [DOI] [PMC free article] [PubMed] [Google Scholar]
- Ivkovic S, Canoll P, Goldman JE. Constitutive EGFR signaling in oligodendrocyte progenitors leads to diffuse hyperplasia in postnatal white matter. J Neurosci. 2008;28:914–922. doi: 10.1523/JNEUROSCI.4327-07.2008. [DOI] [PMC free article] [PubMed] [Google Scholar]
- Johansson FK, Brodd J, Eklof C, Ferletta M, Hesselager G, Tiger CF, Uhrbom L, Westermark B. Identification of candidate cancer-causing genes in mouse brain tumors by retroviral tagging. Proc Natl Acad Sci U S A. 2004;101:11334–11337. doi: 10.1073/pnas.0402716101. [DOI] [PMC free article] [PubMed] [Google Scholar]
- Khayal IS, McKnight TR, McGue C, Vandenberg S, Lamborn KR, Chang SM, Cha S, Nelson SJ. Apparent diffusion coefficient and fractional anisotropy of newly diagnosed grade II gliomas. NMR Biomed. 2009;22:449–455. doi: 10.1002/nbm.1357. [DOI] [PMC free article] [PubMed] [Google Scholar]
- Levison SW, Goldman JE. Both oligodendrocytes and astrocytes develop from progenitors in the subventricular zone of postnatal rat forebrain. Neuron. 1993;10:201–212. doi: 10.1016/0896-6273(93)90311-e. [DOI] [PubMed] [Google Scholar]
- Marumoto T, Tashiro A, Friedmann-Morvinski D, Scadeng M, Soda Y, Gage FH, Verma IM. Development of a novel mouse glioma model using lentiviral vectors. Nat Med. 2009;15:110–116. doi: 10.1038/nm.1863. [DOI] [PMC free article] [PubMed] [Google Scholar]
- Menn B, Garcia-Verdugo JM, Yaschine C, Gonzalez-Perez O, Rowitch D, Alvarez-Buylla A. Origin of oligodendrocytes in the subventricular zone of the adult brain. J Neurosci. 2006;26:7907–7918. doi: 10.1523/JNEUROSCI.1299-06.2006. [DOI] [PMC free article] [PubMed] [Google Scholar]
- Murayama A, Matsuzaki Y, Kawaguchi A, Shimazaki T, Okano H. Flow cytometric analysis of neural stem cells in the developing and adult mouse brain. J Neurosci Res. 2002;69:837–847. doi: 10.1002/jnr.10339. [DOI] [PubMed] [Google Scholar]
- Ogden AT, Waziri AE, Lochhead RA, Fusco D, Lopez K, Ellis JA, Kang J, Assanah M, McKhann GM, Sisti MB, et al. Identification of A2B5+CD133− tumor-initiating cells in adult human gliomas. Neurosurgery. 2008;62:505–514. doi: 10.1227/01.neu.0000316019.28421.95. discussion 514–505. [DOI] [PubMed] [Google Scholar]
- Raponi E, Agenes F, Delphin C, Assard N, Baudier J, Legraverend C, Deloulme JC. S100B expression defines a state in which GFAP-expressing cells lose their neural stem cell potential and acquire a more mature developmental stage. Glia. 2007;55:165–177. doi: 10.1002/glia.20445. [DOI] [PMC free article] [PubMed] [Google Scholar]
- Read TA, Fogarty MP, Markant SL, McLendon RE, Wei Z, Ellison DW, Febbo PG, Wechsler-Reya RJ. Identification of CD15 as a marker for tumor-propagating cells in a mouse model of medulloblastoma. Cancer Cell. 2009;15:135–147. doi: 10.1016/j.ccr.2008.12.016. [DOI] [PMC free article] [PubMed] [Google Scholar]
- Setoguchi T, Kondo T. Nuclear export of OLIG2 in neural stem cells is essential for ciliary neurotrophic factor-induced astrocyte differentiation. J Cell Biol. 2004;166:963–968. doi: 10.1083/jcb.200404104. [DOI] [PMC free article] [PubMed] [Google Scholar]
- Shoshan Y, Nishiyama A, Chang A, Mork S, Barnett GH, Cowell JK, Trapp BD, Staugaitis SM. Expression of oligodendrocyte progenitor cell antigens by gliomas: implications for the histogenesis of brain tumors. Proc Natl Acad Sci U S A. 1999;96:10361–10366. doi: 10.1073/pnas.96.18.10361. [DOI] [PMC free article] [PubMed] [Google Scholar]
- Sim FJ, Lang JK, Waldau B, Roy NS, Schwartz TE, Pilcher WH, Chandross KJ, Natesan S, Merrill JE, Goldman SA. Complementary patterns of gene expression by human oligodendrocyte progenitors and their environment predict determinants of progenitor maintenance and differentiation. Ann Neurol. 2006;59:763–779. doi: 10.1002/ana.20812. [DOI] [PubMed] [Google Scholar]
- Singh SK, Hawkins C, Clarke ID, Squire JA, Bayani J, Hide T, Henkelman RM, Cusimano MD, Dirks PB. Identification of human brain tumour initiating cells. Nature. 2004;432:396–401. doi: 10.1038/nature03128. [DOI] [PubMed] [Google Scholar]
- Son MJ, Woolard K, Nam DH, Lee J, Fine HA. SSEA-1 is an enrichment marker for tumor-initiating cells in human glioblastoma. Cell Stem Cell. 2009;4:440–452. doi: 10.1016/j.stem.2009.03.003. [DOI] [PMC free article] [PubMed] [Google Scholar]
- Stiles CD, Rowitch DH. Glioma stem cells: a midterm exam. Neuron. 2008;58:832–846. doi: 10.1016/j.neuron.2008.05.031. [DOI] [PubMed] [Google Scholar]
- Verhaak RG, Hoadley KA, Purdom E, Wang V, Qi Y, Wilkerson MD, Miller CR, Ding L, Golub T, Mesirov JP, et al. Integrated genomic analysis identifies clinically relevant subtypes of glioblastoma characterized by abnormalities in PDGFRA, IDH1, EGFR, and NF1. Cancer Cell. 2010;17:98–110. doi: 10.1016/j.ccr.2009.12.020. [DOI] [PMC free article] [PubMed] [Google Scholar]
- Vives V, Alonso G, Solal AC, Joubert D, Legraverend C. Visualization of S100B-positive neurons and glia in the central nervous system of EGFP transgenic mice. J Comp Neurol. 2003;457:404–419. doi: 10.1002/cne.10552. [DOI] [PubMed] [Google Scholar]
- Weiss WA, Burns MJ, Hackett C, Aldape K, Hill JR, Kuriyama H, Kuriyama N, Milshteyn N, Roberts T, Wendland MF, et al. Genetic determinants of malignancy in a mouse model for oligodendroglioma. Cancer Res. 2003;63:1589–1595. [PubMed] [Google Scholar]
- Zhu X, Bergles DE, Nishiyama A. NG2 cells generate both oligodendrocytes and gray matter astrocytes. Development. 2008;135:145–157. doi: 10.1242/dev.004895. [DOI] [PubMed] [Google Scholar]
Associated Data
This section collects any data citations, data availability statements, or supplementary materials included in this article.