

Abstract
We consider the adhesive interaction energy between a pair of vesicles in the strong adhesion limit, in which bending forces play a negligible role in determining vesicle shape compared to forces due to membrane stretching. Although force-distance or energy distance relationships characterizing adhesive interactions between fluid bilayers are routinely measured using the surface forces apparatus, the atomic force microscope and the biomembrane force probe, the interacting bilayers in these methods are supported on surfaces (e.g. mica sheet) and cannot be deformed. However, it is known that in a suspension, vesicles composed of the same bilayer can deform by stretching or bending, and can also undergo changes in volume. Adhesively interacting vesicles can thus form flat regions in the contact zone, which will result in an enhanced interaction energy as compared to rigid vesicles. The focus of this paper is to examine the magnitude of the interaction energy between adhesively interacting, deformed vesicles relative to free, undeformed vesicles as a function of the intervesicle separation. The modification of the intervesicle interaction energy due to vesicle deformability can be calculated knowing the undeformed radius of the vesicles, R0, the bending modulus kb, the area expansion modulus Ka, and the adhesive minimum and separation in the energy of interaction between two flat bilayers, which can be obtained from the force-distance measurements made using the above supported-bilayer methods. For vesicles with constant volumes, we show that adhesive potentials between non-deforming bilayers such as , which are ordinarily considered weak in colloidal physics literature, can result in significantly deep (>10×) energy minima due to increase in vesicle area and flattening in the contact region. If the osmotic expulsion of water across the vesicles driven by the tense, stretched membrane in the presence of an osmotically active solute is also taken into account, the vesicles can undergo additional deformation (flattening), which further enhances the adhesive interaction between them. Finally, equilibration of ions and solutes due to the concentration differences created by the osmotic exchange of water can lead to further enhancement of the adhesion energy. Our result of the progressively increasing adhesive interaction energy between vesicles in above regimes could explain why suspensions of very weakly attractive vesicles may undergo flocculation and eventual instability due to separation of vesicles from the suspending fluid by gravity. The possibility of such an instability is an extremely important issue for concentrated vesicle-based products and applications such as fabric softeners, hair therapeutics and drug delivery.
1. Introduction
Vesicle suspensions are employed in many important applications and products such as fabric softeners, drug delivery and hair therapeutics. The concentration of vesicles (dispersed phase volume fraction) in these applications is high by design for a variety of reasons. Unfortunately, increasing the vesicle concentration is accompanied by a host of issues that would otherwise be unimportant or absent at lower concentrations. One serious issue is the stability or integrity of commercial products that are made from such suspensions over time. At high vesicle concentrations, the frequency of collisions that bring vesicles within the range of non-hydrodynamic interactions increases. If these non-hydrodynamic interactions are attractive, these collisions may lead to adhesion and thus the potential for flocculation and formation of large aggregations. If the vesicles are not neutrally buoyant with respect to the surrounding medium, these aggregates will separate from the suspending fluid, either in the form of a cream at the top of the container or a sediment at its bottom, and the product fails.
A first step towards understanding vesicle-vesicle interactions in complex dispersions is to understand the force-distance/energy distance relationships between its constituent bilayers in a medium identical to the suspending fluid in the dispersions. The atomic force microscope (AFM), the biomembrane force probe (BFP) and the surface forces apparatus (SFA) are three methods commonly used to measure the interactions between bilayers and provide force-distance relationships. A comprehensive discussion of these measurement techniques is available in the review by Leckband and Israelachvili 1. For example, the Surface Forces Apparatus (SFA) 2, 3 provides a precise measurement of the force as a function of the separation distance D between a pair of lipid bilayers that are supported on a solid (mica) substrate. Although these measurements are made using a cross-cylinder configuration (locally equivalent to two spherical surfaces or a spherical surface against a flat surface), the Derjaguin approximation allows the measured force to be converted to the interaction potential between two planar bilayers separated by the same distance 4, which we denote as WP (DP). Here, the subscript P indicates that the quantity is associated with a planar bilayer. For future reference, we will denote the minimum attractive potential as , and refer to it as the “adhesion potential”, and denote the corresponding separation distance as . Note that if just the adhesion potential is required, it can be measured by several techniques such as reflection interference contrast microscopy 1, 5, freeze fracture microscopy 6, optical microscopy 7, 8 or quartz crystal microbalance techniques 9–11.
Given WP (DP), we can calculate the force between two vesicles of any shape again using the Derjaguin approximation. The result, for two spherical (i.e. undeformed) vesicles of equal radius R0, and separated by a gap width DS along the line of centers, is FS = πR0 WP (DS). We can integrate the force between the spheres to get the total energy of interaction, US, between the spheres as
| (1.1) |
In this case, the subscript S indicates variables associated with spherical (undeformed) vesicles, and πR0 DS can be viewed as a characteristic area of interaction between the spheres. Due to the adhesive interaction between the spheres, the interaction energy US will also exhibit a negative minimum at some separation, which we denote as . If the adhesive interaction between the vesicles is weak, this interaction energy can be less than kT. For example, we shall later be concerned with the depletion attraction between cationic vesicles induced by non-adsorbing polymers. A typical value for in this case is 10−4 mJ/m2 at a separation of , and the interaction energy for a 1 μm vesicle is only 0.6 kT at room temperature.. In such situations, it is tempting to assume that thermal agitation will maintain the vesicles in a dispersed state, so that the vesicle suspension is stable against flocculation.
It is important to realize, however, that the bilayers in the SFA and other related methods (e.g. AFM, BFP) are supported on rigid surfaces (e.g. mica) and the approximation (1.1) only corresponds to the energy between two undeformed spherical vesicles12, such as shown in figure 1(a). We know that the bilayers that make up vesicles are fluid and deformable above the main phase transition temperature, and therefore, could presumably stretch or bend at the vesicle-vesicle separation corresponding to the energy minimum between two flat bilayers [see figure 1(b)], thus increasing the contact area and consequently the favorable energy of interaction. The interaction energy in Eq. (1.1), therefore, represents a lower bound on the interaction energy between two vesicles. Previous theoretical analyses of adhesion have considered both vesicle-vesicle interactions 6, 13–17 and vesicle-surface interactions 7, 18–29, but only for the limit in which bending energies are either comparable or dominant compared to the stretching energy. In the latter case, the area of the vesicles was assumed to be constant. The elastic stretching energy, which arises from non-zero area strains of the vesicles, was ignored, and the total energy of the vesicles only contained contributions from the bending energy and the adhesion energy. Seifert and Lipowsky 19, 20, 30 have examined this limit in detail. A key result of their work is a condition based upon the reduced volume of the vesicle (the ratio of the vesicle volume to the volume of a sphere with area equal to that of the vesicle) and the dimensionless adhesion potential , which distinguishes cases when the vesicle adheres to a surface from those in which it does not (here, kb is the bending modulus).
Figure 1.

The adhesion of (a) two rigid, spherical vesicles in solution, (b) two elastic deformable vesicles in solution.
In this manuscript, we consider vesicle adhesion for cases when the elastic stretching energy plays a dominant role. Previous studies suggest that this occurs in the so-called in the ‘strong-adhesion’ limit, which, as defined by Evans 31, occurs when w ≫ 1. For strong (electrostatic) adhesion potentials, , the parameter w is much greater than unity for vesicles as small as a few tens of nanometers and for bending moduli up to 10 kT s in magnitude. However, even small adhesion potentials in the context of soft matter, such as the value cited earlier, we can get large values for w, provided the vesicle radius is large enough and/or the bending modulus is small. In fact, experimental evidence that we shall discuss later suggests that the bending modulus may play an unimportant role, even for w = O(1).
In the strong-adhesion limit, the bending energy associated with overall changes in the shape of the vesicle can be ignored, and the vesicles can be assumed to be in the form of spherical caps facing each other, analogous to the Young-Dupré limit for drops. In this case, however, the elastic stretching energy of the vesicles generally cannot be ignored.
We consider two cases in our analysis of vesicle-vesicle adhesion in section 2: vesicles of constant volume, and vesicles that are osmotically equilibrated with the surroundings by loss of water when an osmotically active solute is present in the interior and the exterior of the vesicles. As we shall see, the constant volume case is relevant to short times in the “collision” between two vesicles, whereas the osmotically equilibrated case occurs on a longer time scale, assuming that the vesicles remain held together by the constant volume adhesion force. In describing the osmotically-induced deflation, we differ from previous works in performing a mechanical force balance by equating the Laplace pressure difference across the bilayer to the osmotic pressure difference, instead of adding an osmotic energy term 7, 20. Thus, both the area (due to stretching) and the volume (due to deflation) of the vesicle are allowed to change in our calculations.
A key result of our analysis is that, in spite of the positive elastic stretching energy, two vesicles prefer energetically to be in the adhered state as opposed to being free, unbound, individual vesicles, i.e. there is no minimum threshold adhesion potential required to induce adhesion. This is unlike the weak adhesion limit (w ≤ 1) where sufficiently strong bending elasticity can prohibit the adhesion of vesicles19, 20, 30. Therefore, in the strong adhesion limit, the unbinding of vesicles from the adhered state is governed by the ratio of the absolute magnitude of the difference between the total energy in the adhered state and the total energy in the free, unbound state relative to the characteristic thermal energy kT.
In section 3, we consider some modifications of the model presented in section 2, and also discuss its limitations. We analyze the effect of leakage of the osmotically-active solute across the bilayer (which occurs over much longer time scales), and the effect of multiple, surrounding vesicles on the adhesion energy and the area strain of the vesicles. In section 4, we compare our theory with experimental observations for a system of cationic vesicles in the presence of a non-adsorbing polymer. Our findings are summarized in section 5.
It is important to emphasize that we only consider the equilibrium situation for adhered vesicles. We make no mention of the dynamics of the collision process that leads to this equilibrium. We recognize that this is an important topic, especially since the evolution of the adhesion energy will be shown to be time-dependent. This is, however, beyond the scope of the current paper, and is the subject of an ongoing investigation in our group.
2. Adhesion between two equal sized vesicles
In this section, we consider the adhesive interaction between two axisymmetric, equal-sized spherical vesicles composed of the same single lipid, placed opposite to each other as shown in figure 1(a). The vesicles have an undeformed radius R0, and stretching and bending moduli Ka and kb respectively. Adhesion causes each vesicle to deform and interact over a planar region of area Af with the interaction potential WP (DP), as shown in figure 1(b).
In the supplementary material #1 provided with this paper, we write the total energy of the vesicles as a sum of contributions from adhesion, vesicle stretching, vesicle bending and repulsion due to suppression of thermal undulations of the bilayers in the contact region. If we express the expression for the total energy in dimensionless terms, it can be shown that the bending energy will play a negligible role in determining the shape of the adhered vesicles in the strong adhesion limit, w ≫ 1, and that the undulation repulsion energy can be neglected relative to the characteristic adhesion energy if the dimensionless parameter,
| (2.1) |
Here, C is a scalar constant determined by Monte Carlo simulations to be 0.0632. In this case (i.e. w ≫ 1 and ξ ≪ 1), the total energy of the vesicles can be approximated as comprising only the elastic stretching energy and the adhesion energy
| (2.2) |
The double limit w ≫ 1 and ξ ≪ 1 can be expressed in terms of upper and lower bounds for the bending modulus of the bilayer
| (2.3) |
Clearly, large adhesion potentials will provide a broader range of bending moduli for which the above condition, and, therefore, equation (2.1), is justified. Even for a relatively weak adhesion potential such as , with and R0 = 1 μm (these numerical values can result from attraction induced by a non-adsorbing polymer in the solution, as discussed in section 2.3), the bounds on the bending modulus are 3 kT and 37 kT at room temperature, which represents a reasonably broad (and experimentally reported) range of bending moduli over which Eq. (2.2), and thus the calculations reported below are clearly valid.1
It is important to note, however, that there is quite strong evidence in the literature which suggests that the neglect of the bending energy in the total energy of the vesicle may be valid even when the parameter w is order 1 or smaller. One example is the freeze-fracture images of egg-lecithin vesicles interacting with an adhesive, van der Waals potential, reported in the paper of Bailey et al. 6 and reproduced here in figure 2(a). The sharp turns in the contact region of the vesicles suggest that bending restrictions are playing a minimal role in determining the shape of the vesicle. Also, interpretation of the experimental images with an energy model that ignores the bending energy of the vesicles resulted in values of the adhesion potential that were in reasonable agreement with prior work34. The radius of the vesicles in the concerned figure is 25 nm, the bending modulus of egg lecithin bilayers has been measured to be 2 × 10− 19 J 35–37, and the adhesion potential between egg-lecithin bilayers from previous work 34 is 0.02 mJ/m2. The parameter for these vesicles is, therefore, 0.06, which is much smaller than 1.
Figure 2.
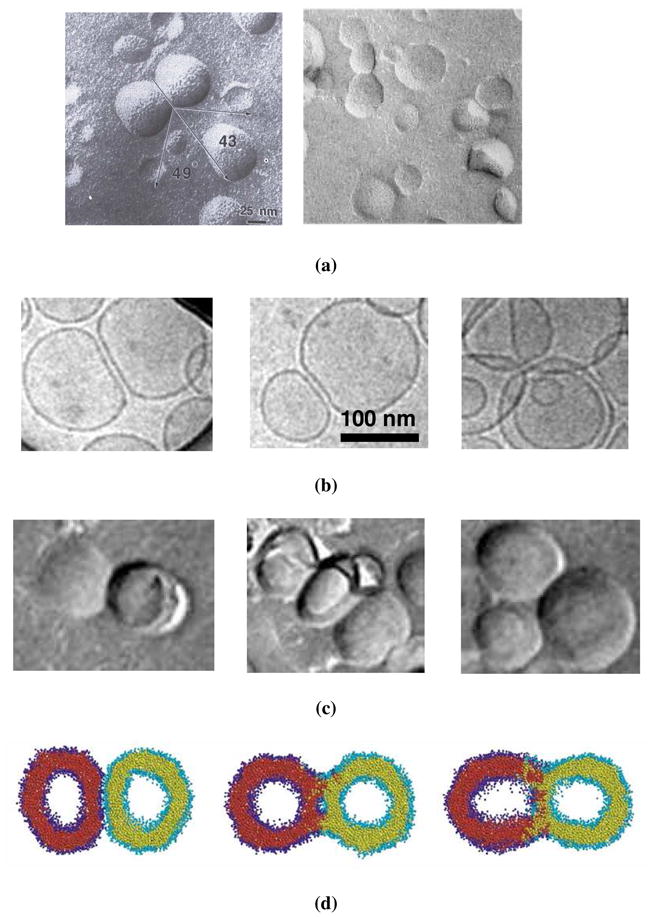
(a) Freeze-fracture TEM images of egg-lecithin vesicles from Bailey et al.6 (b) Cryo-TEM after 1 week of 57:40:3 DSPC/Cholesterol/PEG(2000)-DSPE vesicles with 0.80 mole % biotin-X-DPPE after addition of 2.5 mg-lipid/ml avidin, from Kennedy38 (c) Freeze-fracture TEM images after 3 days of same suspension as in subfigure (b) (d) Computer simulation images40 of two osmotically swollen vesicles that fuse via a ‘breakthrough’ stage.
The experimental images of Kennedy38 appear to provide further evidence for the neglect of the bending energy for quite modest values of w. In this work, vesicles were prepared using a mixture of 59:40:1 DSPC/Cholesterol/PEG(2000)-DSPE vesicles with 1.16 mole % biotin-X-DPPE, and adhesion was induced by the addition of 2.5 mg-lipid/ml avidin. Cryo-TEM and freeze-fracture TEM imaging was performed on the suspension, and the resulting images are presented in figure 2(b) and 2(c) respectively. It can again be seen that the adhering vesicles appear to have no difficulty bending through large angles with a high radius of curvature around the edge of the contact region, in spite of the fact that the small size of these vesicles, combined with the fact that vesicles with cholesterol are known to have high bending moduli (about 20 kT) 36, 39, indicate quite small values for w. Similar conclusions can be drawn from the computer simulations of Stevens et al. 40 [see figure 2(d)].
We are not aware of a prior resolution in the literature to the discrepancy discussed above. It could arise due to an incorrect value of the bending modulus2 used in the calculation of w. Another possible explanation for observation of the sharp kinks in spite of the large bending moduli is that at the sharp edges in the contact region, the lipid chains and headgroups undergo an intermonolayer rearrangement to minimize the edge energy or line tension. This line tension presumably cannot be described by a continuum-based bending energy theory41, because the length scale of these kinks is comparable to molecular length scale. It is possible that the line energy brought about by the molecular rearrangement is much smaller than the prediction of the energetic penalty from a continuum-based theory, and this could lead to the discrepancy discussed above. The area expansion energy formalism is not affected by this argument, since it is inherently both a macroscopic and nanoscopic energy, i.e., derivable from molecular-scale models42. It is not clear to us, therefore, for what precise range of w bending energy can be neglected in determining the adhesive interactions between vesicles, but it appears clear that we are being conservative in suggesting that our analysis applies only when w ≫ 1.
To determine the energy in Eq. (2.2), we need the original and deformed volumes (V0 and V) and surface areas (A0 and A) of each vesicle. For the spherical cap geometry in figure 1(b), these may be written as
| (2.4) |
| (2.5) |
| (2.6) |
| (2.7) |
Here Ac is the area of the curved region of the spherical cap. Note that the expressions for V0 and A0 suggest that the initial reduced volume is unity, i.e. the vesicle is initially a perfect sphere before adhesion. The effect of any initial non-sphericity of vesicles (v < 1) is explored in section 3.
At equilibrium, the system energy defined in Eq. (2.2) is minimized, and this yields the general equilibrium condition
| (2.8) |
A solution of (2.8) for the equilibrium contact angle θequil (and thus the equilibrium energy Uequil) can be obtained using (2.4)–(2.7) and a constraint on the vesicles’ volumes.
In the following analysis, we impose two different types of volume constraints, each relevant to different times in the “collision” process between two vesicles. First, in section 2.1, we assume that the vesicle volumes are constant (i.e. V = V0), and examine the resulting calculation with a physical example in section 2.2. Second, in section 2.3, we assume that the vesicles have volumes corresponding to osmotic equilibration with the surrounding medium by exchange of water, and revisit the example in section 2.2 in this new limit.
2.1. Vesicles with constant volumes
In this subsection, we consider times longer than the time required to deform the vesicles and squeeze the suspending fluid from the gap between the vesicles, but much shorter than the time required for permeation of water (or solutes) across the bilayer. We will explicitly describe these time scales in section 3. At these times, it is reasonable to assume that the two adhering vesicles conserve their volumes, i.e. V = V0. From the constancy of the vesicle volumes, the radius of the deformed vesicle may be deduced as a function of the contact angle from Eq. (2.4) as
| (2.9) |
Given this result, we can now calculate A and Af in terms of R0, and the relationship (2.2) can be written in the form
| (2.10) |
Equation (2.10) gives the total free energy of interaction between two elastically deformable vesicles as a function of the area expansion modulus, the adhesion energy between the vesicles based on the adhesion potential between two plane bilayers, and the contact angle.
An important consequence of (2.10) is that, in the absence of any bending restrictions, the adhered state is always energetically preferred as compared to the (zero reference energy) state of two free vesicles. This can be seen by performing a regular perturbation expansion of the energy for small values of the contact angle:
| (2.11) |
Thus, for small contact angles, the favorable adhesion energy always exceeds the elastic penalty for adhesion. This is fundamentally different from the result of Seifert and Lipowsky19 for small w, where the bending restrictions can effectively prohibit the bound state. Although the adhered state is energetically preferred, it will only lead to long-lived vesicle pairs if the energy difference between the free and adhered states is greater than the characteristic thermal energy kT.
The equilibrium configuration of the vesicles (namely the equilibrium contact angle that completely determines the shape of the spherical cap vesicles) can be determined by setting the differential of (2.10) with respect to θ equal to zero.
| (2.12) |
This is analogous to Young’s equation for the contact angle of a liquid droplet on a surface. Equation (2.12) gives the equilibrium contact angle for two vesicles for a given Ka and . It may be noted that the equilibrium contact angle is independent of the vesicle radius. The equilibrium energy Uequil is given by determining the equilibrium contact angle from equation (2.12) and incorporating it into equation (2.10).
For arbitrary values of and Ka, it is generally necessary to solve (2.12) numerically, and we shall show numerical results shortly. However, an approximate expression for the equilibrium contact angle can be obtained using an asymptotic analysis. Using a typical value of Ka = 100 mJ/m2, the ratio is 10−2 or less, for adhesion potentials as large as 1 mJ/m2 – it is typically a small parameter. A perturbation expansion of (2.12) in terms of the small parameter yields an asymptotic approximation for the equilibrium contact angle as
| (2.13) |
A corresponding expression for the equilibrium adhesion energy between two elastic vesicles can be obtained by substituting (2.13) into (2.10:
| (2.14) |
The corrections in equations (2.13) and (2.14) involving the dimensionless adhesion potential were taken from Tordeux et al.21. Note that the equilibrium adhesion energy is proportional to the square of the undeformed radius of the vesicles. This is in marked contrast to the case where vesicles are treated as undeformed spheres for which the interaction energy increases linearly with their radius [see Eq. (1.1)]. Another important observation in Eq. (2.14) is the relative insensitivity of the equilibrium energy to the area expansion modulus. An order of magnitude decrease in Ka only produces a factor of two enhancement in the equilibrium energy.
The ratio of this asymptotic estimate of the equilibrium energy relative to the characteristic thermal energy kT is
| (2.15) |
One can see that even in the strong adhesion limit, where w ≫ 1, a value of Uequil that is of the order of the characteristic thermal energy kT, can occur if the adhesion potential is small enough and the bending modulus is of order kT 43. Therefore, in the constant volume limit, for small adhesion potentials, the probability of separation of a pair of adhered vesicles (doublets) by thermal energy fluctuations is high.
2.2. A numerical example of the effect of deformability on the interaction between two vesicles in the constant volume limit
To get an idea of the effect of deformability on the interaction between vesicles, let us consider the simple example of two identically charged bilayers interacting with each other in solution at room temperature in the presence of a non-adsorbing polymer. An adhesive interaction can result between these bilayers due to a balance between electrostatic repulsion and the attraction induced by depletion of the non-adsorbing polymer between the bilayers. Subject to the assumptions discussed below, the interaction potential between two such flat bilayers can be written as
| (2.16) |
To model the electrostatic repulsion, we have used the weak-overlap approximation that decays exponentially over the Debye length κ−1 and has a prefactor E04. The depletion-induced attraction arises from the osmotic pressure corresponding to the bulk polymer concentration ρp, which when integrated over the gap produces the energy term in Eq. (2.16) that is linear in the bilayer-bilayer separation DP. The factor [1− H (DP − Rg)] in this energy term, where H is the Heaviside step function, ensures that this energy is identically zero if the separation is greater than the radius of gyration Rg. To simplify our discussion, we have chosen to ignore the van der Waals attraction between the bilayers relative to the electrostatic repulsion, an assumption that is valid for the low salt concentrations and separation distances considered below.
The interaction energy between two spherical (i.e. non-deformed) vesicles of radius R0 that are separated by a distance DS can be obtained from Eq. (2.16) using the Derjaguin approximation [see Eq. (1.1)] as
| (2.17) |
To illustrate the magnitude of this term, and thus provide a basis for comparison with the case in which the vesicles deform, we consider a specific system. Specifically, we assume that the salt in the solution is CaCl2. The prefactor E0 of the energy of electrostatic repulsion per unit area is, then, given by 4
| (2.18) |
where [CaCl2] is the molar concentration of CaCl2, and ψ0 is the surface potential in mV. The Debye length, κ, is given by 4
| (2.19) |
In all the calculations in this subsection and the next, we will assume [CaCl2] = 4.5 mM (κ−1 = 2.6 nm), ψ0=100 mV, ρp = 0.01 mM, Rg = 35 nm (corresponding to a relatively large molecular weight polymer) and R0 = 1 μm. For these parameters, the energy of interaction between two 1 micron radius spherical vesicles is shown in figure 3(a) (red curve). As may be seen, the minimum of the energy of interaction is approximately 1 kT at a separation .
Figure 3.

Calculations of the total interaction energy between two rigid vesicles, and two elastic vesicles deforming at constant volume and with osmotically-induced permeation of water for shown as a function of the vesicle-vesicle separation Df [defined in Eq. (2.20)] in subfigure (a), and as a function of the contact angle θ in subfigure (b). The calculations for the constant volume (blue) and osmotically equilibrated (green) curves assume R0 = 1 μm, Ka =100 mJ/m2 and and [CaCl2] = 4.5 mM. The red curve in subfigure (a) is the interaction between two spherical 1 micron radii vesicles as a function of the end-end separation using calculations described in the text.
Let us now examine the effect of the deformability of the vesicles on the interaction energy for the same system. The minimum in the interaction potential between flat bilayers, , is obtained from Eq. (2.16) as −1.52 × 10− 4 mJ/m2, and occurs at the separation . Assuming an area expansion modulus of 100 mJ/m2, we can study, using Eq. (2.10), the variation of the energy of interaction U between two vesicles deforming at constant volume in the form of spherical caps as a function of the contact angle, and an intervesicle separation Df [measure of the center to center distance as shown in figure 1(b)], which is defined as
| (2.20) |
We have plotted the energy of interaction in figure 3. The minimum of this energy curve is −2.6 kT, which is greater than the energy minimum predicted for rigid vesicles, but importantly, is greater than the characteristic thermal energy. Due to the small value of the adhesion potential , the energy minimum occurs for a relatively small contact angle of 10°, and a small area strain ΔA/A0 of 5 × 10− 5.
We will see in the next subsection that osmotic equilibration in the presence of an osmotically active solute can further improve the favorable interaction between vesicles, thus reducing the probability of doublets being separated into individual vesicles.
2.3. Osmotically equilibrated deflated vesicles
We observed in the previous subsection that, in order to reduce the total energy of interaction, the vesicles prefer to flatten at the separation corresponding to the energy minimum as they adhere. The deformation, however, results in an increase in the area of each vesicle, and thus an increase in the pressure within each vesicle due to the tension developed in the membrane. This increased pressure will drive a flow of water across the bilayers, which will reduce the volumes of the vesicles. If the vesicles and the surrounding medium contain pure water only and no impermeable solutes, the expulsion of water will continue until the two vesicles collapse. However, in the presence of an osmotically active solute both within and outside the vesicles, this outflow is accompanied by an increase in the osmotic pressure within the vesicles due to an increase in the interior salt concentration. Ultimately, the outflow of water stops when the osmotic pressure difference across the bilayer is equal to the Laplace pressure difference due to the stretched bilayer. This balance can be written mathematically as
| (2.21) |
In the above equation, Π is the osmotic pressure difference across the bilayer, given by
| (2.22) |
where Nav is the Avogadro number. In writing the osmotic pressure difference in Eq. (2.22), we have assumed that the osmolarity inside and outside the vesicles before the expulsion of water is the same, equal toρ0. (In section 3.4, we will consider a case where this is not true). We have also assumed that the outflow of water from the vesicles into the surrounding medium does not affect the ambient osmolarity. This assumption is valid only for dilute vesicle suspensions where the dispersed phase volume fraction of vesicles is small. In Eq. (2.21), σ is the tension developed in the membrane resulting from elastic stretching of the bilayer, which we again approximate as
| (2.23) |
Using (2.22) and (2.23), Eq. (2.21) may now be simplified to
| (2.24) |
where the dimensionless parameter β is
| (2.25) |
The parameter β may be interpreted as the Laplace pressure relative to the osmotic pressure in the vesicles. One can see that in the limit β → 0, the restriction in Eq. (2.24) reduces to V = V0, i.e. the vesicles maintain their initial volumes. In this limit, the penalty of osmotic pressure relative to the Laplace pressure is too high to allow a change of volume. Therefore, the constant volume results for the contact angle and minimum energy from the previous section carry over in this limit. In the opposite limit of β ≫ 1, strong deflations of the vesicles are permissible before the osmotic effects can arrest the loss of water. The energy minimum will thus occur for much larger deformations/contact angles. We will examine these two limits in greater detail shortly.
Upon substitution of the expressions for the volumes and areas from equations (2.4) through (2.7), Eq. (2.24) then becomes
| (2.26) |
Given this relation between R/R0 and θ, we can determine the energy U from Eq. (2.2), and also the equilibrium contact angle θequil from equation (2.8) [and thus the equilibrium energy Uequil from Eq. (2.2)]. However, in contrast with the constant volume case where an explicit expression for R/R0 is possible, the relationship between R/R0 and θ in Eq. (2.26) is implicit (a fourth order polynomial in R/R0). Although analytic progress is possible in the asymptotic limits β ≪ 1 and β ≫ 1, in general we have to resort to a numerical method to determine θequil and Uequil as functions of β.
To explore the magnitude of the change in the energy of interaction due to the deformation caused by osmotic equilibration via exchange of water, let us revisit the example of two bilayers interacting via a combination of electrostatic repulsion and polymer depletion-induced attraction considered in the previous section, with the same values of all the parameters. The ambient osmolarity resulting from the CaCl2 in the solution isρ0 = 4.5 × 3 = 13.5 mM. The energy in the osmotically equilibrated case is shown in figure 3 (green curves) as functions of the intervesicle separation Df and the contact angle θ. As may be seen, the equilibrium energy Uequil in this limit is approximately 7.5 kT, which is about three times the energy in the constant volume limit. Therefore, once two vesicles under the solution conditions corresponding to the calculations adhere to each other in the osmotically equilibrated limit, the probability of separation of the resulting doublet by thermal energy is much lower than in the constant volume limit. The equilibrium contact constant angle θequil = 17° and the area strain (ΔA/A0)equil = 9 × 10− 5 are also greater than the volume case.
2.4. Results for constant volume and osmotically equilibrated vesicles for arbitrary
The equilibrium quantities θequil and Uequil can be calculated for any general adhesion potential , i.e. not just resulting from a polymer-depletion induced attraction. In figure 4, we have shown the equilibrium energy, contact angle and area strain as contour maps versus the adhesion potential and the vesicle radius R0 for both the constant volume case (left column) and the osmotically equilibrated case (right column) using an ambient osmolarity of 13.5 mM. These equilibrium quantities were calculated numerically. In the constant volume subfigures, the upper boundary of the parametric region where vesicle bending energy cannot be ignored in the definition of the total energy of interaction is shown with a white line for a bending modulus of 5 kT. The details of the derivation of this demarcating line are presented in supplementary material #2.
Figure 4.

Contour plots of the equilibrium energy [subfigures (a) and (b)], the equilibrium contact angle [subfigures (c) and (d)] and equilibrium area strain [subfigures (e) and (f)] as functions of the adhesion potential and the initial vesicle radius R0. The figures in the left and the right columns are for the constant volume and osmotically equilibrated cases respectively. The parameters employed for the calculations are the same as in figure 3.
It can be seen that the equilibrium energies and contact angles in the osmotically equilibrated case are always higher than those in the constant volume case [figure 4(a) through figure 4(d)]. The scaling for the equilibrium energy predicted for the constant volume case in Eq. (2.14) is also apparent in figure 4(a), where every constant energy curve approximately follows a vs. behavior. For the constant volume case, the contact angle is independent of the vesicle radius, and this is clear from figure 4(c). For osmotically equilibrated vesicles, θequil is a decreasing function of the vesicle radius R0 for a constant [see figure 4(d)], and this is consistent with the predictions of θequil for the asympototic limits: β ≪ 1 and β ≫ 1.
It is instructive to examine the area strain experienced by the vesicles as a result of the deformation. For the constant volume case, the area strain at equilibrium is independent of the vesicle size. However, if we allow for osmotic equilibration of water, the area strain depends on the parameter β, which depends on the vesicle size. In general, as shown in figure 4(f), the area strain shows a maximum with the vesicle radius. This may be understood by examining the changes in the areas of the planar and curved regions of the spherical cap. For infinitely large vesicles (β → 0), the Laplace pressure due to stretching of the bilayer is small relative to the osmotic pressure difference. In this limit, the area strain asymptotes to the area strain in the constant volume limit. For large but finite vesicle radii (β ≪ 1), there is additional stretching and adhesive interaction of the bilayer relative to the constant volume case induced by deflation. The planar contact area increases strongly, but the area of the curved region of the vesicle decreases weakly; hence the area strain increases.
| (2.27) |
For smaller vesicles (large β), the stronger deflation increases contact area, but at the same time, it also significantly decreases the area of the curved region, resulting in smaller area strains. Therefore, the total area strain decreases with increase in β, as shown by the following asymptote:
| (2.28) |
For reasonable values of and Ka, the area strain in the large β limit is always smaller than the area strain in the β = 0 limit, the ratio being . The above two expressions differ from the result of Seifert 20, who used a scaling argument to suggest that the area strain should always scale as ; equations (2.27) and (2.28) show, however, that the scaling actually depends on β.
For small adhesion potentials (e.g. and , the area strains are small [less than 0.01, see figures 4(e) and 4(f)]. However, for a high adhesion potential of , the area strain, as shown in figure 4(f), can be greater than 0.02. This value is comparable to the critical area strain of rupture for bilayers, which can range from 0.02 to 0.0544. For such large adhesion potentials, large vesicles (greater than a micron) or small vesicles (smaller than 200 nm) could remain unruptured, while intermediate-sized vesicles may undergo rupture upon adhesion. Seifert 20 has provided a scaling argument for adhesion leading to rupture in the context of vesicles adhering to surfaces, but the scaling result in this paper is different from our prediction for small and intermediate β, and the area strain is not numerically computed.
3. Discussion
In the previous section, we observed that the inclusion of vesicle stretching at the separation corresponding to the adhesive minimum between two flat rigid bilayers can increase the adhesion energy significantly. In this section, we will discuss some implications and limitations of the calculations presented above.
3.1. Time scales for the constant volume and osmotically equilibrated regimes of adhesive interaction
The calculations presented in the previous section assumed that the vesicles were either of constant volume or osmotically equilibrated with the surrounding medium by exchange of water. Here, we comment on the time scales of these regimes of adhesive interaction. Based on experimental evidence of adhesion of vesicles to a surface 45, the adhesion process between two vesicles may be considered as a sequence of the following events:
-
Squeezing of the suspending fluid from the gap between the vesicles at constant vesicle volumes to produce a flattened contact region and a film thickness at which the adhesive attraction sets in.
We can perform a scaling analysis to determine the time tV required to squeeze suspending fluid out of thin film between the vesicles for a constant force F applied on the spheres. If the two vesicles are deformed into spherical caps during the drainage processIi.e. the shape of the film is a flat disk), the drainage time has been estimated 46 via a scaling analysis to be(3.1) Here, μ is the viscosity of the suspending fluid. Inherent in the estimate (3.1) is the assumption that changes in the shape of the vesicle will occur on time scales that are short compared to the time to push fluid out of the thin film. An estimate of the intrinsic time scale for vesicle deformation is(3.2) We shall see shortly that tD • tV.
In the absence of flow and any externally applied forces, the only mechanism that brings the vesicles close to each other before any non-hydrodynamic forces can act is Brownian motion, the force corresponding to which scales as kT/R0. In this case, the drainage time in Eq. (3.1) becomes(3.3) -
Slow leakage of water from the stretched and pressurized vesicles resulting in increased deformation and flattening in the contact region.
This occurs over the time scale tW given by(3.4) Here PW is the permeability of water across the membrane, which has a value of the order of 10−4 cm/s
For a 1 μm vesicle, using Ka = 100 mJ/m2, ΔA/A0 ≈ 10− 3 and μ = 0.001 Pa-s, these time scales are tV ≈ 0.001s, tD ≈ 0.001 ms and tW ≈ 1s. The time scales tD and tW are well separated, and the quasi-steady shape approximation upon which (3.1) or (3.3) is based is clearly valid.
3.2. Long time effects
For time scales much longer than tW, several other effects need to be considered before the adhesive energy can be predicted. There can be exchange of surfactant molecules between the outer and inner monolayers of the bilayers (flip-flop), and between the vesicles and the solution 4. There can also be exchange of solutes across the bilayer. In the previous section, we noted that the vesicles deflate by losing water in order to osmotically equilibrate with the surrounding medium. Since V is less than V0 after the deflation, the osmolarity of any osmotically-active solute inside each vesicle is ρ0V0/V, which is greater than the ambient osmolarity ρ0. This jump in solute concentration across the vesicle bilayer will lead to a gradual loss of solute from the vesicles, and a corresponding loss of water (and thus volume) to maintain the osmotic balance. The time scale required for mass transfer of solutes across the bilayer, tS, is given by the scaling
| (3.5) |
where PS is the permeability of the solute, which can be six to eight orders of magnitude smaller than that of water 47, 48. For a 1 micron vesicle, this time scale would be equal to several days. For times longer than tS, this solute concentration difference across the vesicle bilayer will result in the loss of solute by diffusion from the vesicle into the surrounding medium. Therefore, the osmolarity of the solute within each vesicle decays with time. We designate this osmolarity as ρinV0/V, where ρin is measured with respect to the original volume V0. Before solute diffusion commences in this regime, ρin is simply equal to ρ0.
Due to the large separation of time scales between tW and tS, the loss of solute is accompanied by a loss of water (and thus a decrease of V) so that the osmotic balance is maintained at every moment. This balance is represented by
| (3.6) |
Here, we assume that the external or ambient osmolarity ρ0 is not changed by the exchange of ions (and water). This implicitly assumes that the vesicle suspension is dilute. Eq. (3.6) may be written in the alternative form
| (3.7) |
where we recall from Eq. (2.25) that β ≡ 2Ka/ρ0Nav kTR0 and α is defined as
| (3.8) |
The parameter α is initially 1, but over time, it slowly decays towards zero. As α decreases with time, it is clear from Eq. (3.7) that the volume V of each vesicle has to be progressively smaller than the initial volume V0 to maintain the osmotic balance. Indeed, in a certain sense, α may also be regarded as a measure of time; values of α close to 1 suggest short times, while small values of α can be regarded as asymptotically long times relative to tS.
As before, due to the implicit relationship between R/R0 and θ in Eq. (3.7), we employ a numerical approach to obtain θequil and Uequil with time. These results are shown in figure 5. One can see that even for a low adhesion potential of , a loss of only 10% of the total osmotically active solute within the vesicle is sufficient to make the energy minimum deeper by several kT s, and the change is larger for higher . This change is accompanied by a corresponding strong increase in the contact angle. Ultimately, when α → 0, the vesicles are completely deflated and the adhesive interaction between the two vesicles occurs over , which is half of the total surface area of vesicles. In fact, in this limit, as also suggested by Seifert 20, it is presumable that all the deflated vesicles in the suspension will stack up one on top of the other, leading to an adhesive energy twice that predicted in the limit of β ≫ 1 per vesicle pair. This is reminiscent of the adhesive stacking of red blood cells in the blood to form a Rouleaux 13, 49.
Figure 5.

The equilibrium interaction energy between the vesicles and the equilibrium contact angle as a function of α [see Eq. (3.8)] for [subfigure (a)] and [subfigure (b)].
Finally, after exchange of ions and surfactant molecules, the system will tend to form a lamellar phase containing stacks of bilayers, in which the energy per surfactant molecule will be , where a0 is the headgroup area of the surfactant molecule.
We can appreciate the increase in the adhesion strength over time by examining the energy per surfactant molecule in the vesicles in the adhered state over the various time scales. We have summarized this information for the example discussed in section 2 in table 1 using a headgroup area per molecule of 55 Å2. The table shows that the interaction energy per surfactant molecule increases with time, ultimately reaching a value of 1.05 × 10− 5kT/molecule when the surfactant molecules equilibrium assume an lamellar configuration. This energy is a factor of 95 and 36 over the energy per molecule expected in the constant volume and osmotically equilibrated regimes (without solute exchange) respectively. Thus, even after osmotic equilibration, which occurs over relatively short time scales (tW ~ 1 sec), the energy per molecule can increase quite considerably by moving through a series of equilibria corresponding to solute and surfactant exchange, but over much longer time scales.
Table 1.
Variation of the interaction energy per surfactant molecule for the various stages of adhesion arranged in the increasing order of time scales.
| State | Interaction energy per surfactant molecule (kT/molecule) |
|---|---|
| Undeformed spherical vesicles | 4.4 × 10 − 8 |
| Constant volume (tV ≪ t ≪ tW) | 1.1 × 10− 7 |
| Osmotically equilibrated (tW ≪ t ≪ tS) | 3.2 × 10− 7 |
| Highly deflated vesicles (α ≪ 1) after solute exchange (t ≫ tS) stacked up one over the other | 5.2 × 10− 6 |
| Lamellar phase (surfactant exchange) | 1.05 × 10− 5 |
It is important to emphasize that the calculations in this section, and the preceding calculations, represent only the quasi-equilibrium states that could be realized by a pair of colliding vesicles. A more complicated problem is the dynamics of the formation of doublets, given that there is a finite time scale associated with each of these states; constant volume, osmotically equilibrated, and finally the collapsed state after all of the solute transport has occurred. If the energy associated with any of these states is less than kT, there is a good chance that a doublet initially formed by collision due to Brownian motion will come apart due to thermal fluctuations (or by collision with another vesicle) before it finally reaches a state with an energy that exceeds kT, where the lifetime would expect to be much longer. To be more explicit requires a dynamic calculation based either on a population balance model, with the appropriate aggregate formation and breakup rates, or via a more sophisticated Brownian dynamics simulation. This type of simulation is a subject of current research in our group.
3.3 Effect of vesicle reduced volumes less than unity
Until now, we have assumed that the reduced volume of the undeformed vesicle, given by
| (3.9) |
is unity, i.e. the vesicle is initially a sphere. In this subsection, we consider vesicles with reduced volumes less than 1. For v < 1, the vesicle already has some excess area, which allows it to deform into a spherical cap with a contact angle θ0 without any stretching. This contact angle θ0 is related to the reduced volume by the expression20, 21
| (3.10) |
As v is reduced from 1, the contact angle θ0 and therefore the contact area increases, which leads to an increase in the interaction energy as may be seen in figure 6(a) [black curve].
Figure 6.

The (a) equilibrium contact angle and (b) equilibrium energy as functions of the initial contact angle θ0 or the reduced volume v corresponding to the unstressed vesicle. For these calculations, R0 = 500 nm, , Ka = 100 mJ/m2 and ρ0 = 13.5 mM.
The equilibrium interaction energy and contact angle with the inclusion of area stretching for the constant volume (blue curves) and osmotically equilibrated (green curves) cases are shown in figure 6. The total contact area is now a sum of the unstressed contact area and the additional area due to bilayer stretching3. As the reduced volume is decreased from 1, the fraction of the total contact area that requires bilayer stretching diminishes, and the difference between the energy with and without bilayer stretching (black and blue curves, or the black and green curves) decreases. The same trend applies for the contact angle. The increase in the equilibrium interaction energy due to stretching is thus significant only for reduced volumes close to 1.
3.4. Effect of vesicle prestress
We have heretofore considered vesicles that are initially stress-free, i.e. free vesicles in the suspending medium have zero membrane stress. Let us now consider vesicles whose membranes are initially stressed with a membrane tension of σ0, which is equal to
| (3.11) |
The area strain in the above equation is defined with respect to the area Ai corresponding to an unstressed vesicle, while the area A0 is the area of the undeformed, prestressed vesicle, and is greater than Ai. It is straightforward to derive an expression for the total energy of a pair of pre-stressed, adhering vesicles (see supplementary material #3). The result is
| (3.12) |
In figure 7, we have compared the energy as a function of the contact angle for initially stress-free and prestressed vesicles, for , 500 nm radius vesicles and an ambient osmolarity of 13.5 mM. It may be seen in figure 7(a) that even for a prestress corresponding to an area strain of only 0.1% (A0/Ai) = 1.001, the energy minimum reduces sharply in magnitude from about 13 kT for the stress-free vesicles to approximately 2 kT for the prestressed vesicles. Figure 7(b) shows that the equilibrium interaction energy and contact angle also decrease strongly with vesicle prestress.
Figure 7.

(a) The variation of the total interaction energy with contact angle for initially stress-free vesicles (blue curve), and vesicles with a prestress corresponding to an area strain of 0.001 (b) The equilibrium interaction energy (red curve) and the equilibrium contact angle (black curve) as functions of the area strain corresponding to the prestress of the vesicles. The calculations are performed for R0 = 500 nm, , Ka = 100 mJ/m2 and ρ0 = 13.5 mM.
To understand this, consider an asymptotic expansion of the total energy for small values of the contact angle
| (3.13) |
The above equation shows that the elastic stretching contribution arising from the vesicle prestress scales as θ4 to leading order, while the leading order elastic stretching term (even in the absence of prestretch) scales as θ8. Therefore, for prestressed vesicles, the positive energy contribution arising from vesicle stretching influences the total energy at much smaller contact angles compared to initially unstressed vesicles. This leads to lower equilibrium energies, contact angles and area strains for prestressed vesicles. A second feature of the interaction energy elucidated by Eq. (3.13) is that even for prestressed vesicles, the total interaction energy always decreases with contact angle for small θ (i.e. adhesion is always favored based upon energy considerations compared to a pair of separated vesicles). This is because of the stronger, θ2 dependence of the adhesion energy on the contact angle as opposed to the θ4 dependence of the elastic energy for prestressed vesicles.
A key result that arises from this analysis is that if the vesicle prestress is large enough (but smaller than the rupture stress, of course), the equilibrium energy can be below the characteristic thermal energy kT. This suggests that for stability against aggregation, it is desirable to have slightly prestressed vesicles in the suspension as opposed to initially stress-free vesicles. This could be achieved by inflating the vesicles via a hypotonic osmotic pressure difference. Of course, this comment entails the assumption that Helfrich repulsion is not important for unstressed vesicles, because the membrane tension from prestressing can suppress Helfrich repulsion and induce adhesion33.
3.5. Further remarks
Finally, there are several additional limitations and remarks concerning the theoretical developments in Section 2, that should be made before we go on to consider the comparison between our predictions and experimental observations in the next section.
First is the inherent assumption, in considering the two vesicles to be spherical caps, that the deformation is axisymmetric; no non-axisymmetric modes are allowed either for the contact region or the curved region of the vesicle. We believe that this is a reasonable assumption in the limit of negligible bending energy and dominant stretching energy, where the energy minimum is dictated by essentially having the area strains for a given volume of the vesicle that would provide a balance between the stretching and adhesion energies. Considering that the sphere is the geometry which provides the minimum area for a given volume, it is presumable that the spherical cap would be the geometry that would provide the smallest curved area and largest contact area for a given vesicle volume and area strain. This, however, remains to be rigorously proved. It is known that when the bending energy becomes important, the optimum shape is not a spherical cap 19, 21. In fact, for interactions between two vesicles with smallreduced volumes, the optimum shape is not even axisymmetric; the contact region is closer in shape to a sigmoid as was shown by Ziherl and Svetina 25.
Second, we have assumed that , as measured in the SFA for example, is a material property of the lipid bilayer and is independent of the degree of deformation (stretch) and solution conditions during the measurement. It is well known, however, that increases as the membrane tension increases due to an increase in the hydrophobic attraction 6, and, furthermore, that changes in solution conditions can also influence (as well as the elastic modulus Ka). No satisfactory models are available to model the hydrophobic attraction - SFA measurements indicate that it has different behaviors over long and short ranges, and also varies from one experimental measurement technique to another50. This effect may be important, and actually important enough perhaps to explain the discrepancy between theory and experiment that will be discussed in the next section, as well in the work of other authors6, in which theoretical predictions of adhesion are generally weaker than what is observed experimentally.
A third limitation of the analysis in section 2 is that we have considered only a pair of equal-sized vesicles. We can easily extend this simplistic analysis to unequal-sized vesicles placed opposite to each other, or for a single vesicle surrounded by multiple vesicles, and this extension is discussed with an example in Supplementary Material #4. In figure 8, we present the interaction of a single vesicle at the center with n surrounding vesicles, all of radii 500 nm. The separation between the center vesicle and each surrounding vesicle is taken to be 8 nm. As the number of surrounding vesicles increases, the equilibrium energy increases, as expected. However, the equilibrium contact angle for the center vesicle (and also the surrounding vesicles) goes down. This is because the energy decrease obtained by reducing the contact angle and accommodating an additional vesicle outweighs the increase in energy brought about by decreasing the contact angle (and hence the contact area). It is interesting to note that in figure 8(a), the maximum number of vesicles allowed in the osmotically equilibrated case around the center vesicle is smaller than the number of vesicles in the constant volume case. This is because, the equilibrium contact angle for the center vesicle is larger due to the stronger adhesion in the osmotically equilibrated regime, and fewer vesicles can surround the center vesicle. Also, as explained earlier, the osmotically equilibrated case takes a longer time scale to achieve than the constant volume case. Thus, it is presumable that a given vesicle in a vesicle cluster formed by adhesion is likely to have a smaller co-ordination number at low volume fractions, where the time scale between two pair collisions is large. At higher volume fractions, due to the higher frequency of collisions between the vesicles, the co-ordination number of a vesicle in a vesicle cluster would probably be larger. It is also notable as the number of surrounding vesicles increases, the area strain experienced by the center vesicle increases monotonically, and even for the moderate adhesion energy per unit area used in figure 8 ( ), the area strain exceeds 0.01 for the maximum number of vesicles that can be accommodated around the center vesicles. As mentioned before, such large area strains could result in bilayer rupture and fusion.
Figure 8.


The variation of the equilibrium energy, contact angle and the area strain as functions of the number of vesicles (n) adhered to a given vesicle. All variables superscripted with a hat are for surrounding vesicles, while those without a superscript are for the center vesicle. For all the calculations, R0 = R̂0 = 500 nm, , 8 nm and ρ0 = 13.5 mM. In each subfigure, the constant volume and osmotically equilibrated cases are shown with blue and green curves respectively. In subfigures (b) and (c), the solid curves (either color) represent the results for the center vesicle, while dashed curves represent the results for each surrounding vesicle.
4. Comparisons with experimental observations
In this section, we discuss our experimental observations in vesicle suspensions containing a non-adsorbing cationic polyelectrolyte polyDADMAC [figure 9(a)], and examine if the model developed in this paper can predict the stability of these suspensions.
Figure 9.

Structures of (a) the cationic polyelectrolyte polyDADMAC, and (b) the surfactant used in SFA experiments.
Materials and Methods
An aqueous buffer of the salt CaCl2 and the non-adsorbing polymer polyDADMAC [Figure 9(a)] (Sigma-Aldrich, 20wt% in water, 400kD-500kD) was prepared. The concentration of CaCl2 in the mixture was 4.5 mM, while concentration of the polymer was 0.25 wt%. Deionized water, produced from a Milli-Q® UF unit and having a resistivity of 18.2M3-cm, was used to prepare all solutions. The pH was adjusted to 3.3 by adding HCl. Cationic vesicle suspensions were prepared by mixing the aqueous buffer with a concentrated ethanolic surfactant solution (85% by wt. lipid, 15% by wt. ethanol) at a high temperature. The surfactant used was N,N-dimethyl-2-(CE)-octadec-9-enoyloxy)-N-(2-oleoyloxy)ethyl) ethaniminium chloride, whose structure is given in Figure 9(b). The bilayer formed by this surfactant is above the main transition temperature at room temperature.
The suspension was extruded through 800 nm pore size filters (Millipore, Isopore Membrane Filters, 0.1μm VCTP), 8 times, and the suspension thus obtained was kept standing in a sealed cylinder and monitored with a camera for 4 days. The suspension was also periodically sampled and examined by video and Cryo-TEM microscopies.
The mechanical properties of the bilayer corresponding to the conditions above were measured using the method of micropipette aspiration of giant unilamellar vesicles. The details of the method are provided in Supplementary Material #5.
Results and Discussion
Before we discuss the result of our experiment, we will present what we expect to observe in this experiment using our model. To implement our model, we require the values of and Ka. A recent SFA study51 shows that the interactions between the cationic surfactant under study in the presence of polyDADMAC are well represented by a combination of van der Waals attraction, a modified electrostatic repulsion and the depletion-induced attraction. The calculations are identical to those presented in section 2.2, except that the electrostatic repulsion term has to be modified according to the approach of Tadmor et al.52. Using this combination of interactions, the value of the adhesion potential is calculated to be about 1 × 10− 4 mJ/m2 for 0.25 wt% of the polyelectrolyte. The value of the area expansion modulus Ka from micropipette aspiration was 100 mJ/m2. For these parameters, the equilibrium energy of interaction between two 400 nm radius vesicles is only about 1.5 kT even in the osmotically equilibrated regime, as suggested by Figure 4(b). Actually, if bending considerations are included, this equilibrium energy should be lower. Therefore, one would expect that under these conditions, vesicles smaller in radius than 400 nm should be stable against aggregation and flocculation.
However, this is not what we found in the experiment. As seen in figure 10, the suspension was observed to flocculate, gel and collapse under gravity within a day [figure 10(a)], and there is ample evidence of vesicle-vesicle adhesion in the video microscopy [figure 10(b)] and cryo-TEM images [figure 10(c)], clearly highlighting the underlying phenomenon of depletion flocculation. If higher polymer concentrations are used, the depletion-induced attraction becomes stronger, and the gel collapse of the resulting vesicle aggregate network occurs much faster.
Figure 10.

(a) Visual observation of the creaming of vesicles (white phase) to the top of the container after 2 days. The diameter of the cylinder is 1 inch. (b) Video microscopy image of the vesicle suspension extracted from the center of the cylinder in subfigure (a) immediately after the preparation of the suspension. (c) Cryo-TEM images of the vesicles immediately after extrusion. The scale bar on the top left image in white represents a length of 100 nm.
There could be several reasons for this disagreement. We have ignored the increased attraction that occurs between two vesicles due to the hydrophobic effect when their membranes are under tension, which would lead to underestimation of the adhesion potential between the vesicles. Also, the calculations presented in figure 4(b) disregard the slowly evolving, stronger interaction that arises following the exchange of solute (CaCl2) across the bilayer. Indeed, the maximum interaction energy for 800 nm vesicles, completely deflated and stacked one over the other would be about . This would suggest that this suspension could be unstable over long periods of time of the order of several days, and recall that our experimental time was about 4 days.
The resolution of this disagreement between theory and experiment is a subject of ongoing research in our group.
5. Conclusions
We have elucidated a simple method, along with analytical expressions in certain limits, to compute the adhesive interaction between fluid spherical vesicles, given the area expansion modulus of the bilayer and the interaction potential between fixed or supported bilayers measured, for example, using the surface forces apparatus. Since the energetic penalty of stretching is a weaker function of the area strain as compared to the adhesive interaction energy, stretching of the bilayer at the separation corresponding to the adhesive minimum leads to an enhancement in the contact area and therefore to a stronger adhesive interaction energy. More importantly, stretching develops a membrane tension that results in expulsion of water across the bilayer until osmotic equilibrium is achieved. This causes the vesicles to deflate, which further increases the contact area and the total adhesive interaction energy. Finally, the solute expulsion from the vesicles driven by the concentration gradient established by the osmotic equilibration of water causes the vesicles to deflate even further, leading to strong augmentation of the adhesive interaction energy. We have ignored bending energy of the vesicles and Helfrich repulsion between the vesicles in our analysis, and provide the range of bending moduli for which these approximations are valid.
This paper thus underlines the importance of accounting for vesicle deformation and stretching while considering vesicle-vesicle interactions. For example, suspensions perceived as stable against aggregation based on calculations for rigid vesicles could actually be unstable because of the enhancement in the interactions arising from the deformation of vesicles in the contact region. An important result that emerges from the calculations presented in this paper is, therefore, that the interaction energy and the strength of adhesion between two vesicles are both time-dependent. Over time, adhered vesicles can lose water to increase the contact area and therefore increase the energy of interaction, thus making the adhesion stronger. Thus, vesicle suspensions which are stable or weakly unstable (equilibrium energy of a few kT s) in the constant volume regime can become strongly unstable in the osmotic exchange regime, as may be ascertained from figures 3(a) and 3(b). The time scale for the formation of aggregates can be predicted by employing a population balance model or a Brownian dynamics simulation. These simulations require the interaction energy-distance relationship between interacting deformable vesicles, and not rigid vesicles. We have developed these relationships in this paper, and dynamic simulations based on these interaction potentials are currently being explored in our group.
The deformation of the vesicles renders the interaction energy more sensitive to the vesicle radius; for rigid vesicles, the interaction energy scales directly as the vesicle radius, while for deformable spherical vesicles, it scales as the square of the vesicle radius, which is significantly stronger. The contact force for separating the adhered vesicles, however, is same as that for undeformed, spherical vesicles. The analysis also yields the area strain experienced by the vesicles, which, in general, increases with the adhesion potential. In the constant volume regime, the area strain is independent of the vesicle radius, but in the osmotically equilibrated regime, it shows a maximum for intermediate vesicle sizes. For large adhesive potentials, the area strain becomes comparable to the characteristic rupture strain of bilayers, suggesting the adhesive interaction may lead to vesicle rupture and fusion. We also demonstrated that the adhesion to multiple vesicles amplifies the area strain experienced by a given vesicle, which, again, could lead to rupture/fusion. Finally, prestressed vesicles show smaller equilibrium interaction energies and contact angles as opposed to initially stress free vesicles. The enhancement of the equilibrium interaction energy due to stretching becomes weaker as the vesicle reduced volume departs from unity.
The theory developed in this paper was applied to an experiment in which a cationic vesicle suspension was observed to aggregate and phase separate via a delayed gel collapse due to the presence of a high molecular weight, cationic, non-adsorbing polymer in the suspending fluid at very low concentrations. Calculations based on SFA measurements provided the adhesion potential for flat bilayers. Surprisingly, calculations using the theory developed in this paper suggest that vesicle deformability can barely account for adhesion of the larger vesicles (~800 nm and larger) observed in the experiment; the theory predicts that smaller vesicles should be stabilized against aggregation by thermal energy, a prediction that disagrees with experimental observations. We are currently investigating this discrepancy.
Supplementary Material
Acknowledgments
We acknowledge Procter and Gamble for the materials and funding that made this research possible. This work was also supported by NIH Grant R01GM076709 and NSF grant CBET-0968105. We acknowledge Dr. Bruce Murch, Dr. Matt Lynch, Dr. Christopher Stoltz and Dr. Pierre Verstraete for suggesting/motivating the problem, for useful discussions, and for the DLVO calculator used to calculate the adhesion potentials in the manuscript. We thank Htet Khant, who provided the cryo-TEM images in Figure 13. We are also grateful to Dr. Mike Kennedy for the freeze-fracture TEM and cryo-TEM images in figure 2.
Footnotes
Note, however, that the lower bound on the bending modulus presented above is conservative. It will be seen in the following subsections that the equilibrium states under consideration are characterized by bilayers in tension, and any lateral tension in the bilayers suppresses repulsion due to thermal undulations33
For example, the bending modulus for the egg-lecithin bilayers has measured by examining the thermal fluctuation spectrum of giant vesicles36, and by pulling tethers out of giant vesicles; this relatively rapid deformation process yields a bending modulus of 50 kT for egg lecithin bilayers, but it is possible that this procedure yields a bending modulus that is much greater than the equilibrium value of bending modulus expected for fluid bilayers with zero spontaneous curvature.
For convenience, in this section we will use the phrase “bilayer stretching” to refer to changes in the bilayer area that require an expenditure of energy to overcome the stretching modulus.
References
- 1.Leckband D, Israelachvili JN. Intermolecular forces in biology. Q Rev Biophys. 2001;34(2):105–267. doi: 10.1017/s0033583501003687. [DOI] [PubMed] [Google Scholar]
- 2.Israelachvili JN, Min Y, Akbulut M, Alig A, Carver G, Greene GW, Kristiansen K, Meyer E, Pesika N, Rosenburg K, Zeng H. Recent advances in the surface forces apparatus (SFA) technique. Rep Prog Phys. 2010;73(3):036601. [Google Scholar]
- 3.Israelachvili JN, Adams GE. Measurement of Forces Between Two Mica Surfaces in Aqueous Electrolyte Solutions in the Range 0–100 nm. J Chem Soc Faraday Trans I 74. 1978;74:975–1001. [Google Scholar]
- 4.Israelachvili J. Intermolecular and surface forces. 2. Academic Press; San Diego: 1992. [Google Scholar]
- 5.Sackmann E, Bruinsma RF. Cell adhesion as a wetting transition? Chemphyschem. 2002;3:262–269. doi: 10.1002/1439-7641(20020315)3:3<262::AID-CPHC262>3.0.CO;2-U. [DOI] [PubMed] [Google Scholar]
- 6.Bailey SM, Chiruvolu S, Israelachvili JN, Zasadzinski JAN. Measurements of forces involved in vesicle adhesion using freeze-fracture electron microscopy. Langmuir. 1990;6(7):1326–1329. [Google Scholar]
- 7.Gruhn T, Franke T, Dimova R, Lipowsky R. Novel method for measuring the adhesion energy of vesicles. Langmuir. 2007;23(10):5423–5429. doi: 10.1021/la063123r. [DOI] [PubMed] [Google Scholar]
- 8.Puech PH, Brochard-Wyart F. Membrane tensiometer for heavy giant vesicles. Eur Phys J E. 2004;15:127–132. doi: 10.1140/epje/i2003-10157-8. [DOI] [PubMed] [Google Scholar]
- 9.Reimhult E, Hook F, Kasemo B. Intact vesicle adsorption and supported biomembrane formation from vesicles in solution: Influence of surface chemistry, vesicle size, temperature, and osmotic pressure†. Langmuir. 2003;19:1681–1691. [Google Scholar]
- 10.Pignataro B, Steinem C, Galla HJ, Fuchs H, Janshoff A. Specific adhesion of vesicles monitored by scanning force microscopy and quartz crystal microbalance. Biophys J. 2000;78:487–498. doi: 10.1016/S0006-3495(00)76611-2. [DOI] [PMC free article] [PubMed] [Google Scholar]
- 11.Liebau M, Bendas G, Rothe U, Neubert RHH. Adhesive interactions of liposomes with supported planar bilayers on QCM as a new adhesion model. Sensors and Actuators B. 1998;47:239–245. [Google Scholar]
- 12.Israelachvili JN. Thin Film Studies Using Multiple-Beam Interferometry. J Colloid Int Sci. 1973;44(2):259–272. [Google Scholar]
- 13.Ziherl P. Aggregates of two-dimensional vesicles: Rouleaux, sheets, and convergent extension. Phys Rev Lett. 2007;99(12):128102. doi: 10.1103/PhysRevLett.99.128102. [DOI] [PubMed] [Google Scholar]
- 14.Xu GK, Feng XQ, Zhao HP, Li B. Theoretical study of the competition between cell-cell and cell-matrix adhesions. Phys Rev E. 2009;80(1):011921. doi: 10.1103/PhysRevE.80.011921. [DOI] [PubMed] [Google Scholar]
- 15.Evans EA. Analysis of adhesion of large vesicles to surfaces. Biophys J. 1980;31(3):425–432. doi: 10.1016/S0006-3495(80)85069-7. [DOI] [PMC free article] [PubMed] [Google Scholar]
- 16.Brochard-Wyart F, de Gennes P. Unbinding of adhesive vesicles. C R Physique. 2003;4:281–287. [Google Scholar]
- 17.Nam J, Santore MM. The adhesion kinetics of sticky vesicles in tension: The distinction between spreading and receptor binding. Langmuir. 2007;23(21):10650–10660. doi: 10.1021/la7017709. [DOI] [PubMed] [Google Scholar]
- 18.Seifert U. Self-consistent theory of bound vesicles. Phys Rev Lett. 1995;74(25):5060–5063. doi: 10.1103/PhysRevLett.74.5060. [DOI] [PubMed] [Google Scholar]
- 19.Seifert U, Lipowsky R. Adhesion of vesicles. Phys Rev A. 1990;42(8):4768–4771. doi: 10.1103/physreva.42.4768. [DOI] [PubMed] [Google Scholar]
- 20.Seifert U. Configurations of fluid membranes and vesicles. Adv Phys. 1997;46(1):13. [Google Scholar]
- 21.Tordeux C, Fournier JB, Galatola P. Analytical characterization of adhering vesicles. Phys Rev E. 2002;65(4):041912. doi: 10.1103/PhysRevE.65.041912. [DOI] [PubMed] [Google Scholar]
- 22.Das S, Qiang D. Adhesion of vesicles to curved substrates. Phys Rev E. 2008;77(1):011907. doi: 10.1103/PhysRevE.77.011907. [DOI] [PubMed] [Google Scholar]
- 23.Lv C, Yin Y, Yin J. Geometric theory for adhering lipid vesicles. Colloid Surf B. 2009;74:380–388. doi: 10.1016/j.colsurfb.2009.06.030. [DOI] [PubMed] [Google Scholar]
- 24.Smith AS, Seifert U. Vesicles as a model for controlled (de-)adhesion of cells: a thermodynamic approach. Soft Matter. 2007;3:275–289. doi: 10.1039/b611892e. [DOI] [PubMed] [Google Scholar]
- 25.Ziherl P, Svetina S. Flat and sigmoidally curved contact zones in vesicle–vesicle adhesion. Proc Natl Acad Sci USA. 2006;104(3):761–765. doi: 10.1073/pnas.0607633104. [DOI] [PMC free article] [PubMed] [Google Scholar]
- 26.Shi W, Feng XQ, Gao H. Two-dimensional model of vesicle adhesion on curved substrates. Acta Mech Sin. 2006;22:529–535. [Google Scholar]
- 27.Rosso R, Virga EG. Squeezing and stretching of vesicles. J Phys A: Math Gen. 2000;33:1459–1464. [Google Scholar]
- 28.Rosso R, Sonnet AM, Virga EG. Evolution of vesicles subject to adhesion. Proc R Soc Lond A. 2000;456:1523–1545. [Google Scholar]
- 29.Rosso R, Verani M, Virga EG. Second variation of the energy functional for adhering vesicles in two space dimensions. J Phys A: Math Gen. 2003;36:12475–12493. [Google Scholar]
- 30.Seifert U, Lipowsky R. Morphology of vesicles. In: Lipowsky R, Sackmann E, editors. Structure and dynamics of membranes: From cells to vesicles. Vol. 1 Elsevier; New York: 1995. [Google Scholar]
- 31.Evans EA. Entropy-driven tension in vesicle membranes and unbinding of adherent vesicles. Langmuir. 1991;7(9):1900–1908. [Google Scholar]
- 32.Janke W, Kleinert H. Fluctuation pressure of membrane between walls. Phys Lett A. 1986;117A:353. [Google Scholar]
- 33.Helfrich W. Tension-induced mutual adhesion and a conjectured superstructure of lipid membranes. In: Lipowsky R, Sackmann E, editors. Structure and dynamics of membranes: Generic and specific interactions. Elsevier Science; Amsterdam: 1995. pp. 691–722. [Google Scholar]
- 34.Evans EA, Metcalfe M. Free energy potential for aggregation of giant, neutral lipid bilayer vesicles by van der Waals attraction. Biophys J. 1984;46:423. doi: 10.1016/S0006-3495(84)84039-4. [DOI] [PMC free article] [PubMed] [Google Scholar]
- 35.Servuss RM, Harbich V, Helfrich W. Measurement of the curvature-elastic modulus of egg lecithin bilayers. Biochim Biophys Acta. 1976;436(4):900–903. doi: 10.1016/0005-2736(76)90422-3. [DOI] [PubMed] [Google Scholar]
- 36.Duwe HP, Kaes J, Sackmann E. Bending elastic moduli of lipid bilayers: modulation by solutes. J Phys France. 1990;51(10):945–962. [Google Scholar]
- 37.Heinrich V, Waugh RE. A piconewton force transducer and its application to measurement of the bending stiffness of phospholipid membranes. Ann Biomed Engg. 1996;24(5):595–605. doi: 10.1007/BF02684228. [DOI] [PubMed] [Google Scholar]
- 38.Kennedy M. University of California at Santa Barbara. Santa Barbara: 1998. [Google Scholar]
- 39.Evans EA, Rawicz W. Entropy-driven tension and bending elasticity in condensed-fluid membranes. Phys Rev Lett. 1990;64(17):2094–2097. doi: 10.1103/PhysRevLett.64.2094. [DOI] [PubMed] [Google Scholar]
- 40.Stevens MJ, Hoh JH, Woolf TB. Insights into the molecular mechanism of membrane fusion from simulation: Evidence for the association of splayed tails. Phys Rev Lett. 2003;91(18):188102. doi: 10.1103/PhysRevLett.91.188102. [DOI] [PubMed] [Google Scholar]
- 41.Helfrich W. Elastic properties of lipid bilayers: theory and possible experiments. Z Naturforsch C. 1973;28(11):693–703. doi: 10.1515/znc-1973-11-1209. [DOI] [PubMed] [Google Scholar]
- 42.Israelachvili JN, Mitchell DJ, Ninham BW. Theory of self-assembly of hydrocarbon amphiphiles into micelles and bilayers. J Chem Soc Faraday Trans 2. 1976;72:1525–1568. [Google Scholar]
- 43.Jung HT, Coldren B, Zasadzinski JA, Lampietro DJ, Kaler EW. The origins of stability of spontaneous vesicles. Proc Natl Acad Sci USA. 2001;98(4):1353–1357. doi: 10.1073/pnas.041420998. [DOI] [PMC free article] [PubMed] [Google Scholar]
- 44.Needham D, Zhelev DV. The mechanochemistry of lipid vesicles examined by micropipette manipulation techniques. In: Rosoff M, editor. Vesicles. Marcel Dekker; New York: 1996. pp. 373–444. [Google Scholar]
- 45.Bernard AL, Guedeau-Boudeville MA, Jullien L, di Meglio JM. Strong adhesion of giant vesicles on surfaces: Dynamics and permeability. Langmuir. 2000;16(17):6809–6820. [Google Scholar]
- 46.Ramachandran A, Leal LG. A scaling theory for the hydrodynamic interaction between a pair of vesicles or capsules. Phys Fluids. 2010;22:091702. [Google Scholar]
- 47.Marsh D. Handbook of lipid bilayers. CRC press; Boca Raton: 1990. [Google Scholar]
- 48.Deamer DW, Bramhall J. Chemistry and physics of lipids. Chem Phys Lipids. 1986;40:167–188. doi: 10.1016/0009-3084(86)90069-1. [DOI] [PubMed] [Google Scholar]
- 49.Skalak R, Zarda PR, Jan KM, Chien S. Mechanics of Rouleaux formation. Biophys J. 1981;35:771–781. doi: 10.1016/S0006-3495(81)84826-6. [DOI] [PMC free article] [PubMed] [Google Scholar]
- 50.Meyer EE, Rosenburg KJ, Israelachvili JN. Recent progress in understanding hydrophobic interactions. Proc Natl Acad Sci USA. 2006;103(43):15739–15746. doi: 10.1073/pnas.0606422103. [DOI] [PMC free article] [PubMed] [Google Scholar]
- 51.Anderson TH, Donaldson S, Zeng H, Israelachvili JN. Direct measurement of double-layer, van der Waals and polymer depletion attraction forces between supported cationic bilayers. Langmuir. 2010;26(18):14458–14465. doi: 10.1021/la1020687. [DOI] [PubMed] [Google Scholar]
- 52.Tadmor R, Hernandez-Zapata E, Chen NH, Pincus P, Israelachvili JN. Debye length and double-layer forces in polyelectrolyte solutions. Macromolecules. 2002;35(6):2380–2388. [Google Scholar]
Associated Data
This section collects any data citations, data availability statements, or supplementary materials included in this article.