

Abstract
Objectives.
To evaluate, by age, the performance of 2 disability measures based on needing help: one using 5 classic activities of daily living (ADL) and another using an expanded set of 14 activities including instrumental activities of daily living (IADL), walking, getting outside, and ADL (IADL/ADL).
Methods.
Guttman and item response theory (IRT) scaling methods are used with a large (N = 25,470) nationally representative household survey of individuals aged 18 years and older.
Results.
Guttman scalability of the ADL items increases steadily with age, reaching a high level at ages 75 years and older. That is reflected in an IRT model by age-related differential item functioning (DIF) resulting in age-biased measurement of ADL. Guttman scalability of the IADL/ADL items also increases with age but is lower than the ADL. Although age-related DIF also occurs with IADL/ADL items, DIF is lower in magnitude and balances out without causing age bias.
Discussion.
An IADL/ADL scale measuring need for help is hierarchical, unidimensional, and unbiased by age. It has greater content validity for measuring need for help in the community and shows greater sensitivity by age than the classic ADL measure. As demand for community services is increasing among adults of all ages, an expanded IADL/ADL measure is more useful than ADL.
Keywords: ADL, Age bias, IADL, Measurement
THE index of activities of daily living (ADL) counts the number of ADL a person needs help with (Katz & Akpom, 1976) and is the classic measure of the severity of need for personal assistance services (PAS) and other long-term services and supports (LTSS). The ADL comprise bathing, dressing, toileting, transferring, continence, and eating, listed in order of increasing severity of disability. To measure less severe levels of disability, Lawton and Brody (1969) introduced a complementary index based on needing help in eight instrumental activities of daily living (IADL): using the phone, grocery shopping, preparing meals, housekeeping, laundering, using transportation, taking medications, and managing finances.
ADL counts are used widely to assess adults of all ages and determine eligibility for benefits. For instance, long-term care insurance policies require needing help with two or more ADL to trigger benefits, regardless of age. Similarly, state Medicaid Home and Community-Based Services (HCBS) programs employ counts of needing help with ADL and sometimes IADL, to determine eligibility for services for adults of all ages (Tonner, LeBlanc, & Harrington, 2001). Although policy makers desire a uniform assessment tool that works well for adults of all ages (Fox-Grage, 1997; Johnston, Graves, & Greene, 2007), disability assessment can only be as uniform as the underlying measurement is. If ADL or IADL/ADL measures are biased by age, their use with adults of different ages could be misleading.
There is cause for concern. Although the index of ADL applied to adults of different ages with chronic illness (Katz, Ford, Moskowitz, Jackson, & Jaffe, 1963), no subsequent studies have examined whether it is unbiased by age. However, one study finds that a measure based on the need for help with IADL/ADL is biased by age and gender (Fleishman, Spector, & Altman, 2002). Differential item functioning (DIF) is a necessary but not sufficient condition for measurement bias. DIF occurs when population groups have significantly different probabilities of responding to an item based on measured levels of disability. Nine of the 11 IADL/ADL items studied showed significant DIF by age and gender. Needing help managing money showed the most DIF, being much less severe for younger than older men. DIF can bias measurement when it is large and directional (Hambleton, 2006). However, the result of Fleishman and colleagues does not imply that all IADL/ADL measures are age and gender biased. When DIF occurs in negative and positive directions, it can balance out, without causing measurement bias (Hambleton). A different set of items could produce a different result. Although Fleishman and colleagues suggest that bias can be adjusted for statistically, this adds a cumbersome step in practical applications, and an unbiased measure is always preferable.
A variety of factors may induce age-related DIF, starting with differences in diagnoses by age. Working-age persons are affected by developmental disabilities, early-onset chronic illnesses, and traumatic injuries (LaPlante & Carlson, 1996). Older persons have a mix of late-onset chronic illnesses and physical and cognitive degenerative processes (Hayflick, 1994) and injuries from falls. In addition, differences by age in perceptions of disability, coping and adapting, and social and physical environments can play a role (Fleishman et al., 2002).
The aim of this article was to determine whether the widely used index of ADL and an expanded measure based on 14 IADL/ADL items are unbiased by age. Both Guttman and item response theory (IRT) methods are used, providing a rare link between classic and contemporary methods (Hambleton, 2006; Hays, Brown, Brown, Spritzer, & Crall, 2006). The results have methodological and substantive implications for the measurement of need for PAS and other LTSS.
BACKGROUND
Measuring Disability
Measurement of disability is indirect, through the use of items indicating different degrees of disability. For example, needing help to eat is a more severe indicator of disability than needing help preparing a meal. A good disability measure reliably orders persons having more disability from those having less. Scalability refers to how reliably items and persons can be hierarchically ordered from low to high levels of a trait (Menzel, 1953). For a disability measure to be unbiased by age, it should have similar scalability across different age groups.
Katz’s index of ADL and Lawton and Brody’s index of IADL were found to approximate a Guttman model whereby a person’s score predicts the pattern of responses to the items reliably. Now, the field of psychometrics generally views Guttman’s model as idealistic and overly deterministic as well as poor at assessing fit (McIver & Carmines, 1981). The field of psychometrics has turned to IRT, which models responses to items probabilistically (Embretson & Reise, 2000). However, IRT models actually assume that items are not highly Guttman scalable; indeed, highly Guttman items are a limiting condition, causing IRT models to strain and ultimately break down (Andrich, 1985). This methodological issue is seldom noted in IRT analyses. However, if Guttman scalability varies by age, it could result in age-related DIF. Often, items with DIF are eliminated, but it would be a poor decision to omit items with DIF that are highly Guttman scalable for some age groups.
ADL and IADL/ADL Hierarchies
Katz suggested a pediatric development model that explained the observed Guttman-like hierarchy of the ADL (Katz & Akpom, 1976): As a child matures, the simplest activity, eating, is mastered first, then continence, transferring, toileting, dressing, and bathing, in order of increasing complexity. As a person ages, or experiences certain chronic illnesses, performance is lost in the reverse order, from bathing to eating. Katz also observed that persons recovering from some chronic illnesses regained performance in the pediatric order, from the most severe to least severe activities.
A set of items with a coefficient of scalability (CS; described subsequently) exceeding 0.6 indicates an acceptable Guttman scale, and 1.0 indicates a perfect one (Clogg & Sawyer, 1981). Studies show that ADL items scored for needing help, as Katz originally scored them, have CSs ranging from 0.65 to 0.91 (Brorsson & Asberg, 1984; Ciesla, Shi, Stoskopf, & Samuels, 1993; Lazaridis, Rudberg, Furner, & Cassel, 1994; Spector, Katz, Murphy, & Fulton, 1987; Travis & McAuley, 1990). One study reports that IADL items are also Guttman scalable (CS = 0.69) (Vittengl, White, McGovern, & Morton, 2006).
Lawton and Brody (1969) stated that IADL/ADL activities can be ordered by the complexity of neuropsychological organization involved, with physical self-maintenance activities (ADL and ambulation) being the least complex, followed by IADL, and then social activities, suggesting that IADL/ADL items could be combined in one scale. However, that would require them to be “unidimensional”—a key scalability assumption meaning that items indicate levels of the same trait. Controversy exists regarding the dimensionality of IADL/ADL items. Some suggest that ADL and IADL items are separate dimensions because the IADL involve much greater complexity of neuropsychological organization and involvement of cultural and environmental influences (Breithaupt & McDowell, 2001). A third dimension has also been suggested, composed of the cognitive IADL—operating a telephone, taking medications, and managing finances (Fitzgerald, Smith, Martin, Freedman, & Wolinsky, 1993; Ng, Niti, Chiam, & Kua, 2006; Thomas, Rockwood, & McDowell, 1998; Wolinsky & Johnson, 1991). However, Spector and Fleishman (1998) assert that the three dimensions are highly correlated and a single dimension explains most of the variance in the items. They show, using an IRT model, that the IADL/ADL items are combinable as a single measure of disability. Additional studies conclude that the physical IADL and ADL are combinable (Asberg & Sonn, 1989; Kempen & Suurmeijer, 1990).
This study addresses the question of whether the index of ADL is an age-invariant measure of disability as Katz and colleagues claimed it was. A combined IADL/ADL index is also evaluated. Because Guttman properties are evident in both sets of items, the study uses both Guttman and IRT scaling methods.
METHODS
A household sample was obtained from Phase II of the National Health Interview Survey on Disability (Adams & Marano, 1995; Benson & Marano, 1998). Adults who had any disability—broadly defined—during 1994–1995 in Phase I were reinterviewed approximately a year later, resulting in 25,470 interviews, with an overall response rate of 85%. A modified version of the Older Americans Resources and Services instrument (Fillenbaum, 1988) was employed, containing questions about difficulty and needing help in 16 activities, including 5 ADL, walking, getting outside, 8 IADL, and incontinence. Incontinence was too rare to investigate by age and is not included. Heavy housework was shown by IRT analysis not to lie on the same dimension as the other items, as observed elsewhere (Fleishman et al., 2002), and was omitted. The remaining 14 IADL/ADL items are listed in Table 1. For each activity, a lead-in question is asked about having any difficulty due to a health problem. Whether the person does not do an IADL activity for reasons other than health is also ascertained to accommodate gender-role differences in performing the IADL. Next, if a person does the activity, whether the person receives hands-on help, supervision, or standby help is ascertained. If no help is received, follow-up questions are asked whether help is needed. It is the need for help (whether received or not) that is the outcome studied.
Table 1.
Prevalence of Needing Help in Activities Among Noninstitutionalized Adults With Disabilities, by Age
| Age group |
||||||||
| 18+ | 18–34 | 35–44 | 45–54 | 55–64 | 65–74 | 75–84 | 85+ | |
| Unweighted sample counts | Number of persons | |||||||
| Total sample (N) | 25,470 | 3,924 | 4,025 | 3,996 | 3,773 | 4,731 | 3,683 | 1,338 |
| Needing help with 1+ IADL/ADL | 7,604 | 642 | 901 | 1,027 | 1,163 | 1,460 | 1,532 | 879 |
| Needing help with 1+ ADL | 3,493 | 232 | 407 | 458 | 517 | 655 | 732 | 492 |
| Weighted population size | Number of persons (thousands) | |||||||
| Total population | 41,231 | 7,306 | 6,681 | 6,475 | 5,860 | 7,143 | 5,663 | 2,103 |
| Needing help with 1+ IADL/ADL | 11,854 | 1,170 | 1,431 | 1,596 | 1,745 | 2,160 | 2,370 | 1,381 |
| Needing help with 1+ ADL | 5,416 | 416 | 645 | 695 | 771 | 977 | 1,149 | 763 |
| IADL/ADL activities | Percent of sample needing help with activity (weighted) | |||||||
| Grocery shopping | 17.6 | 8.4 | 12.9 | 15.2 | 19.0 | 18.6 | 25.8 | 42.3 |
| Getting to places | 16.3 | 6.8 | 9.8 | 12.3 | 15.4 | 17.6 | 28.3 | 48.4 |
| Doing light housework | 11.5 | 4.9 | 9.9 | 10.3 | 12.2 | 11.9 | 16.2 | 26.6 |
| Preparing meals | 11.2 | 6.4 | 9.3 | 9.8 | 11.1 | 11.1 | 16.0 | 26.0 |
| Bathing | 10.7 | 4.0 | 6.6 | 7.5 | 10.3 | 11.3 | 18.4 | 34.4 |
| Getting outside | 9.1 | 3.3 | 4.6 | 6.1 | 8.5 | 10.2 | 16.4 | 30.9 |
| Walking | 8.3 | 3.2 | 5.0 | 6.5 | 8.1 | 9.5 | 13.8 | 23.4 |
| Dressing | 7.9 | 3.2 | 5.8 | 6.9 | 8.1 | 8.3 | 12.0 | 20.8 |
| Managing money | 7.0 | 6.3 | 5.8 | 4.6 | 5.3 | 5.2 | 10.6 | 22.6 |
| Transferring | 6.5 | 2.8 | 5.8 | 6.2 | 6.1 | 6.6 | 9.2 | 15.7 |
| Managing medications | 6.5 | 3.9 | 3.9 | 4.1 | 5.4 | 6.0 | 11.8 | 21.2 |
| Toileting | 3.9 | 1.7 | 2.4 | 2.6 | 3.7 | 4.1 | 7.1 | 11.6 |
| Using the phone | 3.5 | 1.9 | 2.4 | 2.3 | 2.7 | 3.1 | 6.3 | 12.0 |
| Eating | 2.8 | 1.4 | 1.6 | 1.7 | 2.4 | 2.9 | 5.4 | 8.2 |
| Statistic | Measure (weighted) | |||||||
| Mean ADL activities if ADL ≥ 1 | 2.42 | 2.23 | 2.32 | 2.34 | 2.33 | 2.42 | 2.56 | 2.57 |
| Mean IADL/ADL activities if IADL/ADL ≥ 1 | 4.27 | 3.63 | 4.01 | 3.89 | 3.98 | 4.18 | 4.72 | 5.24 |
Note: Source: Author’s analysis of the National Health Interview Survey on Disability, Phase II. ADL are highlighted in bold. ADL = activities of daily living; IADL = instrumental activities of daily living.
This dichotomous outcome was chosen for consistency with Katz’s scoring and that of Lawton and Brody and because eligibility and policy decisions for PAS and other LTSS consider need for assistance rather than difficulty (Tonner and Harrington, 2003). Dichotomous items were created with need for help coded “1” and no need for help coded “0” for each item. If a person does not have difficulty with an activity or does not do an activity for reasons other than health, the questions about needing help are not asked, and the response is coded 0. Rates of missing responses are low, ranging from 0.8% to less than 1.0% across the ADL items, 1.1% for walking and getting outside the home, and from 0.1% to 0.2% for the IADL, the denominator being the full Phase II sample. Persons who are unsure or do not know whether they need help are considered unlikely to need help and such responses are coded 0. An alternative treatment is to replace all missing responses with expected values based on known responses. That alternative was assessed using Winsteps software (described subsequently). The parameter changes were very small, less than 6%, and without substantive implication (tables available on request). All subsequent analyses proceeded with missing values coded 0.
For analyses by age, seven age groups are defined with sufficient samples in each (Table 1). A broader cut by age compares working-age (18–64) and older persons. For prevalence estimation, survey inflation weights are used; for all other analyses, analytic weights that sum to the overall sample size are used.
Guttman Methods
In Guttman analysis, the fit of a set of items is evaluated by counting deviations from ideal response patterns. For each possible score, only one response pattern is ideal. For example, when the responses to five dichotomous items are listed according to each item’s order from most to least frequently endorsed, a score of 2 implies a “11000” pattern, a score of 3 implies “11100,” and so forth. A pattern such as “01010” is a score of 2, but generates errors, as the first item should be endorsed instead of the fourth. Two measures of fit are considered. The “coefficient of reproducibility” (CR) measures the number of errors out of all possible responses according to Equation (1):
| (1) |
where e represents the errors from Guttman response types for a given score, K is the number of items, and N is the total sample size (McIver & Carmines, 1981). Guttman’s method of counting errors is used (McConaghy, 1975).
However, the CR is affected by the rate that items are endorsed, which can vary across samples. This is corrected by the CS, which measures the proportional reduction in error rates given the marginal probabilities of the items (Menzel, 1953) according to Equation (2):
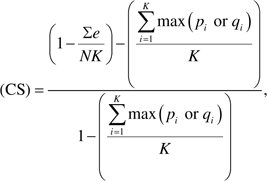 |
(2) |
where pi and qi refer to the proportion endorsing or not endorsing item i. The CS is computed for each of the seven age groups. If the items perform invariantly by age, the CS should be similar across age groups. The convention is that a CS >0.6 indicates a Guttman scale (Clogg & Sawyer, 1981). For the current analysis, the item hierarchy observed at ages 85 years and older is the hierarchy used for all age groups. The CS is calculated including and excluding extreme values (all 0’s or all 1’s) to provide results comparable to IRT models that exclude extreme values.
IRT Methods
IRT models estimate a probability distribution for the log of the odds of endorsing each item based on a person’s disability level, q, and each item’s severity, d (Embretson & Reise, 2000), according to Equation (3):
| (3) |
Items that are endorsed frequently are least severe. A person’s level of disability is related to the number of items endorsed. Responses are predicted by the distance between the item's severity, δi, and the person's disability level, θn, with items that are much lower in severity than the person's disability level being very likely to be endorsed and items that are much higher than the person's disability level being very unlikely to be endorsed. Item characteristic curves (ICCs) estimate the response to each item as a function of the disability level, θ, over all individuals (see Figure 2). The point on the y-axis where the probability of endorsing the item equals 0.5 is where the item contributes maximum information. Drawing a vertical line at that point on the ICC to the x-axis determines the item’s severity level, δi, along the dimension of disability, θ, measured in logits.
Figure 2.

Estimated item characteristic curves and actual values for getting outside (high discrimination) and managing money (low discrimination). Source: National Health Interview Survey on Disability.
The parameter αi determines the slope of the ICC and is a measure of how discriminating an item is relative to all other items. Items that are more highly discriminating have αi >1, indicating a steeper slope, whereas those that are less discriminating have αi <1, indicating a flatter slope. Items that are more highly Guttman scalable will appear to be more discriminating. In the one-parameter logistic model (1-PL), or Rasch model, the discrimination parameter αi equals 1 for all items and only the severity, δi, is estimated. In the two-parameter logistic model (2-PL), both αi and δi are estimated. Equation 3 is estimated by maximum likelihood methods using Winsteps software (Linacre, 2006) for the 1-PL and BILOG-MG 3 (Zimowski, Muraki, Mislevy, & Bock, 2008) for the 2-PL model. In IRT, extreme scores do not contain information about that person’s location on the latent trait and are not used (Linacre). For the ADL, 86.9% of the sample has all 0 responses and 1.8% all 1 responses. For the 14 IADL/ADL, a smaller fraction, 71.3% has all 0 response and 0.8% all 1 response.
In the Rasch model, statistical tests of how well each item fits are based on the squared difference between predicted and observed values, called mean square residuals. An “infit” statistic is weighted to be sensitive to unexpected behavior affecting responses to items near each person’s measured severity level. The expected value is 1.0, and actual values should be in the range of 0.7–1.3 (Bond & Fox, 2001). Items that are outside that range are considered not to lie on the same dimension and are omitted. An “outfit” statistic is sensitive to unexpected behavior by persons on items far from the person’s severity level. Outfit values should also be in the range of 0.7–1.3. Outfit values outside that range do not require an item to be omitted but do indicate outlier responses (Linacre, 2006).
The more the αi vary from 1, the less well the items fit the Rasch model and a 2-PL model may be more appropriate. The BILOG program is used to estimate the αi exactly and to assess the improvement in fit of a 2-PL over a 1-PL model. A nested chi-square test of the difference in log-likelihoods between the 1-PL and 2-PL models is used with degrees of freedom equal to the number of discrimination parameters (Embretson & Reise, 2000). Because this test is often significant in large samples, the percentage improvement in fit is considered more informative (Fleishman et al., 2002).
Age-Variant Measurement and DIF
The first step in investigating age-variant measurement is to determine if age-related DIF exists. DIF measures whether the probabilities of endorsing an item differ across age groups, controlling for latent disability. Winsteps controls for latent disability by fixing values of θn and δi to the values estimated for all age groups combined. ICCs are then estimated for each subgroup. For a broad cut, persons aged 18–64 years are contrasted with those aged 65 years and older. A finer cut compares persons aged 85 years and older against each of six younger age groups. For each subgroup, j, δij is estimated along with its standard error. For pairwise comparisons, a t test is used. Because DIF can also occur in discriminations (non-uniform DIF), the program IRTLRDIF (Edelen, Thissen, Teresi, Kleinman, & Ocepek-Welikson, 2006; Thissen, 2001) is used with the 2-PL model. IRTLRDIF assesses DIF for only two groups; therefore, persons aged 18–64 years are contrasted with those aged 65 years and older. The program computes the difference in the log likelihoods (G2) between a model in which the parameters for all items are held equal and the one in which both parameters of the studied item are allowed to vary, which is distributed as a chi-square with 2 df. If that is significant, it indicates that the parameters are not equal, and an additional comparison is made between the “all-equal” model and the one in which the severities of the studied item are allowed to vary but the discrimination parameters are constrained equal. If significant, the conclusion is that the discrimination parameters are not equal. The second result is subtracted from the first to obtain an estimate of DIF for severities. Both tests have 1 df. With these and all other DIF tests, a high significance level is used (p < .001) to compensate for the large sample size and any complex survey design effects the software does not take in to account.
Age-Variant Measurement and Differential Test Functioning
The second step in investigating age-variant measurement is to determine if age-related DIF affects the overall measure. In large samples, DIF can often be significant but may not be large enough or directional enough to affect a scale measure (Hambleton, 2006). Because a scale measure is the sum of the item expectations (Raju, van der Linden, & Fleer, 1995), negative and positive DIF can balance out without biasing the measure. The impact of DIF on the scale measures is assessed using differential test functioning (DTF; Hambleton; Linacre, 2006; Teresi et al., 2007). Rasch models are estimated for each age group separately. The expected score is plotted against the measured severity dimension, producing test characteristic curves (TCCs) for each group. If DIF has no impact, the curves should be the same. When DIF has impact, the area between the curves shows the extent of bias (Teresi et al.).
Analysis of Residuals
When the data fit a Rasch model, the measure should explain most of the variance, and the residuals should have a normal random distribution. Principal components analysis (PCA) is used to identify linear combinations of items accounting for variance in the residuals. If an eigenvalue is greater than chance (>1.4), items that load negatively or positively along the contrast may be of substantive interest, indicating either a change in the intensity of the Rasch dimension or the presence of additional dimensions (Linacre, 2006).
RESULTS
Almost half (47%) of the 5.4 million adults needing help in ADL are 18 to 64 years old, as are fully half of the 11.9 million adults needing help in one or more of the 14 IADL/ADL (Table 1). The IADL/ADL items have a wide prevalence ranging from 17.6% to 2.8% for all adults with disabilities. The prevalence of all items increases with age, but the prevalence order of the items varies somewhat by age. Among persons needing help in one or more ADL, the mean number of ADL activities increases from 2.2 to 2.6 across the seven age groups, whereas the mean number of IADL/ADL activities increases from 3.6 to 5.2 for those needing help in one or more IADL/ADL.
Scalability of ADL
The five ADL items for all ages combined are Guttman scalable, with a CS well above the CS >0.60 threshold (CS = 0.87 including extreme values and CS = 0.77 excluding them). A Rasch (1-PL) model for the ADL estimated for all adults shows that all items fit well, with an infit range of 0.8–1.2 (Table 2, Measure 1). Eating shows a large outfit (2.27), signaling a potential outlier issue. Because approximated item discriminations range from 0.74 to 1.32, a 2-PL model was used to estimate discriminations exactly. Although the chi-square difference for the 2-PL versus 1-PL models is significant (log-likelihood difference is 27853 − 27707 = 146, 5 df), the improvement in fit is an insubstantial 0.5%, indicating that the simpler Rasch model describes the data well.
Table 2.
Rasch (one-parameter logistic) Model Results and Estimates of DIF Comparing Working-Age and Older Persons
| All ages |
|||||||||||
| Item fit |
Age group |
||||||||||
| 18–64 |
65+ |
||||||||||
| Activity | δ |
R |
SE |
Infit MNSQ | Outfit MNSQ | Discrimination | δ | R | DIF | δ | R |
| Measure 1: ADL | |||||||||||
| Bathing | −2.71 | 1 | 0.05 | 1.02 | 0.95 | 0.96 | −2.08 | 1 | −1.36*** | −3.44 | 1 |
| Dressing | −1.19 | 2 | 0.05 | 0.81 | 0.75 | 1.32 | −1.37 | 2 | 0.34*** | −1.03 | 2 |
| Transferring | −0.40 | 3 | 0.05 | 1.14 | 1.22 | 0.80 | −0.84 | 3 | 0.90*** | 0.06 | 3 |
| Toileting | 1.50 | 4 | 0.06 | 0.76 | 0.72 | 1.20 | 1.54 | 4 | −0.07 | 1.47 | 4 |
| Eating | 2.79 | 5 | 0.08 | 1.23 | 2.27 | 0.74 | 2.75 | 5 | 0.10 | 2.85 | 5 |
| Measure 2: ADL, ambulation, and IADL (IADL/ADL) | |||||||||||
| Getting to places | −1.87 | 2 | 0.03 | 1.01 | 1.01 | 0.99 | −1.52 | 2 | −0.72*** | −2.24 | 1 |
| Grocery shopping | −2.13 | 1 | 0.03 | 1.09 | 1.33 | 0.75 | −2.22 | 1 | 0.19 | −2.03 | 2 |
| Bathing | −0.66 | 5 | 0.03 | 0.85 | 0.81 | 1.21 | −0.42 | 5 | −0.47*** | −0.89 | 3 |
| Getting outside | −0.28 | 6 | 0.03 | 0.81 | 0.67 | 1.25 | 0.08 | 9 | −0.67*** | −0.59 | 5 |
| Light housework | −0.85 | 3 | 0.03 | 1.08 | 1.11 | 0.87 | −1.07 | 3 | 0.46*** | −0.61 | 4 |
| Meals | −0.79 | 4 | 0.03 | 0.98 | 0.94 | 1.04 | −1.05 | 4 | 0.54*** | −0.51 | 6 |
| Walking | −0.06 | 7 | 0.03 | 0.95 | 0.93 | 1.06 | 0.05 | 7 | −0.22 | −0.17 | 7 |
| Managing money | 0.29 | 9 | 0.03 | 1.27 | 1.54 | 0.70 | 0.05 | 7 | 0.48*** | 0.53 | 10 |
| Managing medications | 0.47 | 11 | 0.04 | 1.08 | 1.20 | 0.92 | 0.55 | 11 | −0.16 | 0.39 | 9 |
| Dressing | 0.04 | 8 | 0.03 | 0.89 | 0.92 | 1.11 | −0.07 | 6 | 0.22*** | 0.15 | 8 |
| Transferring | 0.46 | 10 | 0.03 | 0.95 | 1.03 | 1.03 | 0.20 | 10 | 0.53*** | 0.73 | 11 |
| Using the phone | 1.70 | 13 | 0.05 | 1.17 | 1.91 | 0.85 | 1.67 | 13 | 0.03 | 1.70 | 13 |
| Toileting | 1.49 | 12 | 0.04 | 0.84 | 0.53 | 1.15 | 1.51 | 12 | −0.06 | 1.45 | 12 |
| Eating | 2.17 | 14 | 0.05 | 0.97 | 0.83 | 1.04 | 2.16 | 14 | −0.06 | 2.10 | 14 |
Notes: δ = item severity; ADL = activities of daily living; DIF = differential item functioning: difference in δ compared with persons aged 65 years and older; IADL = instrumental activities of daily living; MNSQ = mean square error; R = rank based on δ.
***p < .001.
Importantly, the ADL items are increasingly Guttman scalable with age, with CS = 0.77 (CS = 0.64 excluding extreme values) at ages 18–34 years rising to CS = 0.93 (CS = 0.82 excluding extremes) at ages 85 years and older (Figure 1), approaching near-perfect Guttman scalability. The greater scalability with age is reflected by substantial age-related DIF in the Rasch model, with a range of −1.4 to 0.9 logits comparing working age and older ages (Table 2, Measure 1) For detailed age comparisons, DIF ranges from −2.5 to 1.6 logits among persons aged 35–44 years who show the largest DIF compared with those 85 years and older (Table 3, Measure 1). Needing help bathing shows the largest DIF of all items, being more severe for younger age groups. Needing help transferring is less severe for younger groups. The item severity ranking remains steady with age, although dressing and transferring are equally severe at ages 35–44 years.
Figure 1.

Guttman coefficients of scalability for two measures based on needing help with activities of daily living and IADL/ADL by age, including and excluding extreme values (responses of 0 to every item or 1 to every item). Source: National Health Interview Survey on Disability.
Table 3.
Rasch (one-parameter logistic) Model DIF for Detailed Age Groups
| Age group |
||||||||||||||||||||
| 18–34 |
35–44 |
45–54 |
55–64 |
65–74 |
75–84 |
85+ |
||||||||||||||
| Activity | δ | R | DIF | δ | R | DIF | δ | R | DIF | δ | R | DIF | δ | R | DIF | δ | R | DIF | δ | R |
| Measure 1: ADL | ||||||||||||||||||||
| Bathing | −2.02 | 1 | −2.33*** | −1.82 | 1 | −2.53*** | −1.92 | 1 | −2.43*** | −2.49 | 1 | −1.86*** | −2.82 | 1 | −1.53*** | −3.62 | 1 | −0.73 | −4.35 | 1 |
| Dressing | −1.13 | 2 | 0.23 | −1.28 | 3 | 0.38 | −1.56 | 2 | 0.66*** | −1.38 | 2 | 0.48 | −1.17 | 2 | 0.27 | −0.98 | 2 | 0.08 | −0.90 | 2 |
| Transferring | −0.54 | 3 | 0.84*** | −1.30 | 2 | 1.60*** | −1.11 | 3 | 1.41*** | −0.34 | 3 | 0.64*** | −0.26 | 3 | 0.56 | 0.23 | 3 | 0.07 | 0.30 | 3 |
| Toileting | 1.17 | 4 | 0.39 | 1.68 | 4 | −0.12 | 1.82 | 4 | −0.26 | 1.39 | 4 | 0.17 | 1.43 | 4 | 0.13 | 1.45 | 4 | 0.11 | 1.56 | 4 |
| Eating | 1.88 | 5 | 1.21*** | 2.80 | 5 | 0.29 | 3.31 | 5 | −0.22 | 2.86 | 5 | 0.23 | 2.78 | 5 | 0.31 | 2.76 | 5 | 0.33 | 3.09 | 5 |
| Measure 2: ADL, ambulation, and IADL (IADL/ADL) | ||||||||||||||||||||
| Getting to places | −1.32 | 2 | −1.13*** | −1.35 | 3 | −1.10*** | −1.63 | 2 | −0.82*** | −1.69 | 2 | −0.76*** | −1.99 | 2 | −0.46*** | −2.36 | 1 | −0.09 | −2.45 | 1 |
| Grocery shopping | −1.91 | 1 | 0.07 | −2.18 | 1 | 0.34 | −2.29 | 1 | 0.45*** | −2.40 | 1 | 0.56*** | −2.18 | 1 | 0.34 | −1.99 | 2 | 0.15 | −1.84 | 2 |
| Bathing | −0.15 | 6 | −0.96*** | −0.35 | 5 | −0.76*** | −0.40 | 5 | −0.71*** | −0.64 | 5 | −0.47*** | −0.73 | 4 | −0.38*** | −0.89 | 3 | −0.22 | −1.11 | 3 |
| Getting outside | 0.24 | 8 | −1.01*** | 0.39 | 10 | −1.16*** | 0.05 | 9 | −0.82*** | −0.23 | 6 | −0.54*** | −0.48 | 6 | −0.29 | −0.58 | 4 | −0.19 | −0.77 | 4 |
| Light housework | −0.60 | 5 | 0.24 | −1.38 | 2 | 1.02*** | −1.14 | 3 | 0.78*** | −1.06 | 3 | 0.70*** | −0.84 | 3 | 0.48*** | −0.55 | 5 | 0.19 | −0.36 | 5 |
| Meals | −1.20 | 3 | 0.90*** | −1.20 | 4 | 0.90*** | −1.03 | 4 | 0.73*** | −0.84 | 4 | 0.54*** | −0.67 | 5 | 0.37*** | −0.50 | 6 | 0.20 | −0.30 | 6 |
| Walking | 0.30 | 10 | −0.32 | 0.24 | 9 | −0.26 | −0.09 | 7 | 0.07 | −0.12 | 8 | 0.10 | −0.30 | 7 | 0.28 | −0.13 | 7 | 0.11 | −0.02 | 7 |
| Managing money | −1.14 | 4 | 1.20*** | −0.09 | 6 | 0.15 | 0.58 | 10 | −0.52*** | 0.73 | 11 | −0.67*** | 0.93 | 11 | −0.87*** | 0.52 | 10 | −0.46*** | 0.06 | 8 |
| Managing medications | −0.13 | 7 | 0.35 | 0.71 | 11 | −0.49*** | 0.79 | 11 | −0.57*** | 0.69 | 10 | −0.47*** | 0.67 | 10 | −0.45*** | 0.26 | 9 | −0.04 | 0.22 | 9 |
| Dressing | 0.26 | 9 | 0.01 | −0.07 | 8 | 0.34 | −0.23 | 6 | 0.50*** | −0.13 | 7 | 0.40 | 0.01 | 8 | 0.26 | 0.21 | 8 | 0.06 | 0.27 | 10 |
| Transferring | 0.55 | 11 | 0.38 | −0.08 | 7 | 1.01*** | 0.00 | 8 | 0.93*** | 0.44 | 9 | 0.49*** | 0.48 | 9 | 0.45*** | 0.83 | 11 | 0.10 | 0.93 | 11 |
| Using the phone | 1.19 | 12 | 0.32 | 1.61 | 13 | −0.10 | 1.80 | 13 | −0.29 | 1.93 | 13 | −0.42 | 1.87 | 13 | −0.36 | 1.68 | 13 | −0.17 | 1.51 | 12 |
| Toileting | 1.42 | 13 | 0.17 | 1.59 | 12 | 0.00 | 1.61 | 12 | −0.02 | 1.41 | 12 | 0.18 | 1.38 | 12 | 0.21 | 1.43 | 12 | 0.16 | 1.59 | 13 |
| Eating | 1.79 | 14 | 0.52 | 2.25 | 14 | 0.06 | 2.36 | 14 | −0.05 | 2.14 | 14 | 0.17 | 2.01 | 14 | 0.30 | 2.03 | 14 | 0.28 | 2.31 | 14 |
Notes: δ = item severity; ADL = activities of daily living; DIF = differential item functioning: difference in δ compared with persons aged 85 years and older; IADL = instrumental activities of daily living; R = rank based on δ.
***p < .001. Significance level of DIF.
IRTLRDIF is used to assess DIF in discriminations and severities (Table 4, Measure 1). The DIF test is the null hypothesis that the specified parameters are equal across working-age and older persons; if the G2 is significant, it indicates that the parameters are not equal. Consistent with the Rasch analysis, bathing and transferring show a high amount of DIF and dressing a small amount; however, most of the DIF occurs in severities, not discriminations.
Table 4.
Differential Item Functioning in a Two-Parameter Logistic Item Response Theory Model Comparing Working-Age and Older Persons
| Age group |
||||||||
| 18–64 |
65+ |
|||||||
| Activity | DIF test | G2 | df | p | Discrimination | Severity | Discrimination | Severity |
| Measure 1: ADL | ||||||||
| Bathing | All equal | 213.2 | 2 | *** | 5.10 | 0.49 | 3.33 | 0.18 |
| Discriminations equal | 25.7 | 1 | *** | 3.97 | 0.50 | 3.97 | 0.17 | |
| Severities equal | 187.4 | 1 | *** | 3.53 | 0.28 | 3.53 | 0.28 | |
| Dressing | All equal | 26.5 | 2 | *** | 4.21 | 0.47 | 5.09 | 0.57 |
| Discriminations equal | 4.3 | 1 | 4.66 | 0.47 | 4.66 | 0.58 | ||
| Severities equal | 22.2 | 1 | *** | 4.57 | 0.53 | 4.57 | 0.53 | |
| Transferring | All equal | 147.6 | 2 | *** | 2.36 | 0.69 | 4.21 | 0.83 |
| Discriminations equal | 61.0 | 1 | *** | 3.18 | 0.63 | 3.18 | 0.88 | |
| Severities equal | 86.6 | 1 | *** | 3.03 | 0.77 | 3.03 | 0.77 | |
| Toileting | All equal | 2.9 | 2 | 5.11 | 1.05 | 6.20 | 1.03 | |
| Eating | All equal | 4.1 | 2 | 3.12 | 1.43 | 3.66 | 1.33 | |
| Discriminations equal | 3.3 | 1 | 3.41 | 1.39 | 3.41 | 1.35 | ||
| Severities equal | 0.8 | 1 | 3.42 | 1.37 | 3.42 | 1.37 | ||
| Measure 2: ADL, ambulation, and IADL (IADL/ADL) | ||||||||
| Getting places | All equal | 208.4 | 2 | *** | 1.19 | −0.12 | 0.72 | −1.02 |
| Discriminations equal | 33.7 | 1 | *** | 0.91 | −0.12 | 0.91 | −0.86 | |
| Severities equal | 174.6 | 1 | *** | 0.92 | −0.49 | 0.92 | −0.49 | |
| Grocery shopping | All equal | 6.5 | 2 | 0.64 | −0.90 | 0.47 | −1.15 | |
| Discriminations equal | 6.5 | 1 | 0.54 | −1.01 | 0.54 | −1.02 | ||
| Severities equal | 0.0 | 1 | 0.54 | −1.02 | 0.54 | −1.02 | ||
| Bathing | All equal | 53.1 | 2 | *** | 3.23 | 0.29 | 2.66 | 0.14 |
| Discriminations equal | 8.5 | 1 | 2.90 | 0.30 | 2.90 | 0.13 | ||
| Severities equal | 44.6 | 1 | *** | 2.90 | 0.21 | 2.90 | 0.21 | |
| Getting outside | All equal | 98.3 | 2 | *** | 3.25 | 0.49 | 2.99 | 0.26 |
| Discriminations equal | 1.9 | 1 | 3.10 | 0.50 | 3.10 | 0.25 | ||
| Severities equal | 96.5 | 1 | *** | 3.09 | 0.36 | 3.09 | 0.36 | |
| Light housework | All equal | 23.8 | 2* | *** | 0.94 | 0.22 | 1.06 | 0.42 |
| Discriminations equal | 2.8 | 1 | 1.01 | 0.20 | 1.01 | 0.44 | ||
| Severities equal | 21.0 | 1 | *** | 0.99 | 0.33 | 0.99 | 0.33 | |
| Meals | All equal | 46.0 | 2 | *** | 1.15 | 0.19 | 1.23 | 0.48 |
| Discriminations equal | 1.1 | 1 | 1.19 | 0.18 | 1.19 | 0.49 | ||
| Severities equal | 44.9 | 1 | *** | 1.16 | 0.35 | 1.16 | 0.35 | |
| Walking | All equal | 1.9 | 2 | 2.51 | 0.51 | 2.50 | 0.47 | |
| Managing money | All equal | 86.0 | 2 | *** | 0.53 | 2.10 | 1.18 | 1.16 |
| Discriminations equal | 79.1 | 1 | *** | 0.87 | 1.27 | 0.87 | 1.45 | |
| Severities equal | 6.9 | 1 | 0.86 | 1.38 | 0.86 | 1.38 | ||
| Managing meds | All equal | 22.6 | 2 | *** | 1.12 | 1.35 | 1.39 | 0.98 |
| Discriminations equal | 9.9 | 1 | 1.27 | 1.22 | 1.27 | 1.04 | ||
| Severities equal | 12.7 | 1 | *** | 1.29 | 1.11 | 1.29 | 1.11 | |
| Dressing | All equal | 65.9 | 2 | *** | 2.47 | 0.45 | 3.29 | 0.57 |
| Discriminations equal | 20.2 | 1 | *** | 2.86 | 0.41 | 2.86 | 0.60 | |
| Severities equal | 45.7 | 1 | *** | 2.77 | 0.52 | 2.77 | 0.52 | |
| Transferring | All equal | 206.5 | 2 | *** | 2.15 | 0.62 | 3.64 | 0.83 |
| Discriminations equal | 65.3 | 1 | *** | 2.76 | 0.54 | 2.76 | 0.89 | |
| Severities equal | 141.1 | 1 | *** | 2.55 | 0.74 | 2.55 | 0.74 | |
| Using the phone | All equal | 2.9 | 2 | 1.31 | 1.86 | 1.37 | 1.72 | |
| Toileting | All equal | 12.1 | 2 | 4.14 | 0.98 | 4.51 | 1.06 | |
| Discriminations equal | 0.9 | 1 | 4.33 | 0.97 | 4.33 | 1.07 | ||
| Severities equal | 11.1 | 1 | *** | 4.25 | 1.03 | 4.25 | 1.03 | |
| Eating | All equal | 1.5 | 2 | 2.88 | 1.38 | 2.94 | 1.42 | |
Notes: Tests of equality of slopes and severities are not provided unless G2 is significant for the test that all parameters are equal. ADL = activities of daily living; DIF = differential item functioning; IADL = instrumental activities of daily living; G2 = log-likelihood difference.
***p < .001, G2 > 10.83.
Scalability of IADL/ADL
The 14 IADL/ADL items for all ages combined are also Guttman scalable, with a CS = 0.68 (CS = 0.61 excluding extreme values), but they are less scalable than the ADL. Rasch analysis shows that the heavy housework item does not scale with the other IADL/ADL items (infit = 1.49, data not shown). The remaining items fit the Rasch model, with infit values in the expected range (Table 2, Measure 2). Managing money and using the phone have high outfit values signaling outlier responses. Managing money fits least well, with borderline infit = 1.27, and has low discrimination (0.70). Its estimated ICC and actual values are illustrated in Figure 2; a lower slope would appear to fit the data better. In contrast, getting outside is estimated to be more discriminating, and a higher slope would fit better. Table 2 shows that the IADL items discriminate less than the ADL and ambulation items. BILOG-MG is used to estimate item discriminations exactly, revealing a small improvement in fit of the 2-PL over a 1-PL model of 3.0% (log-likelihood difference is 101458 − 98503 = 2995, 14 df). Spector and Fleishman (1998) concluded that a 2% improvement was not sufficient to justify the more complex model; the same conclusion is drawn here.
For the IADL/ADL, Guttman scalability is lower than the ADL but also increases with age, with CS = 0.58 (CS = 0.55 excluding extremes) at ages 18–34 years rising to CS = 0.74 (CS = 0.65 excluding extremes) at ages 85 years and older (Figure 1). DIF analysis of the IADL/ADL items proceeds using the Rasch model. Contrasting working-age and older groups, highly significant age DIF is observed in 8 of 14 items (Table 2, Measure 2). However, DIF has a range of −0.7 to 0.5 logits, about half the magnitude observed for the ADL. Further, DIF is negative for three items and positive for five items and their magnitudes balance. More detailed DIF analysis (Table 3) shows that persons aged 18–34 years have the highest magnitude of DIF, with a range of −1.1 to 1.2 logits, which again is smaller than for the ADL. All age groups aged 75 years and younger show DIF in several items, in both positive and negative directions.
IRTLRDIF is used to test for DIF in discriminations as well as severities comparing working-age and older persons. The same eight items show DIF as in the Rasch model (Table 4, Measure 2); additionally, managing medications and toileting show DIF. For all items except managing money, DIF occurs mainly in severities rather than in discriminations. Managing money discriminates less well for working-age persons (0.53 vs. 1.18). These results also show that the ADL, getting outside, and walking items have higher discrimination than the IADL items.
As a sensitivity analysis, the Rasch model was reestimated omitting managing money. That resulted in the phone item fitting less well (infit = 1.27). Eliminating the phone item resulted in the medications item fitting less well (infit = 1.26). Eliminating all three resulted in very good fits for the remaining items (infit range = 0.79–1.20). This suggests that the cognitive IADL items fit somewhat tenuously with the others, but as they fit within acceptable bounds, they are retained in the model.
Impact of DIF on Scale Values
The impact of age-related DIF in severities on the two scale measures is evaluated by DTF. TCC relating latent disability values to expected scale scores are compared for persons 85 and older and younger age groups. The area between these curves shows the impact of DIF. For the ADL items, Figure 3 shows a large area between the curves. For individuals at the same level of latent disability θ = −4, those aged 85 years or older have an expected score approximately 0.7 units higher than those aged 18–34 years. At θ = 2, the older group has an expected score higher than the younger group by 0.7 units. Because the maximum scale value is 5, this is a large amount of bias. The pronounced elongation of the curve for the 85 years and older group reflects the inflation of the Rasch item severities due to the highly Guttman ADL items. Substantial bias is observed even at ages 75–84 years (shown) and in every younger age group compared with ages 85 years and older (not shown). A comparison of ages 18–64 and 65 years and older also indicates that the bias is substantial, although about half the magnitude as for the extreme age groups (not shown).
Figure 3.

Test characteristic curves for needing help in activities of daily living for selected age groups. Source: National Health Interview Survey on Disability.
For the IADL/ADL, in contrast, the TCCs for the extreme age groups are much closer (Figure 4). The greatest difference between the two curves is 0.26 units at θ = −2 and 0.26 in the opposite direction at θ = 2, but given that the maximum scale value is 6, this is a much smaller impact than for the ADL. For the remaining age groups aged 84 years or younger, the absolute difference with those 85 years and older is less than 0.1 units, which is trivial. Comparing ages 18–64 and 65+ years, the largest difference is also less than 0.1 (not shown). Thus, the ADL measure is biased by age, but the IADL/ADL measure is not, with a small caveat for the 18- to 34-year-old group.
Figure 4.

Test characteristic curves for needing help in IADL/ADL for selected age groups. Source: National Health Interview Survey on Disability.
PCA of Rasch Residuals
PCA of Rasch model residuals is used to evaluate problems of fit that may be due to multidimensionality or other causes. For the ADL, the eigenvalue for the first contrast in the residuals is 1.5, just above chance level indicating that the ADL are essentially unidimensional. The model explains 64.6% of the variation in responses at ages 18–34 years increasing to 95.6% at ages 85 years and older, again showing that the data are more highly Guttman with age (data not shown).
For the IADL/ADL, PCA shows a contrast between the ADL items together with walking and getting outside against the IADL items, with an eigenvalue of 2.5. That is higher than chance and signals a potential problem. However, a significant contrast can signal a change in the intensity of the Rasch dimension, as between sets of items that differ in discrimination (Linacre, 2006). This interpretation is consistent with the earlier observation that the IADL items have lower discrimination than the ADL and ambulation items. The eigenvalue for the second contrast is 1.4, the same as chance, showing no evidence of other problems of fit or for a third dimension, which would be expected to be a cognitive dimension. The IADL/ADL measure also explains more of the variation in responses with age, up to 75% at ages 85 years and older, but not as much as the ADL measure. It is concluded that all 14 IADL/ADL items fit the Rasch model, which is a strong indication that they are unidimensional (Linacre), but the IADL clearly discriminate less well than the ADL and ambulation items.
DISCUSSION
A measure of disability comprising 14 dichotomous items indicating need for help in ADL, ambulation, and IADL (IADL/ADL), is unbiased by age. Guttman and IRT analyses show that the items comprise a unidimensional scale, as previously observed (Fleishman et al., 2002; Spector & Fleishman, 1998). IRT analyses show that the items exhibit age-related DIF, varying significantly in their estimated severities by age, controlling for latent disability. But DIF is bidirectional, for example, when comparing persons aged 18–34 years with those aged 85 years and older, three items (getting to places, bathing, and getting outside) are less severe for younger adults, but two items (preparing meals and managing money) are more severe. Because the scale measure is the sum of the item expectations (Raju et al., 1995), these differences in positive and negative magnitudes balance out without biasing the measure by age. For age groups from 35 to 74 years, there is no bias observed compared with those aged 85 years and older; however, the small amount of bias at ages 18–34 years may necessitate some caution comparing the youngest and the oldest age groups. The measure is not biased for comparing the 18–64 and 65 years and older age groups.
In contrast, the ADL measure is biased substantially by age. The ADL measure is more hierarchical (Guttman scalable) than the IADL/ADL. However, perfectly hierarchical data are a limiting condition for IRT models, which break down as Guttman scalability increases with age. Item severities inflate and significant age-related DIF occurs, which is large in magnitude and does not balance out, affecting scale values and resulting in age-biased measurement in an IRT model. Although the scalability of the IADL/ADL items also increases with age, the magnitude of DIF that occurs by age is smaller and balances out, resulting in an age-invariant measure.
The results suggest that the prevailing practice of counting the number of ADL a person needs help with is not appropriate for comparing disability among adults of different ages living in the community. Such counts do not mean the same thing across different age groups, in terms of measured disability. However, Rasch-measured scores based on the unbiased IADL/ADL items are highly correlated with the count of items endorsed (r = .99, N = 14, p < .001), suggesting that counts of IADL/ADL can be used to compare persons or populations of different ages. For example, among persons needing help in one or more IADL/ADL, persons aged 85 years or older are 31% more severely disabled than those aged 35–44 years based on the average score (4.0 vs. 5.2; Table 1). In contrast, based on the ADL score, older persons are more severely disabled by 11% compared with adults aged 35–44 years (2.3 vs. 2.6). Thus, the IADL/ADL measure is more sensitive to age differences in disability.
The three cognitive IADL items do not comprise a separate dimension, despite contrary claims (Wolinsky & Johnson, 1991). In fact, the cognitive items fit the Rasch model and are comparable in severity to the ADL items. One of the items, needing help managing money, performs marginally, showing a high degree of DIF and lower discrimination among younger persons. Fleishman and colleagues also found that item problematic. Question construction seems implicated. The lead-in question asks, “Because of a health or physical problem or impairment, do you have any difficulty managing your money, such as keeping track of expenses or paying bills?” This construction may pick up noise, especially if younger adults get monetary help paying bills from their parents. Another cognitive item, needing help using the telephone, mixes cognitive and hearing problems. Both items have higher than expected outlier responses. Although the cognitive items should be refined, the results suggest that they remain important constituents of an IADL/ADL measure, improving its content validity over the classic ADL.
Several tests reveal that the IADL items have lower discrimination than the ADL, including the 3% improvement in chi-square of the 2-PL model over the 1-PL model and in the PCA results for the 1-PL model. The IADL are more influenced by the social and physical environments than are the ADL (Lawton & Brody, 1969), which may cause them to be more variable. But as with managing money, the construction of several of the IADL questions might be improved and modernized, which could increase their discrimination. Despite being somewhat less discriminating, the advantages of the IADL/ADL measure include its unbiasedness by age, greater content validity, and greater sensitivity than the ADL measure.
The high scalability of the ADL at older ages supports Katz’s model of disability and aging but also shows that model applies less well to younger adults needing help. Age differences in diagnoses may be important. Compared with older persons, younger persons are more affected by developmental disabilities, mental illness, and impairments of the back and extremities (LaPlante & Carlson, 1996). Such conditions may be less likely than late-onset conditions to follow the ordered pattern suggested by Katz’s model. Additionally, differences among age cohorts in education, perceptions of disability, and coping and adaptation strategies might also contribute. Additional research is needed to better understand changes in ADL scalability with age. Nevertheless, the finding that the IADL/ADL measure is unbiased by age indicates that the combined models by Katz and Lawton and Brody are applicable to all adults with a variety of diagnoses.
The finding that the IADL/ADL measure is not age biased differs from another prominent study (Fleishman et al., 2002). That study used 11 IADL/ADL items scored dichotomously for needing help, finding that an IADL/ADL measure was biased by age and gender. The present study included the additional items of getting to places, getting outside, and managing medications, all of which are integral to the IADL/ADL measure. Although both studies observed significant age-related DIF, its measurement impact depends on its magnitude and directionality. In the present study, age-related DIF balances out without affecting the IADL/ADL measure. The present study’s different finding may be due to the additional items included, which helps DIF balance out. Gender was not examined in the present study in order to focus on age; additional analysis will be needed to understand the importance of gender in addition to age.
Use of a large nationally representative sample is a strength of this study, providing sufficient power to explore age differences and findings that are directly generalizable to community residents. However, the scaling software does not adjust for the complex survey sample design, which could increase the significance of comparisons. To compensate, the study employs a high threshold for DIF significance (Fleishman et al., 2002). A necessary limitation is that the evaluation of need for assistance is scored dichotomously to be consistent with Katz’s original scoring and that of Lawton and Brody. Additional research should compare dichotomous and polytomous scoring (Fange, Lanke, & Iwarsson, 2004), using gradient markers of difficulty or levels of help required in each activity to address measurement of the severity of disability more thoroughly. Research is also needed on the concurrent and predictive validity of an expanded IADL/ADL measure, which has been shown to predict hours of personal assistance received among older persons (Spector & Fleishman, 1998).
Because half of adults needing help in ADL or IADL/ADL are aged 18–64 years, comparisons of younger and older populations’ need levels are inevitable. As Medicaid HCBS have grown (Kitchener, Ng, Miller, & Harrington, 2005), it is necessary to move beyond the ADL, which are more applicable to institutional living, to the IADL/ADL, which are more applicable to community living. This study shows that a measure of need for help in IADL/ADL is suitable for use with adults of all ages and is a more complete and sensitive measure of need than an ADL measure. The study results should encourage greater use of combined ADL and IADL measures in age-comparative research and policy evaluation.
FUNDING
This work was funded by grants (H133B031102) and (H133B080002) from the National Institute on Disability and Rehabilitation Research.
Acknowledgments
I wish to thank John M. Linacre, Ph.D. and John A. Fleishman, Ph.D. for reading early versions of the manuscript. H. Stephen Kaye, Ph.D. for discussions that helped facilitate my understanding of the relationship between Guttman and Rasch scaling methods, and Ronald D. Hays, Ph.D. who contributed helpful editorial suggestions.
References
- Adams PF, Marano MA. Current estimates from the National Health Interview Survey, 1994. Vital and Health Statistics. 1995;10:1–260. [PubMed] [Google Scholar]
- Andrich D. An elaboration of Guttman scaling with Rasch models for measurement. Sociological Methodology. 1985;15:33–80. [Google Scholar]
- Asberg KH, Sonn U. The cumulative structure of personal and instrumental ADL. A study of elderly people in a health service district. Scandinavian Journal of Rehabilitation Medicine. 1989;21:171–177. [PubMed] [Google Scholar]
- Benson V, Marano MA. Current estimates from the National Health Interview Survey, 1995. Vital and Health Statistics. 1998;10:1–428. [PubMed] [Google Scholar]
- Bond TG, Fox CM. Applying the Rasch model: Fundamental measurement in the human sciences. Mahwah, NJ: Erlbaum; 2001. [Google Scholar]
- Breithaupt K, McDowell I. Considerations for measuring functioning of the elderly: IRM dimensionality and scaling analysis. Health Services and Outcomes Research Methodology. 2001;2:37–50. [Google Scholar]
- Brorsson B, Asberg KH. Katz index of independence in ADL. Reliability and validity in short-term care. Scandinavian Journal of Rehabilitation Medicine. 1984;16:125–132. [PubMed] [Google Scholar]
- Ciesla JR, Shi L, Stoskopf CH, Samuels ME. Reliability of Katz’s activities of daily living scale when used in telephone interviews. Evaluation & The Health Professions. 1993;16:190–203. doi: 10.1177/016327879301600204. [DOI] [PubMed] [Google Scholar]
- Clogg C, Sawyer DO. A comparison of alternative models for analyzing the scalability of response patterns. Sociological Methodology. 1981;12:240–280. [Google Scholar]
- Edelen MO, Thissen D, Teresi JA, Kleinman M, Ocepek-Welikson K. Identification of differential item functioning using item response theory and the likelihood-based model comparison approach: Application to the mini-mental state examination. Medical Care. 2006;44(11 Suppl. 3):S134–S142. doi: 10.1097/01.mlr.0000245251.83359.8c. [DOI] [PubMed] [Google Scholar]
- Embretson SE, Reise SP. Item response theory for psychologists. Mahwah, NJ: L. Erlbaum; 2000. [Google Scholar]
- Fange A, Lanke J, Iwarsson S. Statistical assessment of changes in ADL dependence: Three-graded versus dichotomised scaling. International Journal of Rehabilitation Research. 2004;27:305–309. doi: 10.1097/00004356-200412000-00009. [DOI] [PubMed] [Google Scholar]
- Fillenbaum GG. Multidimensional functional assessment of older adults: The Duke Older Americans Resources and Services procedures. Hillsdale, NJ: L. Erlbaum; 1988. [Google Scholar]
- Fitzgerald JF, Smith DM, Martin DK, Freedman JA, Wolinsky FD. Replication of the multidimensionality of activities of daily living. Journal of Gerontology: Social Sciences. 1993;48:S28–S31. doi: 10.1093/geronj/48.1.s28. [DOI] [PubMed] [Google Scholar]
- Fleishman JA, Spector WD, Altman BM. Impact of differential item functioning on age and gender differences in functional disability. Journal of Gerontology: Social Sciences. 2002;57:S275–S284. doi: 10.1093/geronb/57.5.s275. [DOI] [PubMed] [Google Scholar]
- Fox-Grage W. The Task Force Report: Long-term care reform in the States. Denver, CO: National Conference of State Legislators; 1997. [Google Scholar]
- Hambleton RK. Good practices for identifying differential item functioning. Medical Care. 2006;44(11 Suppl. 3):S182–S188. doi: 10.1097/01.mlr.0000245443.86671.c4. [DOI] [PubMed] [Google Scholar]
- Hayflick L. How and why we age. New York: Ballantine Books; 1994. [Google Scholar]
- Hays RD, Brown J, Brown LU, Spritzer KL, Crall JJ. Classical test theory and item response theory analyses of multi-item scales assessing parents’ perceptions of their children’s dental care. Medical Care. 2006;44(11 Suppl. 3):S60–S68. doi: 10.1097/01.mlr.0000245144.90229.d0. [DOI] [PubMed] [Google Scholar]
- Johnston MV, Graves D, Greene M. The uniform postacute assessment tool: Systematically evaluating the quality of measurement evidence. Archives of Physical Medicine and Rehabilitation. 2007;88:1505–1512. doi: 10.1016/j.apmr.2007.08.117. [DOI] [PubMed] [Google Scholar]
- Katz S, Akpom CA. A measure of primary sociobiological functions. International Journal of Health Services. 1976;6:493–508. doi: 10.2190/UURL-2RYU-WRYD-EY3K. [DOI] [PubMed] [Google Scholar]
- Katz S, Ford AB, Moskowitz RW, Jackson BA, Jaffe MW. Studies of illness in the aged. The index of ADL: A standardized measure of biological and psychosocial function. Journal of the American Medical Association. 1963;185:914–919. doi: 10.1001/jama.1963.03060120024016. [DOI] [PubMed] [Google Scholar]
- Kempen GI, Suurmeijer TP. The development of a hierarchical polychotomous ADL-IADL scale for noninstitutionalized elders. The Gerontologist. 1990;30:497–502. doi: 10.1093/geront/30.4.497. [DOI] [PubMed] [Google Scholar]
- Kitchener M, Ng T, Miller N, Harrington C. Medicaid home and community-based services: National program trends. Health Affairs. 2005;24:206–212. doi: 10.1377/hlthaff.24.1.206. [DOI] [PubMed] [Google Scholar]
- LaPlante MP, Carlson D. Disability in the United States: Prevalence and causes, 1992. Washington, DC: National Institute on Disability and Rehabilitation Research; 1996. [Google Scholar]
- Lawton MP, Brody EM. Assessment of older people: Self-maintaining and instrumental activities of daily living. The Gerontologist. 1969;9:179–186. [PubMed] [Google Scholar]
- Lazaridis EN, Rudberg MA, Furner SE, Cassel CK. Do activities of daily living have a hierarchical structure? An analysis using the longitudinal study of aging. Journal of Gerontology: Medical Sciences. 1994;49:M47–M51. doi: 10.1093/geronj/49.2.m47. [DOI] [PubMed] [Google Scholar]
- Linacre JM. Winsteps Rasch measurement computer program. Version 3.61.1. Chicago: Winsteps; 2006. [Google Scholar]
- McConaghy MJ. Maximum possible error in Guttman scales. Public Opinion Quarterly. 1975;39:343–357. [Google Scholar]
- McIver JP, Carmines EG. Unidimensional scaling. Beverly Hills, CA: Sage; 1981. [Google Scholar]
- Menzel H. A new coefficient for scalogram analysis. Public Opinion Quarterly. 1953;17:268–280. [Google Scholar]
- Ng TP, Niti M, Chiam PC, Kua EH. Physical and cognitive domains of the instrumental activities of daily living: Validation in a multiethnic population of Asian older adults. Journal of Gerontology: Medical Sciences. 2006;61:726–735. doi: 10.1093/gerona/61.7.726. [DOI] [PubMed] [Google Scholar]
- Raju NS, van der Linden WJ, Fleer PF. IRT-based internal measures of differential functioning of items and tests. Applied Psychological Measurement. 1995;19:353–368. [Google Scholar]
- Spector WD, Fleishman JA. Combining activities of daily living with instrumental activities of daily living to measure functional disability. Journal of Gerontology: Social Sciences. 1998;53:S46–S57. doi: 10.1093/geronb/53b.1.s46. [DOI] [PubMed] [Google Scholar]
- Spector WD, Katz S, Murphy JB, Fulton JP. The hierarchical relationship between activities of daily living and instrumental activities of daily living. Journal of Chronic Diseases. 1987;40:481–489. doi: 10.1016/0021-9681(87)90004-x. [DOI] [PubMed] [Google Scholar]
- Teresi JA, Ocepek-Welikson K, Kleinman M, Cook KF, Crane PK, Gibbons LE, Morales LS, Orlando-Edelen M, Cella D. Evaluating measurement equivalence using the item response theory log-likelihood ratio (IRTLR) method to assess differential item functioning (DIF): Applications (with illustrations) to measures of physical functioning ability and general distress. Quality of Life Research. 2007;16(Suppl. 1):43–68. doi: 10.1007/s11136-007-9186-4. [DOI] [PubMed] [Google Scholar]
- Thissen DLL. IRTLRDIF v. 2.0b: Software for the computation of the statistics involved in item response theory likelihood-ratio tests for differential item functioning. Chapel Hill: Thurstone Psychometric Laboratory, University of North Carolina at Chapel Hill; 2001. [Google Scholar]
- Thomas VS, Rockwood K, McDowell I. Multidimensionality in instrumental and basic activities of daily living. Journal of Clinical Epidemiology. 1998;51:315–321. doi: 10.1016/s0895-4356(97)00292-8. [DOI] [PubMed] [Google Scholar]
- Tonner MC, Harrington C. Nursing facility and home and community based service need criteria in the United States. Home Health Care Services Quarterly. 2003;24(4):65–83. [PubMed] [Google Scholar]
- Tonner MC, LeBlanc AJ, Harrington C. State long-term care screening and assessment programs. Home Health Care Services Quarterly. 2001;19(3):57–85. doi: 10.1300/J027v19n03_05. [DOI] [PubMed] [Google Scholar]
- Travis SS, McAuley WJ. Simple counts of the number of basic ADL dependencies for long-term care research and practice. Health Services Research. 1990;25:349–360. [PMC free article] [PubMed] [Google Scholar]
- Vittengl JR, White CN, McGovern RJ, Morton BJ. Comparative validity of seven scoring systems for the instrumental activities of daily living scale in rural elders. Aging and Mental Health. 2006;10:40–47. doi: 10.1080/13607860500307944. [DOI] [PubMed] [Google Scholar]
- Wolinsky FD, Johnson RJ. The use of health services by older adults. Journal of Gerontology: Social Sciences. 1991;46:S345–S357. doi: 10.1093/geronj/46.6.s345. [DOI] [PubMed] [Google Scholar]
- Zimowski M, Muraki E, Mislevy R, Bock D. BILOG-MG 3: Item analysis and test scoring with binary logistic models. Mooresville, IN: Scientific Software; 2008. [Google Scholar]