Abstract
Non-perturbing and site-specific in vivo protein labeling methods are highly desired as they allow researchers to probe complex cellular functions. The biarsenical/tetracysteine labeling system allows in situ fluorescent labeling of intracellular proteins which have been appended with small (12 amino acids) genetically encoded peptide tags. In this work we present the in vivo selection of semi-randomized tandem tetracysteine peptides with improved biarsenical (ReAsH) fluorescent brightness (~2-fold) relative to a single tetracysteine motif or rationally designed 3-fold tetracysteine repeat. We found that Fluorescence Activated Cell Sorting by direct ReAsH excitation as opposed to FRET-mediated ReAsH excitation was optimal for selecting 3×Tetracysteine peptides with enhanced brightness. The selected multimer-tetracysteine peptides display enhanced properties due to higher order ReAsH/3×Tetracysteine dye stoichiometries as opposed to enhancement of the individual core tetracysteine photophysical properties. In summary, we have isolated new 3×Tetracysteine motifs with improved ReAsH brightness in live cells. These modular tags should provide enhanced contrast for live cell imaging applications where small tag size (~4.8 KDa) is a requisite for protein labeling.
Keywords: Fluorescent probes, protein engineering, fluorescence microscopy, cellular imaging, high throughput screening
Fluorescent proteins (FPs) have revolutionized the study of cellular processes by enabling the observation of specific biomolecules within living cells and tissues. The genetic encodability and auto-catalytic fluorescence of this class of proteins is ideal for “noninvasive” imaging of biological processes. However, the large size of FPs (~25 KDa), often rivaling the size of the tethered protein of interest, may perturb protein localization and function. Hence genetically encodable alternatives to FPs are desired. While other protein labeling strategies exist (reviewed in [1] and [2]), the biarsenical-tetracysteine dye labeling system offers distinct advantages: (1) small label size (~1.9 KDa), (2) no enzymes are required for introduction of the label, and (3) the ability to label proteins within the cytosol of living cells.[3,4,5]
Although the biarsenical-tetracysteine epitope offers small tag size and the ability to label intracellular protein targets, the system is not without shortcomings. This system relies on precisely spaced and oriented thiols to bind the biarsenical-linked fluorophore.[6] Due to the cellular abundance of protein thiols, non-specific biarsenical labeling can decrease contrast (signal/noise) of this labeling system. The use of antidote dithiol compounds such as 1,2-ethanedithiol (EDT) or 2,3-dimercaptopropanol (BAL) decrease non-specific biarsenical labeling while leaving the specific staining relatively intact. However, increasing the concentration of dithiol antidote can lead to destaining of specific tetracysteine bound biarsenical dye. The current third generation core tetracysteine (TC) peptide (# = FLNCCPGCCMEP) balances the requirements of retaining a high fluorescent quantum yield and better resistance to specific destaining of the biarsenical dyes ReAsH (red) and FlAsH (green).[7] Despite the obvious improvements in the current generation TC peptide (≥ 6-fold over previous generations), the contrast achievable in live cells is still ~16-fold worse than green fluorescent protein (GFP).[7] Thus, improvements in biarsenical-TC contrast are needed if this technology is to find commonplace use as an alternative to FPs. We reasoned that concatenation of the latest core TC motif could result in an overall increase in the fluorescent signal per tagged protein, thus increasing the signal to noise ratio of fluorescently labeled intracellular proteins of interest.
Our early rational designs of three tandem core TC repeats (3×TC, Protein-GS#GS#GS#; where # = FLNCCPGCCMEP) yielded only marginal improvements in total fluorescent signals (~15%) when compared with a single TC tethered to the same protein.[8] We reasoned there were two possible reasons for the modest increase in 3×TC fluorescence output: (1) neighboring fluorophores gave rise to fluorescence quenching, and/or (2) steric hindrance of proximal TC binding sites precluded stoichiometric binding of 3 dye molecules. We sought to overcome these limitations by optimizing the linker regions between the three repeats to minimize fluorescence quenching and maximize dye binding.
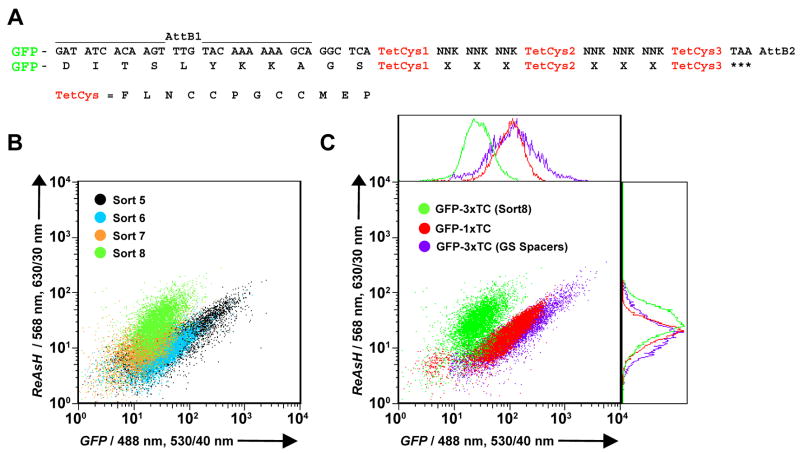
Here we report the in situ selection of a randomized amino acid linker library flanking three tandem optimized TC repeats (3×TC; # = FLNCCPGCCMEP) (Figure 1A). A library of 1.2 × 10⁷ 3×TC peptides fused to GFP was screened for improved ReAsH brightness in HEK293FT cells using Fluorescence Activated Cell Sorting (FACS). Representative sorting controls are presented in Supplementary Figure 1. Cells were enriched for GFP expression for three rounds before selecting a ReAsH stained population for improved Fluorescence Resonance Energy Transfer (FRET) from GFP to bound ReAsH (Supplementary Figure 2A). A FRET-based selection was performed to ensure the ReAsH fluorescence observed was due to specifically bound dye while eliminating the fluorescence signal due to non-specific staining which would not be excited at the GFP wavelength. After 7 rounds of selection, cells displayed a significantly higher ratio of FRET/GFP emission when compared to a population of HEK293FT cells expressing a rationally designed 3×TC peptide with GS linkers between each tandem repeat (GFP-3×TC(WT) = GFP-GS#GS#GS#; Supplementary Figure 2B). Retrieval of the 3×TC library coding sequences unexpectedly yielded clones containing a TAG stop codon within the first randomized linker and hence only one tetracysteine motif per GFP protein. Of the twenty clones sequenced only one peptide was identified harboring all three tandem tetracysteine repeats. We chose this 3×TC motif along with two randomly selected truncated variants harboring stop codons before the second TC repeat for further spectroscopic analysis. Single cell fluorescence microscopy of these selected peptides yielded insignificant changes in the FRET ratio (FRET/GFP fluorescence) and modest enhancements in ReAsH brightness (ReAsH/GFP fluorescence) compared with a single core 1×TC motif (Supplementary Figure 2C-D). Although we used the FRET-based approach to minimize signal from background staining, we unfortunately obtained TC variants which were simply better at FRET as opposed to higher order (> 1 molecule) ReAsH binding. These results suggest that a single TC motif in close proximity to the GFP is optimal for maximal FRET efficiency when compared with 3×TC variants. Interestingly, selected 1×TC peptides did display slightly improved ReAsH brightness when compared with the core 1×TC (Supplementary Figure 2C; ≤ 1.3-fold). This could be due to the small amino acid extensions found C-terminal to the core motif which may mediate more intimate contact with the phenoxazine ring of ReAsH.[9]
Figure 1.
FACS-based selection of GFP-3×TC peptides with improved ReAsH brightness. (A) Library approach for recombination based cloning of GFP-3×TC variants. Core tetracysteine motif (TetCys) indicated in red. (B) FACS analysis showing ReAsH emission as a function of GFP emission for sorts 5 through 8. Histograms were normalized to an isogenic HEK293FT cell line stably expressing GFP-1×TC which was analyzed alongside the 3×TC library for each sort. (C) Selected GFP-3×TC clones display increased ReAsH fluorescence and decreased GFP emission, due to either quenching or decreased GFP-3×TC expression when compared with the core GFP-1×TC and rationally designed GFP-3×TC (GS spacers between each TC motif) proteins. The individual histograms are plotted on the right and top.
Given that FRET based enrichment of 3×TC variants returned undesirable partially truncated 1×TC peptides, we chose to screen our 3×TC library for clones with improved ReAsH fluorescence by direct dye excitation. In this screen, to minimize signal arising from background staining we chose to use higher concentrations of the antidote BAL (1 mM) for FACS involving direct excitation of ReAsH. During this FACS screen, both the ReAsH fluorescence and GFP fluorescence were measured, so we could assess the ReAsH signal as a function of GFP expression. Iterative selections caused the population to shift to higher ReAsH fluorescence and slightly lower GFP fluorescence (Figure 1). The decrease in GFP emission could either be due to some quenching of GFP emission due to energy transfer to the bound ReAsH (as observed in the initial FRET sort) or decreased protein expression. After 8 rounds of selection, the final 3×TC expressing cell population exhibited improved ReAsH and diminished GFP fluorescence when compared to both the rationally designed 3×TC (GS linkers) and the core 1×TC motif (Figure 1C). Sequence analysis of > 20 3×TC peptides from sort 6 revealed three distinct variants: (1) GFP-3×TC22 (#LGL#INF#), (2) GFP-3×TC20 (#SHK#RPK#), and (3) GFP-2×TC1 (#ILE#RPR*). The only 3×TC motif isolated thereafter (sort 8) was the 3×TC20 (#SHK#RPK#) epitope.
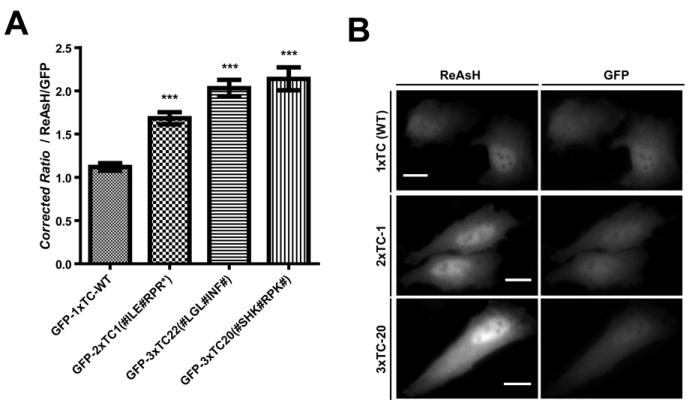
The isolated clones were tested for improved ReAsH brightness by analysis of single cells using fluorescence microscopy. ReAsH brightness was assessed as the ReAsH emission divided by the GFP emission in order to normalize for cell variability in protein expression. Analysis of ≥ 180 transiently transfected HeLa cells from three individual experiments demonstrated a ~1.5-fold increase in ReAsH brightness for GFP-2×TC1 and a ~2-fold increase in brightness for both GFP-3×TC (20 and 22) when compared with GFP-1×TC (Figure 2A,B). These improvements in signal output suggest that direct ReAsH-based FACS of 3×TC peptides is advantageous over FRET-based selections.
Figure 2.

Single cell analysis of TC peptides selected for increased ReAsH brightness. (A) Single cell fluorescence microscopy of live HeLa cells reveals enhanced ReAsH fluorescence ratios (~2-fold; ReAsH/GFP) when compared with GFP-1×TC (n ≥ 60 individual cells from at least 3 independent experiments; *** P < 0.0001). Error bars represent SEM. (B) Representative ReAsH fluorescence micrographs of GFP-TC expressing HeLa cells. Images were normalized to the relative GFP expression and rendered at equivalent contrast levels. Scale bars represent 10 μm.
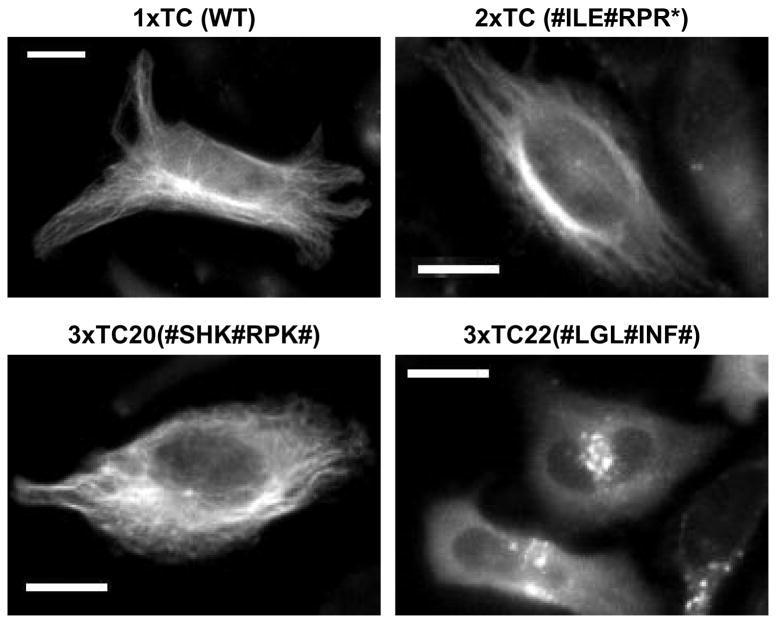
The ultimate goal of our 3×TC selections was to obtain new variants with improved fluorescence output. However, a second criterion for these peptides would be the modularity of the tag for labeling many diverse proteins. In order to assess the ability of these new TC variants to label proteins other than GFP, we tagged the mammalian cytoskeletal protein α-tubulin. The 3×TC20-, 2×TC1-, and 1×TC(WT)-α-tubulin variants were efficiently labeled with ReAsH when introduced by transient transfection into HeLa cells. However, the 3×TC22 motif led to perturbation of the characteristic α-tubulin filaments (Figure 3). It is possible the high degree of hydrophobicity presented by the 3ΧTC22 peptide linkers is responsible for the aggregation observed when fused to α-tubulin. Therefore, we feel that clone 3×TC22 is not appropriate for the modular tagging of diverse protein substrates, but may be useful for tagging hydrophobic or membrane associated proteins.
Figure 3.
Representative micrographs of ReAsH labeled TC-α-tubulin in HeLa cells. Protein variants 2×TC and 3×TC20 are modular biarsenical binding epitopes which efficiently label the protein α-tubulin. The construct 3×TC22-α-tubulin was unable to form and/or be labeled with ReAsH upon transient expression of this protein suggesting that this 3×TC motif may perturb this proteins function in vivo. Scale bars represent 10 μm.
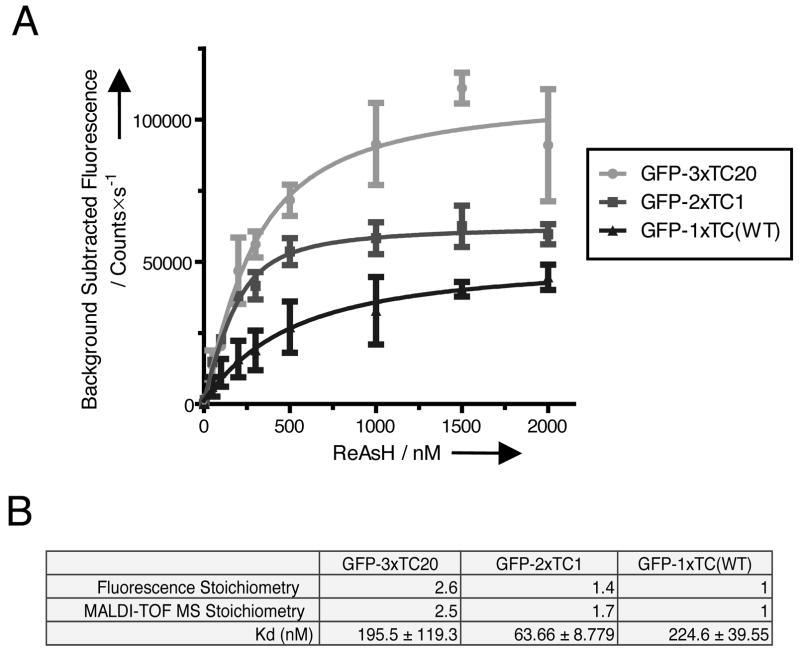
In order to understand the origin of the increased brightness of the 2×TC1 and 3×TC20 peptides we recombinantly expressed and purified the GFP-TC fusions. One plausible explanation for the increase in signal output of these TC motifs is increased ReAsH:protein stoichiometry. In vitro titration of the 3×TC20, 2×TC1, and core 1×TC GFP fusions under conditions favorable for stoichiometry determination revealed ratios of ~2.6 and ~1.4 ReAsH molecules per GFP-3×TC20 and GFP-2×TC1 protein respectively (Figure 4A,B). To further support these results, MALDI-TOF mass spectrometry was performed with ReAsH saturated (5-fold relative to total binding sites) protein yielding relative stoichiometries of ~2.5 and ~1.7 ReAsH molecules per GFP-3×TC20 and -2×TC1 protein respectively (Figure 4B). Taken together these results suggest that fluorescent quenching between proximally spaced ReAsH molecules is perhaps minimal because the mass spectrometry results, which are insensitive to quenching effects, closely agree with the fluorescence binding titrations. Although we observe an increase in stoichiometry, the binding sites are still not fully saturated (2.6 vs. 3 and 1.4-1.7 vs. 2) perhaps due to steric occlusion of ReAsH or oxidation of cysteine sulfhydryls.
Figure 4.
In vitro titration of selected recombinant GFP-TC peptides demonstrates increased ReAsH:peptide stoichiometries. (A) Fluorescence detected titration of GFP-TC variants shows increased signals with elevated saturation points when compared with the single core GFP-TC motif (n ≥ 3 from three independent experiments for each genotype). (B) Table comparison of the apparent stoichiometries and equilibrium dissociation constants for the selected GFP-3×TC20, -2×TC1, and -1×TC (WT) proteins. Mass spectrometry measurements of ReAsH saturated (~5-fold the number of binding sites) GFP-TC clones are in close agreement with the apparent stoichiometries estimated from the equilibrium titration experiments. It is important to note that under the conditions for ReAsH titration, estimation of the equilibrium dissociation constant is highly inaccurate, but more appropriate for estimation of the stoichiometry of the complex. Error bars represent SD.
In summary, we have selected new tandem TC peptide motifs which yield improved ReAsH brightness per peptide both in vitro and in live mammalian cells. We found selection of ReAsH emission relative to GFP emission allowed us to determine the increased brightness as a function of protein expression and this method of selection proved superior to FRET based selections when the ultimate goal was increased brightness. We identified modular 3×TC20 and 2×TC1 peptides that can be efficiently targeted to the cytoskeletal protein α-tubulin. In vitro analysis of the selected TC peptides revealed that the increased brightness resulted from coordination of multiple ReAsH dye molecules while minimizing quenching. The linker optimized repeats showed improved brightness relative to the rationally designed 3X-repeat, demonstrating that linker optimization can have a significant impact on the fluorescence properties. Addition of the 3×TC20 epitope to a protein of interest adds only ~3.3 KDa (30 amino acids) of mass to the existing core 1×TC motif which is still ~5.6-fold smaller than GFP (3×TC20: ~4.8 KDa; 44 amino acids vs. 238 for GFP). The 2×TC1 peptide offers a modest reduction in the overall mass of the tag (~3.5 KDa; 32 amino acids), but the overall brightness of this motif in cells is ~20% reduced compared with the 3×TC20 tag. We prefer the 3×TC20 tag as it provides superior brightness both in vitro and in living cells. Future studies may focus on exploring variations on this tandem TC motif by substituting with other TC motifs in order to increase the overall contrast achieved by this elegant bioorthogonal system.
Experimental Section
3×TC Library Generation
The gateway recombination system was utilized for generation of the semi-randomized 3×TC library according to the manufacturer’s protocol (Cloneminer, Invitrogen; Carlsbad, CA). Briefly, two synthetic and partially complementary oligonucleotides were designed to anneal to the second TC coding region and contained three flanking randomized codon triplets (NNK)3 accompanied by the first and third TC coding regions (3×TCLib = TC1-(NNK)3-TC2-(NNK)3-TC3-STOP) (IDT;Coralville, IA). These oligonucleotides were annealed and filled in with Klenow fragment (3’→5’ exonuclease negative) (NEB; Ipswitch, MA). Complementary oligonucleotides were synthesized with attB1 (5’) and attB2 (3’) recombination sequences and used to template the 3×TC library generating: attB1-3×TCLib-attB2 dsDNA. Klenow was heat inactivated and the resulting dsDNA was concentrated by ethanol precipitation with glycogen (2 μg×μL). Multiple BP recombinase reactions were recombined into the vector pDONR221, electroporated into ElectroMax DH10B T1R E. Coli, and grown overnight in LB (200 mL) with kanamycin (Invitrogen). The resulting library was calculated to contain ~1.2×10⁷ members. The pDONR-3×TC library was then recombined into the custom linearized destination vectors pCLNCX-eGFP-DEST using the LR recombinase (Imgenex; Invitrogen), electroporated pooled reactions into ElectroMax DH10B T1R cells, and grown overnight in LB (200 mL) and ampicillin. The resulting library was calculated to contain ~1.2×10⁷ library members, thus preserving the diversity of the original pDONR-3×TC library. The vector library pCL-GFP-3×TCLib was cotransfected with Trans-IT LT1 (Mirus Bio; Madison, WI) and the viral packaging vector pCL-Ampho (Imgenex; San Diego, CA) into six 10-cm dishes containing HEK293FT (Invitrogen) cells at 50% confluence. Virus was harvested 24 and 48 hours post-transfection and stored at -80° C. Pooled virus was titered by flow cytometry at 3.3×10⁶ GFU×mL-1 in HEK293FT cells. Ten 175 cm2 flasks containin a total of 330 million HEK293FT cells were infected at an MOI of ~0.55.
Flow cytometry analysis
GFP-3×TC library transduced cells were cultured in DMEM supplemented with fetal bovine serum (10%; FBS), penicillin/streptomcyin (100 μg×mL-1), L-glutamine (5 mM), sodium pyruvate (1 mM), and MEM non-essential amino acids (0.1 mM; Gibco). Approximately 20 million GFP positive cells were collected using a MoFlow flow cytometer (Dako-Cytomation; Fort Collins, CO) with a single 488-nm laser and 530/40-nm emission filter. GFP enrichment repeated twice more for a total of three rounds of GFP enrichment. Post sort 3, cells were rinsed once in Hank’s Balanced Salt Solution (HBSS; Invitrogen) and stained with ReAsH (0.5 μM) (Invitrogen) and 1,2-ethanedithiol (10 μM, EDT; Sigma-Aldrich) for 1 hour at 37° C and CO2 (5%). Monolayers were rinsed repeatedly in HBSS and overlayed with either 2,3-dimercaptopropanol (0.25 mM or 1.0 mM, BAL; Sigma-Aldrich) for FRET-based or ReAsH-based selections respectively. For the FRET-based selections, the 488-nm laser was used for excitation with 530/40-nm (GFP), and 630/30-nm (FRET) bandpass emission filters. For direct ReAsH-based selections, both 488-nm and 568-nm lasers were used for excitation with 530/40-nm (GFP), and 630/30-nm (ReAsH) bandpass emission filters. All rounds of selection were normalized using an isogenic GFP-1×TC or -3×TC (GS Spacers) expressing stable HEK293FT cell line. Flow cytometry data was collected using Summit Software v2.0 (Dako-Cytomations). Cells expressing the GFP-3×TC library were enriched for GFP fluorescence for the first 3 rounds of sorting. The top 10% of ReAsH+/GFP-TetCys+ cells were collected in early rounds of sorting. During the final 3-4 rounds of sorting only the top 1-3% of the brightest FRET or ReAsH cell population was collected. No compensation was performed in any sorting experiments. All raw flow cytometry data presented was manipulated and visualized using FlowJo software (Tree Star; Ashland, OR).
Sequence Retrieval
FRET-based enriched single cells were sorted into individual wells of 96-well tissue culture plates (~30% survival rate). Total RNA was isolated from clonal cell populations using the RNeasy Mini kit (Qiagen; Valencia, CA) and reverse transcribed with Omniscript reverse transcriptase (Qiagen) using a primer complementary to the 3’ end of the attB2 recombination site. The cDNA of each GFP-3×TC clone was PCR amplified, gel purified, and sequenced with both a GFP specific 5’ and 3’-attB2 primer. For ReAsH-based enriched cells, the entire population of sort 6 or 8 was used for total RNA extraction and reverse transcription as described above. The cDNA library was then PCR amplified using primers annealing to the 5’ start of GFP and 3’ attB2 site downstream of the 3×TC motif. The PCR products were then digested with BamHI and EcoRI restriction enzymes and shotgun cloned into pCDNA3.1(+) (Invitrogen). Greater than 20 individual clones were selected for sequencing from each sort round using the universal BGHR sequencing primer. Where indicated, 3×TC sequences were used in template PCR reactions to tag the N-terminus of the human α-tubulin 1b protein. Full length 3×TC tagged α-tubulin coding sequences were cloned into the pCDNA3.1(+) (Invitrogen) expression vector with HindIII and XhoI sites.
Microscopic Analysis
Semi-confluent HeLa monolayers were transfected with the indicated GFP-TC variants or plasmid DNA. After 24-48 hours cell monolayers were rinsed with HBSS and overlayed with ReAsH (0.5 μM) and EDT (10 μM) in HBSS for 1 hour at 37° C and CO2 (5%). Cells were then incubated with BAL (1 mM) in HBSS for 30 minutes at room temperature. The monolayer was then washed thrice with BAL (1 mM) in HBSS and overlayed with regular HBSS for the duration of the microscopy experiment. Cells were imaged using a Ziess Axiovert 200M (Ziess, Thornwood, NY) microscope equipped with Lambda 10-3 filter changer (Sutter Instruments, Navato, CA). Images were acquired using a Cascade 512B CCD camera (Roper Scientific, Trenton, NJ) using METAFLUOR software (Universal Imaging, Sunnyvale, CA). This microscope is equipped with an 1.4 NA 40× PlanAPO objective (Zeiss) and the fluorescence channels were collected with the following filter combinations: ReAsH: 577/20 (excitation), 630/60 (emission), and 595 (dichroic); GFP 480/20 (excitation), 520/10 (emission), and 515 (dichroic); FRET: 480/20 (excitation), 630/60 (emission), and 595 (dichroic). The following exposure times were used for image acquisition: 300 ms (GFP), 400 ms (ReAsH), and 200 ms (FRET). FRET ratios represent the sensitized emission of the acceptor ReAsH divided by the emission of the donor GFP. Fields of view were selected at random and every observable cell expressing GFP-TetCys was quantified. Regions of interest (ROI) were selected in the cell cytosol, avoiding the nucleus, and background subtracted by subtracting the average pixel intensity of a ROI containing no cells. Additionally, ReAsH intensity was background corrected by subtracting the average pixel value for cells equivalently stained/destained, but not expressing GFP-TetCys protein. Quantitative fluorescence image analysis was performed using METAFLUOR software (Universal Imaging).
Recombinant protein purification and stoichiometry determinations
GFP-TC variants were subcloned into pBAD24 using BamHI and EcoRI sites yielding an N-terminal His6 tag (Invitrogen). Expression of GFP-TC variants were carried out using Top10 E. Coli (Invitrogen) with arabinose (0.2%) for induction. Cells were lysed by freeze-thawing and sonication in PO4 (100 mM; pH 7.2), NaCl (150 mM), imidazole (20 mM), and tris-(2-carboxyethyl)phosphine HCl (1mM; TCEP; Sigma-Aldrich). Lysates were clarified and GFP-TC protein was purified using Ni2+-NTA agarose (Qiagen). Eluted protein was buffer exchanged into PO4 (100 mM; pH 7.2), NaCl (150 mM), and TCEP (3.5 mM). GFP-TC Protien concentration was estimated using the molar extinction coefficient of GFP (ε = 55 mM-1×cm-1).[10] ReAsH was titrated with GFP-TC (200 nM) protein and allowed to equilibrate for 15-18 hours at 4° C. MALDI-TOF analysis was performed with ~25 μM of ReAsH saturated (5-fold relative to binding sites) GFP-TetCys variants. Proteins were desalted using C4 ZipTips (Millipore, Billerica, MA) and spotted directly to MALDI sample plates using sinapinic acid (Sigma) as matrix. Mass spectra were collected using an Applied Biosystems Voyager-DE STR MALDI-TOF MS (Foster City, CA) in positive mode. Representative mass spectra are presented in Supplementary Figure 3. Fluorescence measurements were performed on a PTI spectrofluorimeter with 550-nm excitation (1-nm slit width) and 608-nm emission (2-nm slit width) (PTI; Birmingham, NJ). All fluorescence measurements were normalized using the peak Xe-lamp output as reference. Titrations were performed under conditions which yield accurate stoichiometry determinations, but poor approximations for equilibrium dissociation constants (Kd) (i.e. the protein concentration was much higher than the expected Kd). At least three independent titrations were performed for each of the GFP-TC variants described. Titration curves were plotted in Graphpad Prism software (Graphpad Software; La Jolla, CA) and the apparent stoichiometry and Kd were fit using a multi-site saturation relationship with no assumptions, as described previously.[11]
Supplementary Material
Acknowledgments
We would like to thank Dr. Brent Martin for helpful experimental advice. This work was supported by the NIH Creative Training in Molecular Biology grant (NIH 5 T32GM07135-33) and the University of Colorado.
Footnotes
The authors declare no competing financial interest.
References
- 1.Chen I, Ting AY. Curr Opin Biotechnol. 2005;16:35–40. doi: 10.1016/j.copbio.2004.12.003. [DOI] [PubMed] [Google Scholar]
- 2.Marks KM, Nolan GP. Nat Methods. 2006;3:591–596. doi: 10.1038/nmeth906. [DOI] [PubMed] [Google Scholar]
- 3.Griffin BA, Adams SR, Tsien RY. Science. 1998;281:269–272. doi: 10.1126/science.281.5374.269. [DOI] [PubMed] [Google Scholar]
- 4.Hoffmann C, Gaietta G, Bunemann M, Adams SR, Oberdorff-Maass S, Behr B, Vilardaga JP, Tsien RY, Ellisman MH, Lohse MJ. Nat Methods. 2005;2:171–176. doi: 10.1038/nmeth742. [DOI] [PubMed] [Google Scholar]
- 5.Gaietta G, Deerinck TJ, Adams SR, Bouwer J, Tour O, Laird DW, Sosinsky GE, Tsien RY, Ellisman MH. Science. 2002;19:503–507. doi: 10.1126/science.1068793. [DOI] [PubMed] [Google Scholar]
- 6.Adams SR, Campbell RE, Gross LA, Martin BR, Walkup GK, Yao Y, Llopis J, Tsien RY. J Am Chem Soc. 2002;124:6063–6076. doi: 10.1021/ja017687n. [DOI] [PubMed] [Google Scholar]
- 7.Martin BR, Giepmans BN, Adams SR, Tsien RY. Nat Biotechnol. 2005;23:1308–1314. doi: 10.1038/nbt1136. [DOI] [PubMed] [Google Scholar]
- 8.Van Engelenburg SB, Palmer AE. Chem Biol. 2008;15:619–628. doi: 10.1016/j.chembiol.2008.04.014. [DOI] [PMC free article] [PubMed] [Google Scholar]
- 9.Madani F, Lind J, Damberg P, Adams SR, Tsien RY, Graslund AO. J Am Chem Soc. 2009;131:4613–4615. doi: 10.1021/ja809315x. [DOI] [PMC free article] [PubMed] [Google Scholar]
- 10.Tsien RY. Annu Rev Biochem. 1998;67:509–544. doi: 10.1146/annurev.biochem.67.1.509. [DOI] [PubMed] [Google Scholar]
- 11.Goodman JL, Fried DB, Schepartz A. Chembiochem. 2009;10:1644–1647. doi: 10.1002/cbic.200900207. [DOI] [PMC free article] [PubMed] [Google Scholar]
Associated Data
This section collects any data citations, data availability statements, or supplementary materials included in this article.


