

Abstract
After the emergence of the H1N1 influenza in 2009, some countries responded with travel-related controls during the early stage of the outbreak in an attempt to contain or slow down its international spread. These controls along with self-imposed travel limitations contributed to a decline of about 40% in international air traffic to/from Mexico following the international alert. However, no containment was achieved by such restrictions and the virus was able to reach pandemic proportions in a short time. When gauging the value and efficacy of mobility and travel restrictions it is crucial to rely on epidemic models that integrate the wide range of features characterizing human mobility and the many options available to public health organizations for responding to a pandemic. Here we present a comprehensive computational and theoretical study of the role of travel restrictions in halting and delaying pandemics by using a model that explicitly integrates air travel and short-range mobility data with high-resolution demographic data across the world and that is validated by the accumulation of data from the 2009 H1N1 pandemic. We explore alternative scenarios for the 2009 H1N1 pandemic by assessing the potential impact of mobility restrictions that vary with respect to their magnitude and their position in the pandemic timeline. We provide a quantitative discussion of the delay obtained by different mobility restrictions and the likelihood of containing outbreaks of infectious diseases at their source, confirming the limited value and feasibility of international travel restrictions. These results are rationalized in the theoretical framework characterizing the invasion dynamics of the epidemics at the metapopulation level.
Introduction
The human mobility flows that determine the spreading of infectious diseases and the control measures based on limiting or constraining human mobility are considered in the contingency planning of several countries [1]. The target of these control measures is the decrease of travel to/from the areas affected by the epidemic outbreak and the corresponding decline of infected individuals reaching countries not yet affected by the epidemic. While the effects of slowing down the international propagation of an epidemic can be statistically evaluated based on available data and bootstrap techniques [2], the impossibility of disentangling the role played by travel from other contributing factors in the spread of an epidemic [3] has generated discussion about the appropriate strategy for mobility restrictions. In this context the only way to systematically gauge uncertainty and the effectiveness of competing control strategies is through data-driven modeling efforts [4]–[9]. Unfortunately, most previous works have focused on synthetic pandemic influenza scenarios and only a few empirical examples are available to validate models and evaluate the effectiveness of travel restrictions in general [10]–[12].
In the recent 2009 H1N1 pandemic (H1N1pdm), control measures included travel bans to/from Mexico, the screening of travelers on entry into airports, and travel advisories against non-essential travel to Mexico [1]. The aggregation of data on the H1N1pdm therefore represents an unprecedented opportunity to calibrate and validate a modeling approach to the global spread of epidemics that integrates detailed information on human mobility and travel. In the present work, we use the Global Epidemic and Mobility model (GLEaM) [13] that, fully integrating high resolution demographic and mobility data, allows the calibration to the H1N1pdm data of the invasion during the early stage of the epidemic and the exploration of hypothetical scenarios in which reductions in the international travel to/from Mexico with different timing and magnitude are considered. Interventions acting on mobility are found to be scarcely efficient in delaying the invasion process of the pandemic. This computational evidence can be explained within a simplified theoretical framework in terms of a phase transition between invasion and non-invasion dynamics of the metapopulation system, where the critical value is crucially affected by the topological fluctuations of the mobility network.
Methods
Model description
The Global Epidemic and Mobility model is based on a metapopulation scheme [4], [8], [9], [14]–[20] in which the world is divided into geographical regions defining a subpopulation network where connections among subpopulations represent the individual fluxes due to the transportation and mobility infrastructure. GLEaM is composed of three different layers [13]: (i) the population layer that integrates census areas for a total of 3,362 subpopulations around major transportation hubs in 220 countries of the world with a resolution up to ¼°×¼° [21]; (ii) the human mobility layer that integrates both commuting flows collected from various sources in more than 30 countries and airline traffic flows provided by the International Air Transport Association (IATA) database [22]; and (iii) the disease dynamics layer that implements a refined SEIR-like model [23] taking into account the specific etiology of the H1N1pdm [18].
The model simulates short-range mobility between subpopulations with a time scale separation approach that defines the effective force of infections in connected subpopulations [13], [18], [24], [25]. The airline mobility from one subpopulation to another is modeled by an individual based stochastic procedure in which the number of passengers of each compartment traveling from a subpopulation j to a subpopulation l is an integer random variable defined by the actual data from the airline transportation database [8]. The infection dynamics takes place within each subpopulation. We adopt a SEIR-like model [23] in which we consider separate compartments for symptomatic traveling and not traveling, as well as asymptomatic individuals in each subpopulation. More in detail, a susceptible individual in contact with a symptomatic or asymptomatic infectious person contracts the infection at rate β or rββ [26], [27], respectively, and enters the latent compartment where he is infected but not yet infectious. After an average latency period ε −1, each latent individual becomes infectious, entering the symptomatic compartments with probability 1−p a or becoming asymptomatic with probability p a [26], [27]. The symptomatic cases are further divided between those who are allowed to travel (with probability p t) and those who would stop traveling when ill (with probability 1−p t) [26]. Infectious individuals recover permanently with rate µ. A schematic representation of the compartmental structure is reported in Figure 1. All transitions defining infection dynamics and mobility processes are modeled through binomial and multinomial stochastic variables to mimic the discrete and stochastic nature of the epidemic spreading [8], [13] that is extremely relevant especially at the start of the outbreak (see the SI for details). The time resolution of both mobility and infection dynamics is of one day. Seasonal effects are taken into account by applying a sinusoidal rescaling of the reproductive number according to the time of the year and the hemisphere of location of the subpopulation [4]. In particular, the scaling factor ranges from αmin during the summer season to αmax during the winter season. Here we consider αmax = 1.1, whereas αmin assumes the best estimate value obtained from the calibration of the model to the H1N1pdm invasion data (see next Subsection) [18].
Figure 1. Modeling the 2009 H1N1 pandemic spread with GLEaM.

A, Illustration of the global invasion of the 2009 H1N1 pandemic during the early stage of the outbreak. The arrows represent the seeding of unaffected countries due to infected individuals traveling from Mexico. The color code indicates the time of the seeding. The map shows the layer of the worldwide air transportation network, which is incorporated into GLEaM. B, Compartmental structure in each subpopulation of GLEaM. Each individual is classified by one of the following discrete states: susceptible, latent, symptomatic infectious who can travel, symptomatic infectious who are hampered in their travels by the severity of the illness, asymptomatic infectious, and permanently recovered/removed [23], [26]. We assume that the latency period is equivalent to the incubation period and that no secondary transmissions occur during the incubation period. In addition, the asymptomatic individuals are assumed to be less infectious with respect to the symptomatic ones, with a relative infectiousness rβ, that is half the infectiousness of symptomatic individuals. All parameter values are reported in Table 3 of the SI.
Model calibration
The model is calibrated on the H1N1pdm data. The initial conditions of the epidemic are set near La Gloria, Mexico, on 18 February 2009 in agreement with the information published in official reports and with previous works [18], [28], [29]. Infection parameters describing the transmission potential and the duration of the stages of the disease are obtained through a maximum likelihood procedure based on the empirical data of the H1N1 international seeding events (see Figure 1A). In particular, we use the reproductive number R0 = 1.75 with the generation interval set to 3.6 days (average latency period ε −1 = 1.1 days and average infectious period µ −1 = 2.5 days). Through a maximum likelihood approach, the above estimates are obtained that best reproduce the actual chronology of newly infected countries (additional details can be found in Ref. [18]). The estimation method is computationally intensive as it involves a Monte Carlo generation of the distribution of arrival time of the infection in each country based on the analysis of 1 Million worldwide simulations of the pandemic evolution with the GLEaM model. The best estimate of the reproductive number refers to the reference value that has to be rescaled by the seasonality scaling function. The minimum scaling factor αmin determines the strength of the seasonality effect on the disease transmission. Here we consider αmin in the range [0.6–0.7], that is the best estimate obtained in Ref. [18] from the correlation analysis on the chronology of 93 countries seeded before June 18. The calibration of the model also takes into account the effects obtained by the control sanitary measures adopted in Mexico during the early stage of the epidemic [18], [30]. A thorough sensitivity analysis of the model calibration with respect to the disease natural history, initial conditions and other uncertainties in the data is reported in Ref. [18].
Travel-related interventions and simulated scenarios
During the early stage of the outbreak, several countries implemented a variety of travel-related interventions (see Text S1 for country-specific measures and implementation details). Such measures, in addition to a spontaneous reaction of individuals to the health emergency, led to a reduction in the international traffic to/from Mexico of about 40% observed during the month of May, followed by smaller reductions in the following months, and resulting in a slow return to normality in about 3 months [31] (see Text S1). Here we consider as a reference scenario the one produced by the best estimates able to reproduce the initial chronology of newly infected countries (i.e. the baseline scenario), where in addition we take into account the empirically observed drop in air traffic, following the data reported in Table 2 of Text S1. The reference scenario is then compared to a set of hypothetical scenarios in which increasingly larger restrictions in individual mobility are considered, as well as different starting dates for the implementation of such restrictions. In addition, we also test scenarios in which country-specific air travel bans are applied, and scenarios in which ground mobility along the border between Mexico and the US is restricted (see Text S1).
It is important to stress that, contrary to previous approaches based on samples of airline mobility data [4], [9], GLEaM simulations take into account the full air travel database and the role of intra-country mobility as well as border commuting flows (e.g. across the US-Mexico border [18]). GLEaM allows for the detailed simulation of the time evolution of the spreading pattern by reproducing the infection dynamics and computing the number of travelers in each compartment. It is therefore possible to track the movement of H1N1 cases and analyze the statistics associated with arrival times, case importation, and local transmission based on many realizations that incorporate the relevant stochastic effects. The efficacy of travel-related measures is therefore measured on the timing of seeding events and resulting delays.
Results and Discussion
Reference scenario
Figure 2 summarizes the simulation's accurate reproduction of the observed relative magnitude of imported cases in the local epidemics of newly-affected countries that validate the model. Panels A, B show cases in the United Kingdom and Germany, respectively, during the early phase of the outbreak when case-based surveillance was deployed in order to detect imported H1N1 cases and monitor local H1N1 transmission [32], [33]. Computer simulations also allow us to explore the level of stochasticity associated with the importation of infectious individuals. We keep track for each time step of each realization of the contribution of imported cases to the total prevalence in the country defined as the ratio Q of imported cases versus the total number of infectious individuals in the country. Since at the early stage of the epidemic there are usually large fluctuations in the number of imported local transmission cases, we measure the probability in time of observing a given ratio Q by averaging over 2,000 realization of the global simulation. Panels 2C, 2D show the time behavior of the probability distribution P(Q) clearly illustrating that the importation of cases dominates the initial phase of the epidemic in each country, which is soon followed by a sustained local transmission. The contribution of imported cases is observed at 100% with a finite probability only during the months of April-May, after which the probability distribution progressively shrinks around small values of Q, showing how the local H1N1 transmission starts to dominate the epidemic.
Figure 2. Importation of cases.

A,B, Simulation results of the fraction Q of imported cases in United Kingdom (A) and Germany (B). The quantity Q is a measure of the relative weight of case importation with respect to local transmission events. The gray shaded areas show the 95% and 50% reference ranges of the simulation results obtained from 2,000 stochastic realizations. The surveillance data are indicated by red dots. C,D, Time evolution from April to November 2009 in the United Kingdom (C) and Germany (D) of the probability distribution to observe in any given realization of the epidemic the ratio Q between imported cases and the total number of cases. The probability distribution is obtained from the simulation of 2,000 stochastic realizations. Large values for the quantity Q are observed with high probability only in the early phase of the respective country's epidemic. The observed non-zero probability for a fraction of imported cases equal to zero at the early stage is due to the fact that the epidemic is imported in some cases by non-detectable individuals, such as latent and asymptomatic infectious individuals.
Travel restrictions and the H1N1pdm spatial spread
The good agreement of the model with the actual data from the H1N1pdm allows us to assess the effect of the observed decline in travel flows to/from Mexico by comparing the results obtained in the reference scenario with a version of the model in which no travel reduction is considered. Compartmentalization permits tracking of the arrival of detectable (i.e. symptomatic) and non-detectable (i.e. latent or asymptomatic) infected individuals in a given country. By defining the arrival time as the date the first symptomatic case arrives in the country under study, it is possible to quantify the delay in the spreading of the epidemic. It is quite impressive to notice that the 40% drop in travel flows observed in reality only led to an average delay in the arrival of the infection in other countries (i.e. the first imported case) of less than 3 days (see Text S1 for more details). We then test whether an additional decrease in travel flows of magnitudes larger than the observed 40% would have provided an additional benefit in slowing down the propagation of the H1N1 virus across the world. We consider drops in the air travel flows connecting Mexico with the rest of the world starting on April 25 following the international alert, optimistically assuming a prompt implementation by authorities with no further delays. We also assume that the reduction is kept constant across time, differently from the empirically observed decline that successively decreased to become negligible in about 3 months.
Figure 3 shows changes induced by travel restrictions on the simulated chronology with respect to the reference case by tracking the arrival time probability distribution. Results are reported in panels A, B of Figure 3, where application of the interventions is shown to reduce the probability values right after the peak of the distribution, with almost no change in the date of the peak. If we focus on the first arrival from Mexico, considering all possible seeding events (i.e. latent, asymptomatic, and symptomatic), we observe similar reductions in the rate of increase in the cumulative probability distribution of the seeding event, pointing to a slower rate of importation (see Figure 3C, D). However, the resulting change is not able to halt the spread.
Figure 3. Effects of restrictions in the air travel to/from Mexico on the probability distributions of the seeding events.

Travel measures imposing a reduction of  and
and
 are
compared to the reference scenario where the observed drop in air travel
to/from Mexico is taken into account. A,B,
Probability distributions of the arrival time (defined as the date of
arrival of the first symptomatic case) in the United Kingdom
(A) and Germany (B) for different values
of
are
compared to the reference scenario where the observed drop in air travel
to/from Mexico is taken into account. A,B,
Probability distributions of the arrival time (defined as the date of
arrival of the first symptomatic case) in the United Kingdom
(A) and Germany (B) for different values
of  . Here we consider the importation from any
possible source country, not only Mexico. The vertical dotted line
indicates the observed arrival time in the country, as obtained from
official reports, and the vertical solid line indicates the starting
date of the travel restrictions, April 25, 2009, the day after the
international alert. The probability distributions are obtained from
2,000 stochastic realizations and data are binned over 7 days. Even when
imposing
. Here we consider the importation from any
possible source country, not only Mexico. The vertical dotted line
indicates the observed arrival time in the country, as obtained from
official reports, and the vertical solid line indicates the starting
date of the travel restrictions, April 25, 2009, the day after the
international alert. The probability distributions are obtained from
2,000 stochastic realizations and data are binned over 7 days. Even when
imposing  , the peak
of the probability distribution is not delayed with respect to the real
scenario. C,D, Cumulative probability
distributions of the first seeding event from Mexico to the United
Kingdom (C) and Germany (D) for different
values of
, the peak
of the probability distribution is not delayed with respect to the real
scenario. C,D, Cumulative probability
distributions of the first seeding event from Mexico to the United
Kingdom (C) and Germany (D) for different
values of  . Here we
consider any source of infection in the seeding event, including
symptomatic cases and non-detectable infected cases, such as latent and
asymptomatic, as allowed by the computational approach. The
distributions are computed over 2,000 stochastic realizations. The
effect of travel restrictions is very limited in delaying the time at
which the cumulative distribution reaches the unit.
. Here we
consider any source of infection in the seeding event, including
symptomatic cases and non-detectable infected cases, such as latent and
asymptomatic, as allowed by the computational approach. The
distributions are computed over 2,000 stochastic realizations. The
effect of travel restrictions is very limited in delaying the time at
which the cumulative distribution reaches the unit.
By considering the time at which the cumulative probability for the seeding from Mexico has reached 90%, we can calculate the delay induced by larger reductions in air travel. Figure 4A shows the delays obtained for a selection of countries. Even given the unlikely assumption of a 90% travel reduction, the resulting delay would be on the order of 2 weeks, confirming results from previous studies [4], [5], [8], [9]. This time could be used to finalize the response by the public health infrastructure of unaffected countries following the international alert, thus gaining time to enhance surveillance systems and allocate resources. Unfortunately, this timescale is insufficient to develop and distribute a vaccine. Anticipation of travel reductions following local epidemiological alerts in Mexico or the onset of symptoms from the first case in the US would lead to similar results (see panel B of Figure 4).
Figure 4. Delaying effects in the international spread.

A, Delay in the case importation from Mexico to a given
country compared with the reference scenario as a function of the travel
reduction  . The delay
is measured in terms of the date at which the cumulative distribution of
the seeding from Mexico (see Figure 2) reaches 90%. The
dotted line shows the logarithmic behavior relating the delay as a
function of the imposed restrictions. The largest delay, gained when
imposing
. The delay
is measured in terms of the date at which the cumulative distribution of
the seeding from Mexico (see Figure 2) reaches 90%. The
dotted line shows the logarithmic behavior relating the delay as a
function of the imposed restrictions. The largest delay, gained when
imposing  , is less
than 20 days for all countries. The model also considers the
implementation of sanitary interventions in Mexico during the early
stage that was able to damp the exponential increase of cases in the
outbreak zone. Travel restrictions would therefore lead to a larger
impact during this phase due to the mitigating effect on the local
epidemic. If a country is seeded during this phase, the resulting delay
induced by the travel restrictions would be larger, thus creating the
observed differences in the resulting delays by country. B,
as in A, where earlier dates for the start of the
intervention are considered, has a fixed
, is less
than 20 days for all countries. The model also considers the
implementation of sanitary interventions in Mexico during the early
stage that was able to damp the exponential increase of cases in the
outbreak zone. Travel restrictions would therefore lead to a larger
impact during this phase due to the mitigating effect on the local
epidemic. If a country is seeded during this phase, the resulting delay
induced by the travel restrictions would be larger, thus creating the
observed differences in the resulting delays by country. B,
as in A, where earlier dates for the start of the
intervention are considered, has a fixed  : April 25,
corresponding to the day after the international alert; April 16,
corresponding to the epidemic alert in Mexico; March 28, corresponding
to the onset of symptoms of the first case in the US; and 6 weeks before
the international alert. In all these scenarios and for different
countries, the delay is always less than 20 days, highlighting that even
the enforcement of strong travel reduction as early as possible would
have had little effect.
: April 25,
corresponding to the day after the international alert; April 16,
corresponding to the epidemic alert in Mexico; March 28, corresponding
to the onset of symptoms of the first case in the US; and 6 weeks before
the international alert. In all these scenarios and for different
countries, the delay is always less than 20 days, highlighting that even
the enforcement of strong travel reduction as early as possible would
have had little effect.
The exponential increase of cases in the outbreak region explains the negligible
impact of travel restrictions over the course of the pandemic. Given two coupled
populations with deterministic infection dynamics, the delay
 Δt is a logarithmic function of the
applied travel reduction of magnitude
Δt is a logarithmic function of the
applied travel reduction of magnitude  ,
,
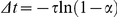 , where
  is the timescale
of the epidemic's exponential growth in the seed population [34], [35]. The
exponential increase of cases in the outbreak region is therefore responsible
for the relatively limited delay induced by strong and lasting travel
reductions. When
is the timescale
of the epidemic's exponential growth in the seed population [34], [35]. The
exponential increase of cases in the outbreak region is therefore responsible
for the relatively limited delay induced by strong and lasting travel
reductions. When  ,
,
 or
or  the corresponding
delays become approximately 1, 1.6, and 3 times, respectively, the timescale
the corresponding
delays become approximately 1, 1.6, and 3 times, respectively, the timescale
 that is typically on the order of a few days. The
logarithmic relation also explains more realistic situations in which the
epidemic origin is characterized by spatial heterogeneity and intra-region
mobility that is not subject to travel restrictions (see Text S1 for
the complete analytic treatment in this case). This is the case of the H1N1
pandemic, which initially diffused within Mexico before reaching international
hubs and propagating internationally.
that is typically on the order of a few days. The
logarithmic relation also explains more realistic situations in which the
epidemic origin is characterized by spatial heterogeneity and intra-region
mobility that is not subject to travel restrictions (see Text S1 for
the complete analytic treatment in this case). This is the case of the H1N1
pandemic, which initially diffused within Mexico before reaching international
hubs and propagating internationally.
Global invasion threshold
Another important question concerns the degree to which mobility restrictions are
able to achieve containment at the source of the pandemic, especially in
combination with timely mitigation policies in the country of origin. To this
end we consider a simplified modeling framework based on a metapopulation scheme
describing a network of subpopulations (nodes) coupled with mobility processes
(links, see Figure 5A) whose
features reproduce the topological and mobility properties of real-world
transportation systems [36], [37]. We assume: (i) the large-scale heterogeneity found
in the airline transportation network where the number of connections
k departing from each airport (i.e. the degree of the node)
follows a power-law distribution  ; and (ii) that the
observed correlations between topology and traffic, relating the number of
passengers wij traveling from airport
i to airport j to the degrees
ki and kj of the
two subpopulations is expressed by
; and (ii) that the
observed correlations between topology and traffic, relating the number of
passengers wij traveling from airport
i to airport j to the degrees
ki and kj of the
two subpopulations is expressed by 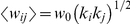 , with
 representing the mobility scale of the system [38].
Figure 5. Network heterogeneity and failure of travel restrictions aimed at containment.

A, Schematic illustration of the simplified modeling
framework based on a metapopulation scheme. At the macroscopic level the
system is composed of a heterogeneous network of subpopulations. At the
microscopic level, each subpopulation contains a population of
individuals. The infection dynamics are described by a simple
compartmentalization (compartments are indicated by different colored
dots in the picture). Within each subpopulation, individuals are mixed
homogeneously and can migrate from one subpopulation to another
following the mobility connections of the network. In this way the
disease can spread at the subpopulations level. B, Plot of
the global invasion threshold R*
described by Eq. (2). Here, R* is
plotted as a function of the basic reproductive number
R0 and the traffic reduction
 , which is
the parameter representing the percentage of variation in the total
traffic
, which is
the parameter representing the percentage of variation in the total
traffic  in Eq.
(2). Only in the case of extremely low values of
R0 or extremely large values of
in Eq.
(2). Only in the case of extremely low values of
R0 or extremely large values of
 is it
possible to reduce R* below the
threshold.
is it
possible to reduce R* below the
threshold.
Disregarding the high-resolution details of numerical approaches, this synthetic
metapopulation model can now be analyzed, defining a new theoretical framework
that allows for the study of epidemic containment. Starting from a single
subpopulation infected at time  , it is possible to
describe the invasion dynamics at the subpopulation level in a Levins-type
approach by considering the microscopic dynamics of infection and of individual
travel [37].
The system is characterized by a subpopulation reproductive number
R*. Analogous to the reproductive number
R
0 at the individual level,
R* indicates a threshold behavior of the
system: if R*>1 the epidemic reaches global
invasion; otherwise, it is contained at its source. It is possible to derive an
expression for the global invasion threshold in a branching process
approximation [39], [40]. Under the assumption that subpopulations having the
same number k of connections are equivalent (i.e. the
degree-block approximation, see Text S1), we define
, it is possible to
describe the invasion dynamics at the subpopulation level in a Levins-type
approach by considering the microscopic dynamics of infection and of individual
travel [37].
The system is characterized by a subpopulation reproductive number
R*. Analogous to the reproductive number
R
0 at the individual level,
R* indicates a threshold behavior of the
system: if R*>1 the epidemic reaches global
invasion; otherwise, it is contained at its source. It is possible to derive an
expression for the global invasion threshold in a branching process
approximation [39], [40]. Under the assumption that subpopulations having the
same number k of connections are equivalent (i.e. the
degree-block approximation, see Text S1), we define
 as the number of diseased subpopulations of degree
k at generation 0 (i.e. at the beginning of the branching
process). During the entire duration of the outbreak experienced by the
as the number of diseased subpopulations of degree
k at generation 0 (i.e. at the beginning of the branching
process). During the entire duration of the outbreak experienced by the
 subpopulations, each of them can in principle seed some
of the neighboring subpopulations thus leading to a number
subpopulations, each of them can in principle seed some
of the neighboring subpopulations thus leading to a number
 of diseased subpopulations of degree k
at generation 1, for various values of the degree k. By
iterating the seeding events, it is possible to describe the evolution of the
number
of diseased subpopulations of degree k
at generation 1, for various values of the degree k. By
iterating the seeding events, it is possible to describe the evolution of the
number  of diseased subpopulations with degree
k at generation n,
yielding:
of diseased subpopulations with degree
k at generation n,
yielding:
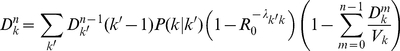 |
(1) |
The r.h.s. of Eq. (1) describes the contribution of the subpopulations of degree
k' at generation n-1 to the infection
of subpopulations with degree k at generation
n. Each of the  has
(k'−1) possible connections along which the
infection can proceed (−1 takes into account the link through which each
of those subpopulations received the infection). In order to infect a
subpopulation of degree k, three conditions need to occur: (i)
the connections departing from nodes with degree k' point
to subpopulations of degree k, as indicated by the conditional
probability
has
(k'−1) possible connections along which the
infection can proceed (−1 takes into account the link through which each
of those subpopulations received the infection). In order to infect a
subpopulation of degree k, three conditions need to occur: (i)
the connections departing from nodes with degree k' point
to subpopulations of degree k, as indicated by the conditional
probability  ; (ii) the reached subpopulations are not yet infected,
as indicated by the probability
; (ii) the reached subpopulations are not yet infected,
as indicated by the probability 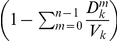 , where
 is the total number of subpopulations with degree
k; (iii) the outbreak seeded by
is the total number of subpopulations with degree
k; (iii) the outbreak seeded by
 infectious individuals traveling from
k' to k takes place, and the probability
for this event to happen is given by
infectious individuals traveling from
k' to k takes place, and the probability
for this event to happen is given by  [41]. The
latter term is the one that relates the microscopic dynamics of the local
infection occurring within a subpopulation to the coarse-grained view that
describes the disease invasion at the metapopulation level. It depends on the
details of the diffusion process of individuals as well as the individual travel
behavior and its interplay with the disease stages. The expression of
[41]. The
latter term is the one that relates the microscopic dynamics of the local
infection occurring within a subpopulation to the coarse-grained view that
describes the disease invasion at the metapopulation level. It depends on the
details of the diffusion process of individuals as well as the individual travel
behavior and its interplay with the disease stages. The expression of
 for the compartmental model here considered is derived
in Text
S1; by plugging it in to Eq. (1) we can derive the expression for the
global invasion threshold (more details are reported in Text
S1):
for the compartmental model here considered is derived
in Text
S1; by plugging it in to Eq. (1) we can derive the expression for the
global invasion threshold (more details are reported in Text
S1):
| (2) |
where  is a function that
depends on the reproductive number only;
is a function that
depends on the reproductive number only;  is a combination of
the infection parameters
is a combination of
the infection parameters  ,
,
 , pa and
pt;
, pa and
pt;  is a function of
the mobility scale
is a function of
the mobility scale  and of various
moments of the distribution of the number of connections
and of various
moments of the distribution of the number of connections
 of each airport. Eq. (2) shows that
R* thus depends on the disease
parameters, as well as the topology and fluxes of individuals'
mobility.
of each airport. Eq. (2) shows that
R* thus depends on the disease
parameters, as well as the topology and fluxes of individuals'
mobility.
The effect of interventions like travel restrictions, mitigation, etc., are
unfortunately damped by the large topological fluctuations of human mobility
patterns. The function  is expressed by
 (Text S1), so that the topological
heterogeneities encoded in
(Text S1), so that the topological
heterogeneities encoded in  lead to very large
values of the ratio
lead to very large
values of the ratio  , which suppresses
reduction in the travel flows in
, which suppresses
reduction in the travel flows in  , leading to values
of R* well above the threshold at 1 as shown by
the 3D plot reported in Figure
5B. Similar conclusions apply for entry screening at the airports
modeled by a reduction in the traveling probability
pt, and the modeling of effective containment
policies, reducing R0 and the total number of cases.
The large heterogeneity of human mobility patterns is therefore responsible for
why travel restrictions are largely ineffective for containing an emerging
pandemic.
, leading to values
of R* well above the threshold at 1 as shown by
the 3D plot reported in Figure
5B. Similar conclusions apply for entry screening at the airports
modeled by a reduction in the traveling probability
pt, and the modeling of effective containment
policies, reducing R0 and the total number of cases.
The large heterogeneity of human mobility patterns is therefore responsible for
why travel restrictions are largely ineffective for containing an emerging
pandemic.
Our analysis of the 2009 H1N1 pandemic shows that the observed decline in air travel to/from Mexico was of too small a magnitude to impact the international spread. Stricter regimes of travel reduction would have led to delays on the order of two weeks even in the optimistic case of early intervention. It is unlikely that given the ever-increasing mobility of people travel restrictions could be used effectively in a future pandemic event.
Supporting Information
(PDF)
Acknowledgments
We are grateful to the International Air Transport Association for making the airline commercial flight database available to us. We would like to thank Marco Quaggiotto for his help in the visualization design.
Footnotes
Competing Interests: The authors have declared that no competing interests exist.
Funding: This work has been partially funded by the National Institutes of Health R21-DA024259 award, the Lilly Endowment grant 2008 1639-000 and the DTRA-1-0910039 award to AV; the EC-ICT contract no. 231807 (EPIWORK) to AV and VC; the EC-FET contract no. 233847 (DYNANETS) to AV, VC, and JJR; the ERC Ideas contract n.ERC-2007-Stg204863 (EPIFOR) to VC, PB, CP, and MT. The funders had no role in study design, data collection and analysis, decision to publish, or preparation of the manuscript.
References
- 1.2010 Influenza A(H1N1) - measures adopted by governments worldwide. http://iata.org.tr/whatwedo/safety_security/safety/health_safety/measures.htm(2010) [Google Scholar]
- 2.Cowling BJ, Lau LL, Wu P, Wong HW, Fang VJ, et al. Entry screening to delay local transmission of 2009 pandemic influenza A (H1N1). BMC Infect. 2010;Dis10:82. doi: 10.1186/1471-2334-10-82. [DOI] [PMC free article] [PubMed] [Google Scholar]
- 3.Viboud C, Miller MA, Grenfell BT, Bjørnstad ON, Simonsen L. Air travel and the spread of influenza: important caveats. PLoS Med. 2006;3:e503. doi: 10.1371/journal.pmed.0030503. [DOI] [PMC free article] [PubMed] [Google Scholar]
- 4.Cooper BS, Pitman RJ, Edmunds WJ, Gay N. Delaying the international spread of pandemic influenza. PloS Med. 2006;3:e12. doi: 10.1371/journal.pmed.0030212. [DOI] [PMC free article] [PubMed] [Google Scholar]
- 5.Hollingsworth TD, Ferguson NM, Anderson RM. Will travel restrictions control the international spread of pandemic influenza? Nature Med. 2006;12:497–499. doi: 10.1038/nm0506-497. [DOI] [PubMed] [Google Scholar]
- 6.Ferguson NM, Cummings DAT, Fraser C, Cajka JC, Cooley PC, et al. Strategies for mitigating an influenza pandemic. Nature. 2006;442:448–452. doi: 10.1038/nature04795. [DOI] [PMC free article] [PubMed] [Google Scholar]
- 7.Germann TC, Kadau K, Longini IM, Jr, Macken CA. Mitigation strategies for pandemic influenza in the United States. Proc Nat Acad Sci U S A. 2006;103:5935–5940. doi: 10.1073/pnas.0601266103. [DOI] [PMC free article] [PubMed] [Google Scholar]
- 8.Colizza V, Barrat A, Barthélemy M, Valleron A-J, Vespignani A. Modeling the worldwide spread of pandemic influenza: baseline case and containment interventions. PLoS Med. 2007;4:e13. doi: 10.1371/journal.pmed.0040013. [DOI] [PMC free article] [PubMed] [Google Scholar]
- 9.Epstein JM, Goedecke M, Yu F, Morris RJ, Wagener DK, et al. Controlling pandemic flu: the value of international air travel restrictions. PLoS ONE. 2007;2:e401. doi: 10.1371/journal.pone.0000401. [DOI] [PMC free article] [PubMed] [Google Scholar]
- 10.World Health Organization (WHO) Writing Group. Non-pharmaceutical interventions for pandemic influenza, international measures. Emerg Infect Dis. 2006;12:81–8. doi: 10.3201/eid1201.051370. [DOI] [PMC free article] [PubMed] [Google Scholar]
- 11.Bell DM. Public health interventions and SARS spread, 2003. Emerg Infect Dis. 2004;10:1900–1906. doi: 10.3201/eid1011.040729. [DOI] [PMC free article] [PubMed] [Google Scholar]
- 12.Brownstein J, Wolfe CJ, Mandl KD. Empirical evidence for the effect of airline travel on inter-regional influenza spread in the United State. PLoS Med. 2006;3:e401. doi: 10.1371/journal.pmed.0030401. [DOI] [PMC free article] [PubMed] [Google Scholar]
- 13.Balcan D, Colizza V, Gonçalves B, Hu H, Ramasco JJ, et al. Multiscale mobility networks and the spatial spreading of infectious diseases. Proc Natl Acad Sci U S A. 2009;106:21484–21489. doi: 10.1073/pnas.0906910106. [DOI] [PMC free article] [PubMed] [Google Scholar]
- 14.Hufnagel L, Brockmann D, Geisel T. Forecast and control of epidemics in a globalized world. Proc Natl Acad Sci USA. 2004;101:15124–15129. doi: 10.1073/pnas.0308344101. [DOI] [PMC free article] [PubMed] [Google Scholar]
- 15.Rvachev LA, Longini IM. A mathematical model for the global spread of influenza. Math Biosci. 1985;75:3–22. [Google Scholar]
- 16.Grais RF, Ellis JH, Glass GE. Assessing the impact of airline travel on the geographic spread of pandemic influenza. Eur J Epidemiol. 2003;18:1065–1072. doi: 10.1023/a:1026140019146. [DOI] [PubMed] [Google Scholar]
- 17.Colizza V, Barrat A, Barthé lemy M, Vespignani A. The role of the airline transportation network in the prediction and predict- ability of global epidemics. Proc Natl Acad Sci USA. 2006;103:2015–2020. doi: 10.1073/pnas.0510525103. [DOI] [PMC free article] [PubMed] [Google Scholar]
- 18.Balcan D, Hu H, Goncalves B, Bajardi P, Poletto C, et al. Seasonal transmission potential and activity peaks of the new influenza A(H1N1): a Monte Carlo likelihood analysis based on human mobility. BMC Med. 2009;7:45. doi: 10.1186/1741-7015-7-45. [DOI] [PMC free article] [PubMed] [Google Scholar]
- 19.Flahault A, Valleron A-J. A method for assessing the global spread of HIV-1 infection based on air-travel. Math Popul Stud. 1991;3:1–11. doi: 10.1080/08898489209525336. [DOI] [PubMed] [Google Scholar]
- 20.Flahault A, Vergu E, Coudeville L, Grais R. Strategies for containing a global influenza pandemic. Vaccine. 2006;24:6751–6755. doi: 10.1016/j.vaccine.2006.05.079. [DOI] [PubMed] [Google Scholar]
- 21.Center for International Earth Science Information Network. (CIESIN), Columbia University; and Centro Internacional de Agricultura Tropical (CIAT). The Gridded Population of the World Version 3 (GPWv3): Population Grids. Palisades, NY: Socioeconomic Data and Applications Center (SEDAC), Columbia University. http://sedac.ciesin.columbia.edu/gpw.
- 22. International Air Transport Association (IATA), http://www.iata.org/
- 23.Anderson RM, May RM. Oxford: Oxford University Press; 1992. Infectious Diseases of Humans: Dynamics and Control. [Google Scholar]
- 24.Keeling M, Rohani P. Estimating spatial coupling in epidemiological systems: a mechanistic approach. Ecology Letters. 2002;5:20–29. [Google Scholar]
- 25.Sattenspiel L, Dietz K. A structured epidemic model incorporating geographic mobility among regions. Math Biosci. 1995;128:71–91. doi: 10.1016/0025-5564(94)00068-b. [DOI] [PubMed] [Google Scholar]
- 26.Longini IM, Halloran ME, Nizam A, Yang Y. Containing pandemic influenza with antiviral agents. Am J Epidemiol. 2004;159:623. doi: 10.1093/aje/kwh092. [DOI] [PubMed] [Google Scholar]
- 27.Longini IM, Nizam A, Xu S, Ungchusak K, Hanshaoworakul W, et al. Containing pandemic influenza at the source. Science. 2005;309:1083. doi: 10.1126/science.1115717. [DOI] [PubMed] [Google Scholar]
- 28.Fraser C, Donnelly CA, Cauchemez S, Hanage WP, Van Kerkhove MD, et al. Pandemic Potential of a Strain of Influenza A (H1N1): Early Findings. Science. 2009;324:1557–1561. doi: 10.1126/science.1176062. [DOI] [PMC free article] [PubMed] [Google Scholar]
- 29. Secretaria de Salud, Mexico. Brote de infeccion respiratoria aguda en La Gloria, Municipio de Perote, Mexico. http://portal.salud.gob.mx/contenidos/noticias/influenza/estadisticas.html.
- 30.Cruz-Pacheco G, Duran L, Esteva L, Minzoni AA, López-Cervantes M, et al. Modelling of the influenza A(H1N1)v outbreak in Mexico City, April-May 2009, with control sanitary measures. Euro Surveill. 2009;14: pii = 19254. [PubMed] [Google Scholar]
- 31.Boletín Mensual de Estadística Operacional. Secretaría de comunicaciones y transportes. http://www.sct.gob.mx/uploads/media/BO_DICIEMBRE_09.pdf (2009) [Google Scholar]
- 32.Health Protection Agency, Health Protection Scotland, National Public Health Service for Wales, HPA Northern Ireland Swine influenza investigation teams. Epidemiology of new influenza A (H1N1) virus infection, United Kingdom, April – June 2009. Euro Surveill. 2009;14:pii = 19232. [PubMed] [Google Scholar]
- 33.Novel influenza A(H1N1) investigation team. Description of the early stage of pandemic (H1N1) 2009 in Germany, 27 april-16 June 2009. Euro Surveill. 2009;14:pii = 19295. doi: 10.2807/ese.14.31.19295-en. [DOI] [PubMed] [Google Scholar]
- 34.Scalia Tomba G, Wallinga J. A simple explanation for the low impact of border control as a countermeasure to the spread of an infectious disease. Math. Biosci. 2008;214:70–72. doi: 10.1016/j.mbs.2008.02.009. [DOI] [PubMed] [Google Scholar]
- 35.Gautreau A, Barrat A, Barthelemy M. Global disease spread: Statistic and estimation on arrival times. J Theo Bio. 2008;251:509–522. doi: 10.1016/j.jtbi.2007.12.001. [DOI] [PubMed] [Google Scholar]
- 36.Colizza V, Pastor-Satorras R, Vespignani A. Reaction-diffusion processes and metapopulation models in heterogeneous networks. Nature Phys. 2007;3:276. [Google Scholar]
- 37.Colizza V, Vespignani A. Epidemic modeling in metapopulation systems with heterogeneous coupling pattern: Theory and simulations. J Theor Biol. 2008;251:450–467. doi: 10.1016/j.jtbi.2007.11.028. [DOI] [PubMed] [Google Scholar]
- 38.Barrat A, Barthélemy M, Pastor-Satorras R, Vespignani A. The architecture of complex weighted networks. Proc Natl Acad Sci U S A. 2004;101:3747. doi: 10.1073/pnas.0400087101. [DOI] [PMC free article] [PubMed] [Google Scholar]
- 39.Harris TE. The theory of branching processes. 1989. Dover Publications. [DOI] [PMC free article] [PubMed]
- 40.Vazquez A. Polynomial Growth in Branching Processes with Diverging Reproductive Number. Phys Rev Lett. 2006;96:038702. doi: 10.1103/PhysRevLett.96.038702. [DOI] [PubMed] [Google Scholar]
- 41.Murray JD. 3rd edition Berlin: Springer Verlag; 2005. Mathematical Biology. [Google Scholar]
Associated Data
This section collects any data citations, data availability statements, or supplementary materials included in this article.
Supplementary Materials
(PDF)