Abstract
Acetyl CoA carboxylase (ACC1 & ACC2) generates malonyl CoA, a substrate for de novo lipogenesis (DNL) and an inhibitor of mitochondrial fatty acid β-oxidation (FAO). Malonyl CoA is also a substrate for microsomal fatty acid elongation, an important pathway for saturated (SFA), mono- (MUFA) and polyunsaturated fatty acid (PUFA) synthesis. Despite the interest in ACC as a target for obesity and cancer therapy, little attention has been given to the role ACC plays in long chain fatty acid synthesis. This report examines the effect of pharmacological inhibition of ACC on DNL & palmitate (16:0) and linoleate (18:2,n-6) metabolism in HepG2 and LnCap cells. The ACC inhibitor, soraphen A, lowers cellular malonyl CoA, attenuates DNL and the formation of fatty acid elongation products derived from exogenous fatty acids, i.e., 16:0 & 18:2,n-6; IC50 ~ 5 nM. Elevated expression of fatty acid elongases (Elovl5, Elovl6) or desaturases (FADS1, FADS2) failed to override the soraphen A effect on SFA, MUFA or PUFA synthesis. Inhibition of fatty acid elongation leads to the accumulation of 16- and 18-carbon unsaturated fatty acids derived from 16:0 and 18:2,n-6, respectively. Pharmacological inhibition of ACC activity will not only attenuate DNL and induce FAO, but will also attenuate the synthesis of very long chain saturated, mono- and polyunsaturated fatty acids.
Keywords: acetyl CoA carboxylase, soraphen A, de novo lipogenesis, fatty acid elongation, fatty acid desaturation, fatty acid oxidation
1. Introduction
Global and tissue specific ablation of acetyl CoA carboxylase-1 [ACC1] [1, 2], ACC2 [3], fatty acid synthase [FASN] [4] or stearoyl CoA desaturase-1 [SCD1] [5, 6] significantly impacts lipid synthesis, storage and oxidation and affects the onset and progression of obesity and diabetes. Such studies have prompted an interest in developing pharmacological approaches to control lipid synthesis and storage in an effort to combat obesity, diabetes, metabolic syndrome and cancer [7–11]. ACC has emerged as one target for such control because of its role in malonyl CoA synthesis, a substrate for de novo lipogenesis (DNL) and an allosteric inhibitor of carnitine palmitoyl transferase-1 (CPT1) and mitochondrial fatty acid oxidation [FAO] [12–15]. While both ACC1 and ACC2 isoforms generate malonyl CoA, their subcellular location leads to different effects on lipid metabolism. Cytosolic ACC1 generates malonyl CoA for DNL, while mitochondrial ACC2 generates malonyl CoA to inhibit CPT1 and FAO [14].
Although there has been considerable interest in ACC as a therapeutic target to attenuate fatty acid synthesis and enhance fatty acid oxidation [7, 13, 16, 17], little attention has been given to the role ACC plays in long chain saturated (SFA), mono-(MUFA) and polyunsaturated (PUFA) fatty acid synthesis. Malonyl CoA is a substrate for microsomal fatty acid elongation [18]. Fatty acid elongation & desaturation is critical for generating the diverse array of SFA, MUFA and PUFA found in cells [19–21]. In addition to malonyl CoA, microsomal fatty acid elongation requires other substrates (NADPH and fatty acyl CoAs) and four enzymes to catalyze the 2-carbon elongation of fatty acids derived from the diet or DNL. These enzymes include 3-keto acyl CoA synthase, 3-keto acyl CoA reductase, 3-hydroxy acyl CoA dehydratase and trans 2,3-enoyl CoA reductase [18–20]. Specificity for fatty acyl CoA substrates and the rate of fatty acid elongation is determined by the 1st step in the pathway, i.e., the activity of the condensing enzyme, 3-keto acyl CoA synthase, and not the reductases or dehydratase [18, 22, 23]. As such, 3-keto acyl CoA synthase (also known as Elovl, elongation of long chain fatty acids) plays the key regulatory role in determining the type and amount of elongated fatty acids found in cells.
Seven fatty acid elongases (Elovl1–7) have been described in rodent and human genomes. Many fatty acid elongases function together with fatty acid desaturases to generate very long chain MUFA and PUFA. Elongases and desaturases in these pathways are coordinately regulated [24, 25]. For example, SCD1 and fatty acid elongase-6 (Elovl6) are induced by insulin, glucose and liver X receptor (LXR) & peroxisome proliferator activated receptor-α (PPARα) agonist. SCD1 and Elovl6 play a major role in MUFA synthesis. The global ablation of SCD1 or Elovl6 significantly impacts fatty acid and triglyceride synthesis as well as the onset of diet-induced fatty liver, obesity & insulin resistance [26–28]. PPARα agonist induce Elovl5, FADS1 and FADS2 leading to the stimulation of PUFA synthesis [24, 29]. Global ablation of Elovl5 lowers PUFA synthesis and relieves PUFA suppression of SREBP1, a key transcription factor controlling fatty acid synthesis [30]. In contrast, elevation of hepatic Elovl5 activity lowers hepatic & plasma triglyceride content [29]. These studies establish that changes in fatty acid elongation impacts cellular fatty acid composition; some of these changes are linked to chronic metabolic disease.
Despite the numerous studies on ACC1 [1, 2] and ACC2 [3] function and the potential role of ACC as a therapeutic target for metabolic and neoplastic disease [7, 13, 16, 17], no studies have assessed the effect of ACC ablation on fatty acid elongation. Our goal is two-fold: 1) to examine the impact of a potent ACC inhibitor on fatty acid elongation, and 2) to determine how changes in fatty acid elongation impact fatty acid desaturation, cellular fatty acid composition and FAO. These studies were carried out in the human hepatoma (HepG2) and prostatic cancer (LnCap) cell lines, two cell lines used by others to evaluate the effect of ACC inhibitors on cellular malonyl CoA content, lipid metabolism and cell growth [8, 13, 16]. The outcome of our studies establishes a key role for ACC in the elongation of SFA, MUFA and PUFA.
2. Materials and methods
2.1. Materials
Acetonitrile (EMD Chemicals, Gibbstown, NJ); acetic acid, chloroform, KH2PO4, HCl, hexane, KOH, H2SO4 (J.T. Baker, Phillipsburg, NJ); acetic acid, ammonium formate, diethyl ether, isopropanol, perchloric acid (Mallinkrodt Chemicals, Phillipsburg, NJ), methanol (Fisher Scientific, Fair Lawn, NJ). Gases for HPLC and GC: hydrogen, nitrogen, helium, air (Industrial Welding, Albany, OR); tissue culture reagents, DMEM, RPMI 6140, fetal calf serum, penicillin & streptomycin, NuPAGE 4–12% polyacrylamide Bis-Tris gels (Invitrogen, Carlsbad, CA); acetyl CoA, bovine serum albumin (BSA), malonyl CoA, isobutyl CoA, propionyl CoA, butylated hydroxytoluene, 2-(2-pyridyl)ethyl-functionalized silica gel, C75, etomoxir; phosphatase inhibitors (β-glycerophosphate, Na-pyrophosphate, Na3VO4(Sigma-Aldrich, Inc, Atlanta, GA); fatty acid and fatty acid methyl ester (GLC-642 & GLC 643) standards (Elysian, MN); TLC lipid standards (Avanti Polar Lipids (Alabaster, AL); [2-14C]-acetate and [1-14C]-palmitate (GE Healthcare, Pittsburg, PA], [1-14C]-linoleate (NEN-Perkin Elmer, Waltham, MA); Quick start Bradford dye reagent (Bio-Rad, Hercules, CA); Inflow 2:1 scintillation cocktail (INUS Systems, Tampa, Fl); Complete mini-EDTA free protease inhibitor cocktail (Roche Diagnostics, Indianapolis, IN); primary antibody for Elovl6 (Abcam, Cambridge, MA); secondary antibodies IRDye 680 and IRDye 800 (LiCor, Lincoln, NB); nitrocellulose membrane Optitran, BA-S 83, Whatman, Dassel, Germany)
2.2. Cell culture and inhibitors of de novo lipogenesis (DNL)
Human hepatoma HepG2 cells were obtained from American Type Culture Collection (Manassas, VA). Prostate carcinoma LnCap cells were obtained from E. Ho, Oregon State University, Corvallis, OR. HepG2 cells were grown in Dulbecco’s modified essential medium (DMEM) with 10% fetal calf serum. LnCap cells were grown in RPMI1640 with 10% fetal calf serum. All experiments were carried out with cells grown on 6 well plates or 100 mm Petri dishes (Corning Life Sciences, Corning, NY) in a humidified incubator at 37°C & 5% CO2.
2.3. RNA extraction and qRT-PCR
RNA was extracted from HepG2 and LnCap cells and specific transcripts were quantified by quantitative real-time PCR (RT-PCR) using primers listed in Table 1S. All human primers were purchased from Eurofins MWG/Operon (Huntsville, AL). All primer pairs were assessed for reaction efficiency & product size; all reactions were performed in triplicate. The relative amounts of mRNAs were calculated by using the comparative CT method (User Bulletin #2, Applied Biosystems, Carlsbad, CA). Cyclophilin was used as a control for these studies.
2.4. Extraction and quantitation of malonyl CoA
The procedure for extraction of short-chain CoAs is essentially as described by Minkler et al [31]. Briefly, confluent HepG2 cells grown on 100 mm Petri dishes as described above were scraped into ice cold 0.9 ml acetonitrile-isopropanol (3:1, v/v), homogenized in a glass Teflon homogenizer on ice. The homogenate was adjusted to 25 mM KH2PO4, pH 6.7 using 0.3 ml 100 mM KH2PO4, pH 6.7 and re-homogenized on ice. Protein in the extract was measured using the BioRad Quick Start Bradford Dye Reagent and bovine serum (BSA) as standard. Isobutyl CoA was added as a recovery standard. After centrifugation at maximum speed in a microfuge tube, the supernatant was transferred to another tube and 0.25 ml of glacial acetic acid was added per ml of supernatant. The supernatant was applied to a column containing 100 mg of 2-(2-pyridyl) ethyl-functionalized silica gel. The column was precondition with 1 ml acetonitrile:isopropanol:water:acetic acid (9:3:4:4; v/v/v/v). The sample was applied and washed with 1 ml acetonitrile:isopropanol:water:acetic acid. The acyl CoAs were eluted with 2 ml methanol: 250 mM ammonium formate (4:1, v/v). The eluate was collected, dried in a speed-vac and resuspended in 200µl 40 mM KH2PO4, pH 6.7.
The acyl CoAs were fractionated by RP-HPLC using a Water Alliance HPLC system and quantified by UV absorbance. The column was a J’Sphere ODS-M80 (4µm, 8 nm; 250 × 4.6 mm)(YMC, Waters, Milford MA). The elution buffers were [A]: 40 mM KH2PO4, pH 4.4 and [B]: 30% methanol in 40 mM KH2PO4, pH 4.4. From 0 to 5 minutes post injection, the eluant was 95% A and 5% B; from 5–30 mins, a linear gradient was applied to reach 100% B by 30 mins. The column was at 37°C and the flow rate was at 0.7 ml/min. The acyl-CoAs were quantified by UV absorbance at 260 nm using a 2487 dual λ absorbance detector (Waters, Milford, MA) and related to a standard curve of malonyl CoA.
2.5. Metabolic labeling
Cells in 6 well plates were treated with [2-14C]-acetate [0.5 µCi/well-6 well plate; 4.3 µM; 58 mCi/mmole, GE Healthcare, Pittsburg, PA ], 50 µM [1-14C]-palmitate [0.5 µCi/well, Amersham, GE Healthcare, Pittsburg, PA], or 50 µM [1-14C]-linoleate [0.5 µCi/well, NEN-Perkin Elmer, Waltham, MA] for 6 hrs in the absence or presence of inhibitors of de novo lipogenesis: soraphen A, an ACC inhibitor (a generous gift from Cropsolution, Inc., Morrisville, NC). C75, a FASN inhibitor [32], was purchased from Sigma-Aldrich, Inc., Atlanta, GA. Cells were pretreated with inhibitors for 2 hour prior to adding 14C-label reagents. Non-radioactive fatty acids were obtained from Nu-Chek Prep (Elysian, MN). Cell protein was measured using the BioRad Quick Start Bradford Dye Reagent and bovine serum (BSA) as standard.
2.6. Recombinant adenovirus
Recombinant adenoviruses used in these studies included those expressing luciferase (Ad-Luc), fatty elongase-5 (Ad-Elovl5), fatty acid elongase-6 (Ad-Elovl6) (2), Δ5-fatty acid desaturase (Ad-FADS1) and Δ6-fatty acid desaturase (Ad-FADS2). The recombinant adenovirus expressing luciferase, Elovl5 and Elovl6 were described previously [24, 25]. The recombinant adenovirus expressing FADS1 was constructed using mouse primers [NM_146094: sense: 5’- ATGGCTCCCGAC CCGGTGCCG; antisense: CTATTGGTGAAGGTAAGCGTC]. A recombinant adenovirus expressing FADS2 was constructed using the mouse primers [NM_019699] (sense primer, ATGGGGAAGGGAGGTAACCAG-3’ and anti-sense primer, TCATTTATGGAGGTAAGCATC-3’). All mouse primers were purchased from Eurofins MWG/Operon (Huntsville, AL). RT-PCR and mouse liver RNA was used to generate the coding regions for the FADS1 and FADS2 enzymes. The cDNAs were inserted into the pShuttle-CMV (Stratagene-Agilent Technologies, Santa Clara, CA), recombined in BJ5188 cells, propagated in XL10 Gold ultra competent cells. Ad-DNA was packaged into adenoviral particles in Ad-293 cells. The resulting adenovirus was amplified in Ad-293 cells. Recombinant adenoviruses were either prepared from cell lysates or twice purified by cesium chloride density ultracentrifugation. Post-centrifugation, viral particles were dialyzed against PBS + 10% sucrose and stored at −80°C. Virus prepared from cell lysates or further purified by cesium chloride ultracentrifugation were titered using the Adeno-X Rapid titer kit from Clontech, (Mountain View, CA); active viral particle concentration (plaque forming units (PFU)/ml).
HepG2 cells were infected with recombinant adenovirus after reaching 80% confluence. Most studies used a virus to cell ratio of 20, i.e., 20 plaque forming units [PFU]/cell. Cells were infected with virus 48 hrs prior to treatment with drugs or 14C-labeled compounds. LnCap cells are resistant to adenoviral infection and expression of green fluorescent protein (Ad-GFP); less than 10% of cells expressed GFP after receiving Ad-GFP at 100 PFU/cell. Accordingly, LnCap cells were not used for elongase or desaturase over expression studies.
2.7. Lipid extraction & reverse phase high performance chromatography
After treating cells with 14C-labeled compounds, cells were washed with PBS + 0.2% BSA. Total lipid was extracted from cells using chloroform:methanol (2:1) plus 1 mM butylated hydroxytoluene [29]. Total lipid was fractionated by thin layer chromatography (TLC): stationary phase: Whatman LK6D glass plates (GE Healthcare, Pittsburg, PA); mobile phase, hexane:diethyl ether:acetic acid (60:40:0.8). After drying, radioactivity on the TLC plates was quantified by phosphorimager, Storm 820 (Amersham Biotech-Molecular Dynamics, Sunnyvale, CA) analysis.
Total lipids were saponified using 0.4 N KOH in 80% methanol and heating to 65°C for 2 hrs. After neutralization with 0.45 N HCl, fatty acids were extracted with hexane + 2% acetic acid. After drying under nitrogen and in vacuo overnight, fatty acids were resuspended in methanol + 0.1% butylated hydroxytoluene (Sigma-Aldrich, Inc., Atlanta, GA) and used directly for reverse-phase chromatography (RP-HPLC). The RP-HPLC conditions were: YMC J-Sphere (ODS-H80) column and a gradient starting at 77.5% acetonitrile + acetic acid (0.1%) and ending at 100 % acetonitrile + acetic acid (0.1%) over 70 mins with a flow rate of 1.0 ml/min using a Waters 600 controller (Waters Corporation, Milford, MA). Fatty acids were detected using UV absorbance at 192 nm (Waters model 2487) and evaporative light scatter (Waters model 2420), and/or β-scintillation counting (Inflow 2:1; INUS Systems, Tampa, FL [24, 25]. Fatty acid & complex lipid standards for TLC and RP-HPLC were obtained from Nu-Chek Prep (Elysian, MN) and Avanti Polar Lipids (Alabaster, AL).
2.8. Gas chromatographic analysis of fatty acids
Gas chromatography was used to identify a new fatty acids, i.e., 11,14-eicosadienoic acid (20:2,n-6). Accordingly, fatty acid methyl esters (FAME) were prepared from saponified fatty acids extracted as described above. FAME were prepared using 1% H2SO4 in methanol and heating to 90°C for 1 hr. FAME were extracted in hexane, dried and resuspended in hexane + 0.05% butylated hydroxytoluene for quantitation by gas chromatography (Aligent 7890 GC, Agilent Technologies, Brush Prairie, WA) equipped with a flame ionization detector (FID) [conditions: column, 100 × 0.25 mm ID, 0.2 µm HP-88; inlet temperature = 250°C; vol. injected 1 µl; split ratio varies from 1:5; carrier gas A = hydrogen; B = helium; head pressure 2 ml/min constant flow; oven To: 120°C 1 min. 10°C/min to 175°C, 10 min 5°C/min to 210°C, 5 min 5°C/min to 230°C, 5 min; detector temperature, 280°C; detector gases: 40 ml/min hydrogen; 450 ml/min air, Helium to make up gas 30 ml/min]. Standards for fatty acid methyl esters (GLC-682, GLC-642, & GLC-643) were obtained from Nu-Chek Prep (Elysian, MN).
2.9. Fatty acid oxidation
Fatty acid oxidation was measured in cells after treatment with 14C-labeled fatty acids. Media was collected, centrifuged at 3000X g and used to quantify fatty acid oxidation products as described [33]. Briefly, 0.5 ml of media was transferred to wells in 24-well costar plates. The media was acidified with perchloric acid (10% v/v). The wells were overlaid with Whatman 3MM paper soaked with 2 M NaOH. The lid was returned to the 24-well plate, firmly sealed and shaken at 37°C for 6 hrs. Afterward, the 3MM paper was recovered, dried and cut according to the pattern of wells. Each well/3MM paper was transferred to a microfuge tube containing water (1.0 ml) and shaken for 2 hrs at room temperature. 14C-radioactivity in the water represents 14CO2 production and was quantified by β-scintillation. The media remaining in the wells of the 24 well plate was recovered, centrifuged at 3000 X g for 10 mins. 14C-radioactivity in the supernatant, i.e., 14C-acid soluble material (ASM, represents incomplete fatty acid oxidation, e.g., ketone bodies, acyl carnitine and TCA metabolites) was quantified by β-scintillation counting. The generation of all FAO products was blocked by etomoxir (an inhibitor of fatty acid oxidation) treatment (10 µM, 6 hrs) (Sigma, St. Louis, MO).
2.10. Immunoblot analysis for Elovl5 & Elovl6
Extracts of HepG2 cells were prepared as described previously [29] and included both protease (Complete mini-EDTA free protease inhibitor cocktail, Roche Diagnostics, Indianapolis, IN) and phosphatase inhibitors (1 mM β-glycerolphosphate, 2.5 mM Na-pyrophosphate, 1 mM Na3VO4) (Sigma Chemicals, St. Louis, MO). Proteins (25–100 µg) were separated electrophoretically by SDS-polyacrylamide gel electrophoresis (NuPAGE 4–12% polyacrylamide Bis-Tris, Invitrogen, Carlsbad, CA) and transferred to nitrocellulose (BA83) membranes. Antibodies used in these studies included: Elovl5 [29] & Elovl6 (# Ab69857, AbCam, Cambridge, MA). The IRDye 680 and IRDye 800 secondary antibodies were obtained from LiCor, Inc. (Lincoln, NB). Antigen-antibody reactions were detected and quantified using LiCor Odyssey scanner and software.
2.11. Fatty acid elongation assay
Mouse liver microsomes were prepared and used for a fatty acid elongation assay as described [24, 25]. The fatty acyl-CoA substrate used for this assay was 18:3, n-6-CoA, a substrate for fatty acid elongase-5 (Elovl5).
2.12. Statistical analysis
The statistical analysis performed in this work included ANOVA (one- & two-way) plus post hoc Tukey honestly significant difference test (http://faculty.vassar.edu/lowry/VassarStats.html). A p-value ≤ 0.05 was considered statistically different.
3. Results
3.1. Expression levels of enzymes involved in DNL, MUFA and PUFA synthesis in HepG2 and LnCap cells
The relative abundance of transcripts encoding enzymes involved in DNL (ACC1, ACC2, FASN), fatty acid elongation (Elovl1–7) and fatty acid desaturation (FADS1, FADS2 & SCD1) was examined in HepG2 and LnCAP cells (Figure 1S, supplementary data). ACC1 is the predominant ACC isoform in both cell types. The distribution of fatty acid elongases in HepG2 cells is similar to that seen in rat, mouse and human liver; Elovl5 mRNA is the most prominent elongase expressed in both cells as well as human and rodent liver [24, 25]. Both FADS1 and SCD1 are well expressed in both cell types. FADS2, however, is poorly expressed in HepG2 cells when compared to LnCap cells. This pattern of desaturase expression is similar to that found in primary rat hepatocytes (not shown), FADS2, however, is well expressed in rat, mouse and human liver [29].
3.2. Effect of soraphen A on DNL in HepG2 & LnCap cells
Biochemical and genetic studies have established that soraphen A is a potent inhibitor of eukaryote ACC [34–36]. Soraphen A binds the biotin carboxylase (BC) domain of ACC1 and ACC2 and interferes with oligomerization of the BC domain. Oligomerization is required for ACC activity [37, 38].
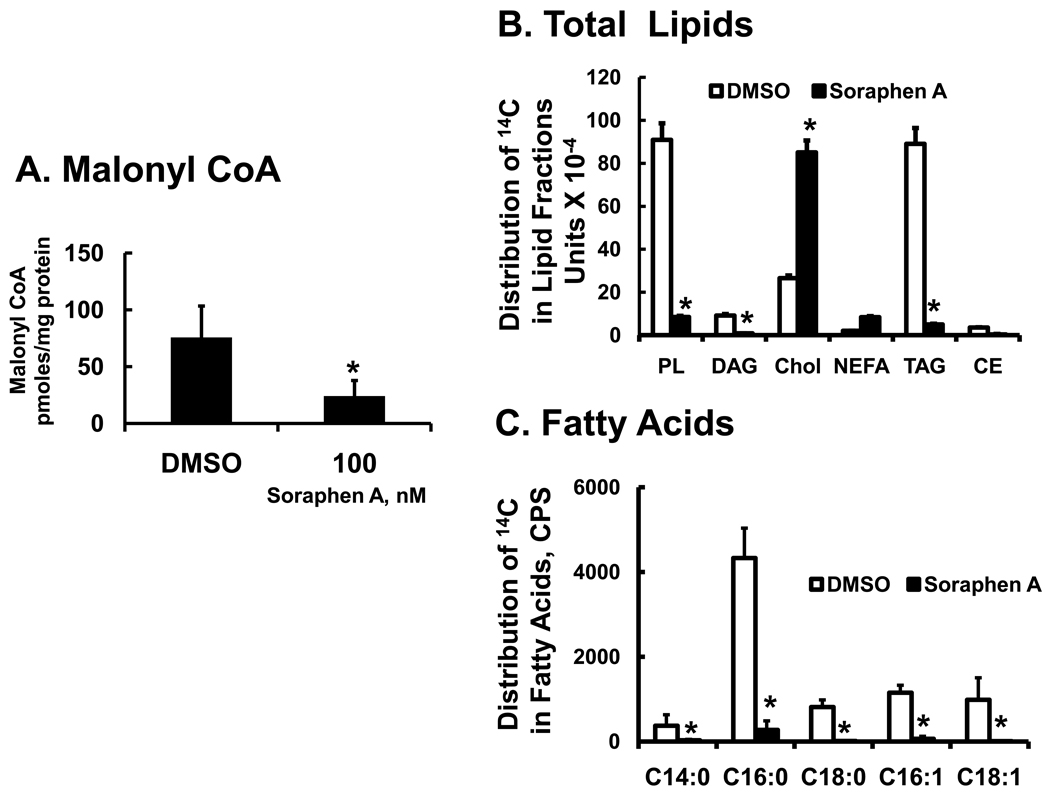
To examine the effect of soraphen A on malonyl CoA and DNL in HepG2 cells, cells were treated with DMSO (vehicle) or soraphen A at 100 nM for 6 hrs. Cellular malonyl CoA was extracted and quantified (Methods). Soraphen A treatment of HepG2 cells suppressed malonyl CoA levels by >60% (Fig. 1A). To measure DNL, HepG2 received [2-14C]-acetate 2 hrs after beginning soraphen A treatment (Figure 1 B & C). [2-14C]-Acetate is converted to 14C-acetyl CoA and serves as a substrate for ACC for DNL and HMG-CoA synthase-1 for cholesterol synthesis. Total lipids extracted from cells were fractionated by thin layer chromatography and quantified for 14C-radioactivity in lipid fractions. Soraphen A inhibited 14C-acetate assimilation into nearly all lipids containing fatty acids, including phospholipids, diacylglycerol, triacylglycerol and cholesterol esters by ≥ 80%. In contrast, soraphen A stimulated assimilation of 14C-acetate into cholesterol, ≥2-fold.
Figure 1. Effect of soraphen A on cellular malonyl CoA and [2-14C]-acetate metabolism in HepG2.
A: Measurement of malonyl CoA in HepG2 cells. HepG2 cells were grown to ~90% confluence in 100 mm Petri dishes in DMEM + 10% FBS. Cells were treated with DMSO (0.5%, vehicle for soraphen A] or soraphen A (100 nM) for 6 hrs, harvested and extracted for malonyl CoA (Methods). Results are expressed as Malonyl CoA, pmoles/mg protein; the results are the mean + standard deviation (S.D.); n = 5; *; p<0.01, t-test.
B & C: Effect of soraphen A on de novo lipogenesis in HepG2 cells. HepG2 cells grown in 6 well plates were treated with DMSO (white bars) or soraphen A (100 nM, black bars) for 2 hrs. prior to adding [2-14C]-acetate (0.5 µCi/well-6 well plate; 4.3 µM; 58 mCi/mmole). Cells were maintained in media containing DMSO or soraphen A for an additional 6 hrs and then extracted for total lipids (panel B) or fatty acids (panel C) (Methods). Total lipid was fractionated by thin layer chromatography & the distribution of 14C in lipid fractions was quantified by phosphor image analysis. Lipid standards (cholesterol ester [CE, 18:1,n-9], triacylglycerol [TAG, triolean], NEFA [18:1,n-9], cholesterol (Chol), diacylglycerol [DAG, diolean] and polar lipid [PL, phosphatidyl choline] were obtained from Nu-Chek Prep & Avanti Polar Lipids. Results are expressed as phosphor-image units × 10−4 mean ± SD, n=3; *, p≤0.05 DMSO (white bars) versus soraphen A (black bars). Total lipids were saponified and the resulting non-esterified fatty acids were fractionated and quantified by RP-HPLC and β-scintillation counting. Results are expressed as Distribution of 14C-in fatty acids, CPS (counts/second) mean ± SD, n=3; *, p≤0.05 DMSO (white bars) versus soraphen A (black bars).
The distribution of 14C into fatty acids was assessed after total lipids were saponified and fractionated by RP-HPLC (Fig. 1C). The fatty acid products of [2-14C]-acetate labeling were 16:0 > 16:1,n-7 > 18:0 = 18:1,n-7 = 18:1, n-9 > 14:0. At 100 nM, soraphen A inhibited the formation of all products. Palmitate and 16:1,n-7 were the only products detected, but at very low levels. This pattern was seen in both HepG2 cells (Fig. 1) and LnCap cells (not shown) and is similar to results reported by others using ACC inhibitors [8, 13].
Other inhibitors of fatty acid synthesis were examined, including the FASN inhibitors C75 [32] and orlistat [39]. Based on studies by others [40], C75 was predicted to augment fatty acid elongation because of its effects on cellular malonyl CoA content. While C75 (at 50 – 200 µM) inhibited DNL (IC50 ≥ 200 µM), C75 had little effect on fatty acid elongation or desaturation (Fig. 2S & 3S, supplementary data) or FAO (not shown) in HepG2 cells. When compared to soraphen A, C75 is a weak inhibitor of DNL in HepG2 cells. Orlistat (at 200 M) had no effect on DNL in HepG2 cells (not shown).
3.3. Effect of soraphen A on palmitate (16:0) metabolism in HepG2 and LnCap cells
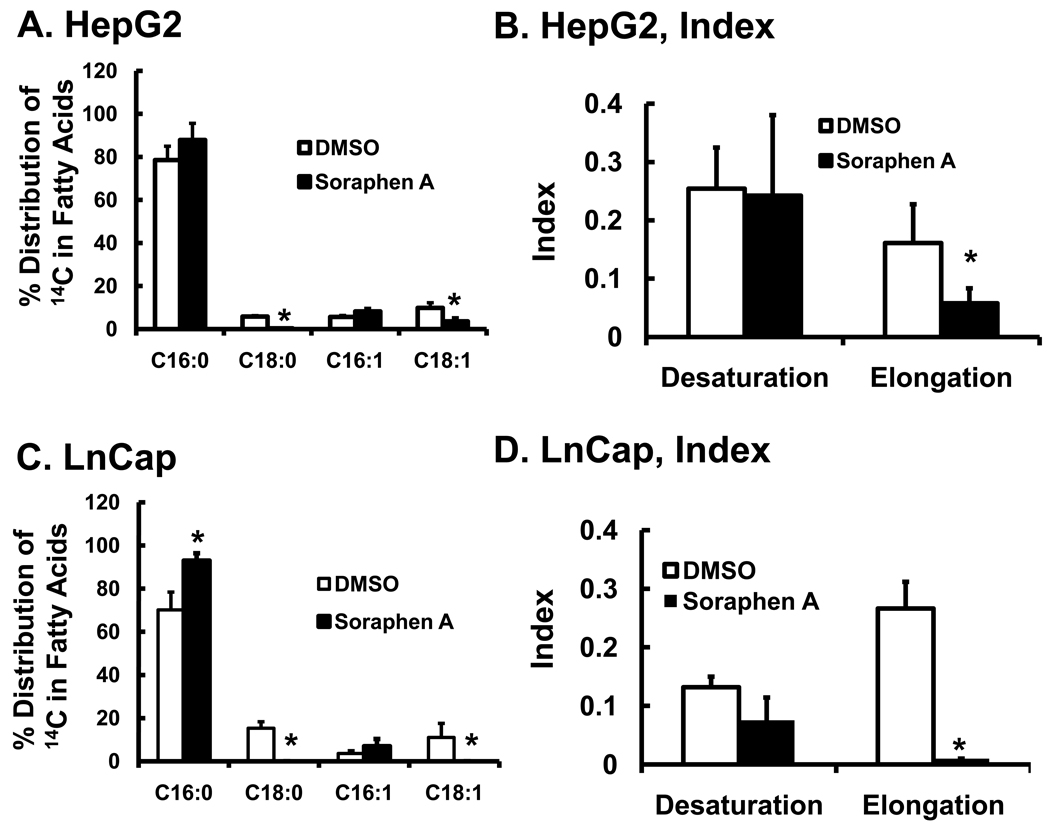
The robust inhibition of DNL by soraphen A precludes an accurate assessment of soraphen A effects on fatty acid elongation or desaturation. Accordingly, HepG2 and LnCap cells were treated with 50 µM [1-14C]-16:0 in the absence and presence of soraphen A for 6 hrs (Fig. 2). 16:0 was rapidly assimilated into complex lipids including polar lipids, cholesterol esters, DAG, and TAG; soraphen A had no effect on the uptake of 14C-16:0 or the distribution of 14C into complex lipids (not shown). Saponification and RP-HPLC analysis revealed that [1-14C]-16:0 was converted to both elongated and desaturated fatty acids including 16:1,n-7, 18:0, 18:1,n-7 and 18:1,n-9 in both HepG2 (Fig. 2A) and LnCap (Fig. 2C) cells. The formation of these elongated and desaturated products is consistent with the gene expression profiles for Elovl6 and SCD1 in both cells (Fig. 1S, supplementary data). Soraphen A (100 nM) inhibited the formation of all elongated fatty acids, i.e., 18:0, 18:1,n-7 & 18:1,n-9, by ≥75%. Soraphen A, however, did not inhibit desaturation of 16:0 to 16:1,n-7, a SCD1 catalyzed reaction. While the desaturation index (Fig. 2B & D) was not significantly affected by soraphen A treatment, the elongation index was suppressed by 60% in HepG2 cells and > 90% in LnCap cells. Soraphen A impaired the capacity of 16:0-treated HepG2 and LnCap cells to form saturated or unsaturated fatty acids longer than 16-carbons.
Figure 2. Effect of soraphen A on palmitate metabolism.
HepG2 and LnCap were grown to 80% confluence as described in the Methods and treated with DMSO or soraphen A (100 nM) for 2 hrs prior to addition of 14C-16:0 (50 µM). Cells were maintained in the presence of vehicle (DMSO) or soraphen A (100 nM) for an additional 6 hrs. After treatment, cells were extracted for total lipid, saponified and fractionated by RP-HPLC as described in Methods. Panels A & C illustrate the distribution of 14C in 16:0 and its elongation and desaturation products in HepG2 cells [A] and LnCap cells [C]. Results are reported as % Distribution of 14C in Fatty Acids, mean ± SD, n=4; *, p≤0.05 DMSO (white bars) versus soraphen A (black bars). Panels B and D represent the desaturation and elongation index calculated from the data in Panels A and C, respectively. The desaturation index was calculated by summing the 14C-CPS in [16:1,n-7 + 18:1,n-7 + 18:1,n-9] and dividing by the sum of 14C-CPS in [16:0 + 18:0]. The elongation index was calculated by summing the 14C-CPS in [18:0 + 18:1,n-7 + 18:1,n-9] and dividing by the sum of 14C-CPS in [16:0 + 16:1,n-7].
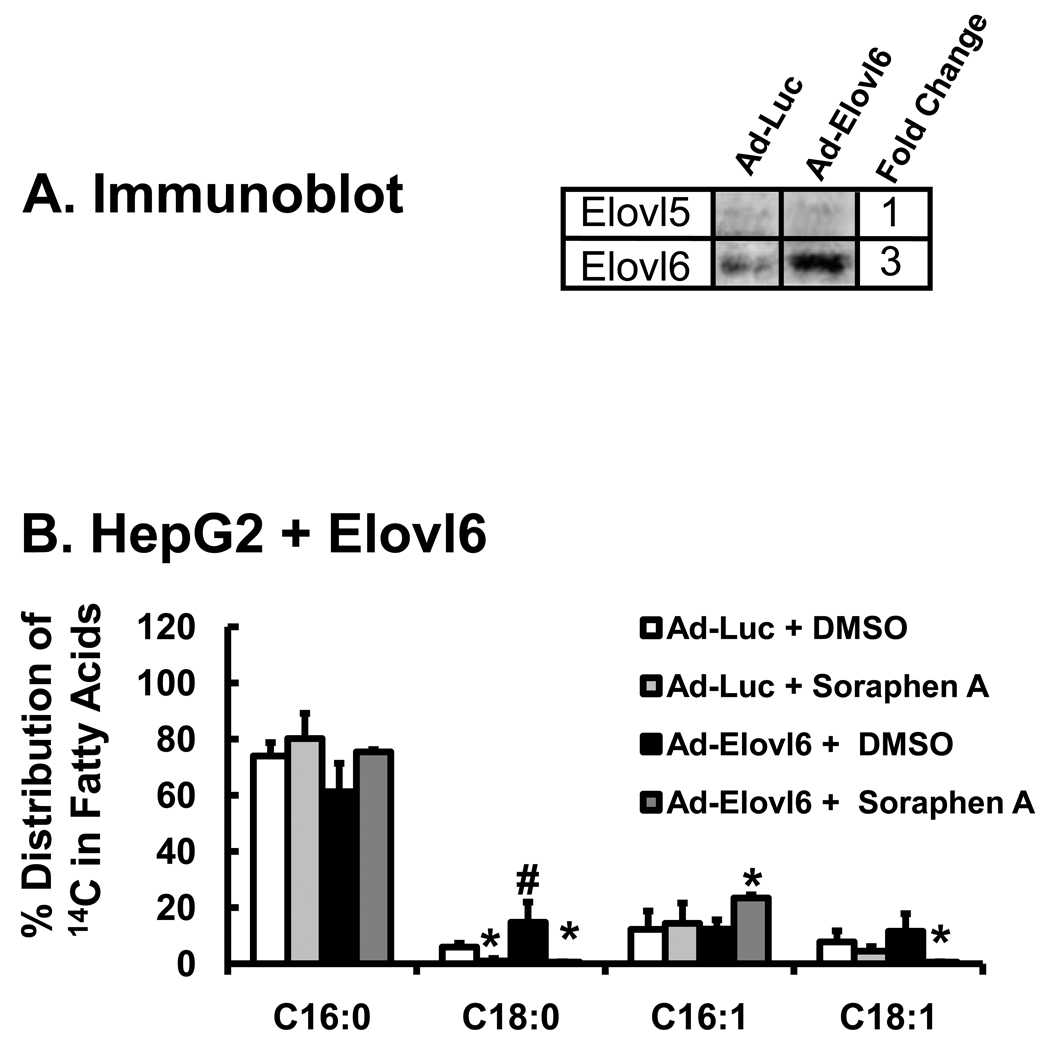
In an effort to override this effect, fatty acid elongation was induced by infecting cells with Ad-Elovl6, an adenovirus expressing fatty acid elongase-6 (Elovl6). Elovl6 is involved in the elongation of SFA and MUFA [24, 25, 41]. Infection of HepG2 cells with Ad-Elovl6 elevated Elovl6 protein abundance ~3-fold (Fig. 3A). This level of Elovl6 expression is comparable to the fold change induced in mouse liver following PPARα agonist treatment [24, 25]. Cells with elevated Elovl6 abundance had a 3-fold increase in the formation of 14C-18:0 from 14C-16:0, but had little effect on the levels of 16:1,n-7 or the formation of C18:1 (cis-vaccenate [18:1,n-7] or oleate [18:1,n-9]) (Fig. 3B). Treatment of cells with soraphen A (0.1 µM) abrogated formation of all 18-carbon fatty acids (C18:0 & C18:1). Under basal (Ad-Luc) or stimulated (Ad-Elovl6) conditions, soraphen A inhibited the formation of all 18-carbon fatty acids derived from 16-carbon fatty acids, but did not impair desaturation of 16:0 to form 16:1,n-7.
Figure 3. Effect of elevated Elovl6 expression on [1-14C]-16:0 metabolism in HepG2 cells.
HepG2 cells were infected with Ad-Luc (control virus) or Ad-Elovl6 at 20 PFU/cells 48 hrs prior to treatment with [1-14C]-16:0 (Methods). The immunoblot (Panel A) represents the level of Elovl6 protein abundance in HepG2 following infection with Ad-Luc or Ad-Elovl6. Ad-Luc has no effect on Elovl6 protein abundance; Ad-Elovl6 infection increases Elovl6 ~3-fold, a value consistent with physiological changes seen in vivo [24, 25]. Panel B: Soraphen effects on palmitate metabolism in HepG2 cells with elevated Elovl6 expression. Forty-eight hours after adenoviral infection, cells were treated with [1-14C]-16:0 (50 µM) and DMSO or Soraphen A as described above. Six hours after treatment cells were harvested for extraction and saponification for RP-HPLC fractionation. Treatments: Ad-Luc + DMSO (white bars); Ad-Luc + soraphen A (light gray bars); Ad-Elovl6 + DMSO (black bars); Ad-Elovl6 + soraphen A (dark gray bars). Results in panels A, B and D are expressed as % Distribution of 14C Fatty Acids; mean ± SD, n=3; *, p≤0.05 DMSO versus soraphen A; #, p≤ 0.05 Ad-Luc versus Ad-Elovl6, Anova, one-way.
3.4. Effects of soraphen A on linoleate (18:2,n-6) metabolism in HepG2 and LnCap cells
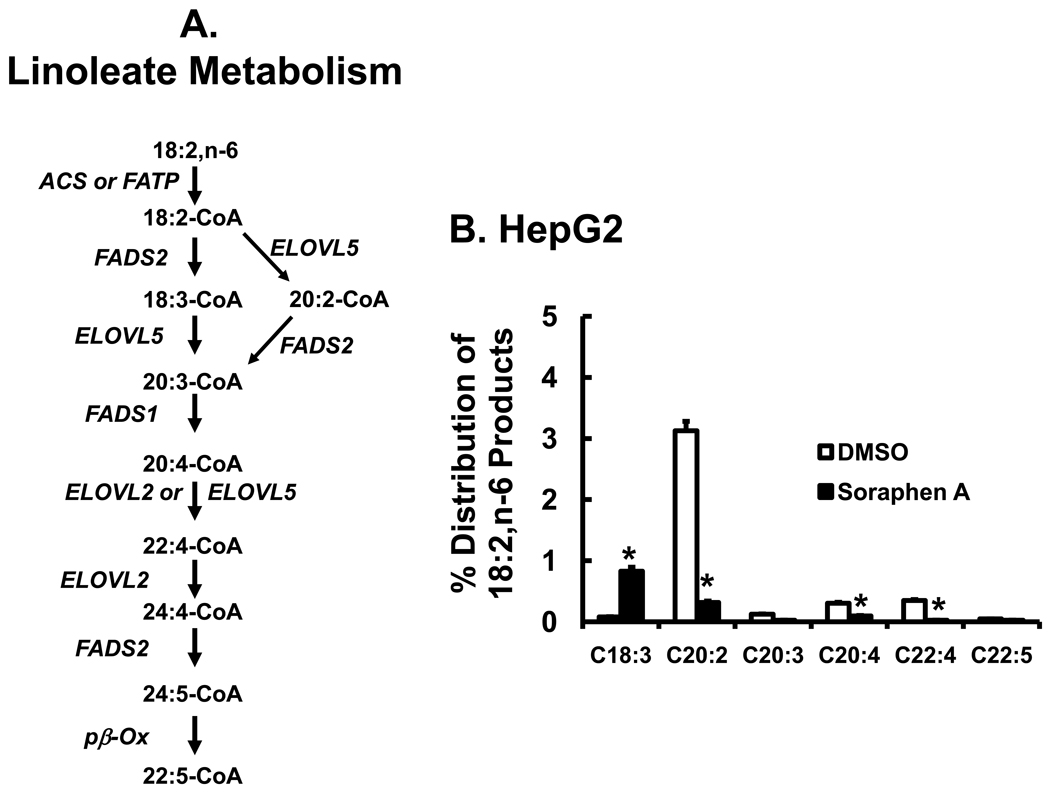
To determine if soraphen A affects essential fatty acid metabolism, HepG2 cells were treated with 14C-18:2,n-6 (50 µM) (Fig. 4). Linoleic acid is the predominant essential fatty acid found in the human and rodent diet. Linoleic acid (18:2,n-6) metabolism is very complex and many elongation and desaturation products are formed (Fig. 4A). HepG2 cells take up >90% of [1-14C]-18:2,n-6 from the medium within 6 hrs. Of the intracellular 14C-fatty acids recovered, less than 5% was elongated or desaturated (Fig. 4B). The predominant product of [1-14C]-18:2,n-6 metabolism in HepG2 cells was 14C-20:2,n-6, i.e., 11, 14-eicosadienoic acid. The identity of 20:2,n-6 was verified by using both RP-HPLC and GC methods along with authentic standards (Methods & Materials). This fatty acid was recently described in studies using the FADS2 knockout mouse [42]. Poor conversion of 18:2,n-6 to 20:4,n-6 can be explained, at least in part, by the low level of FADS2 expression in HepG2 cells (Fig. 1S). Despite the low level of elongation and desaturation in these cells, soraphen A inhibited the formation of all 20- & 22-carbon PUFA by ≥90%. Soraphen A, however, stimulated the formation of 18:3,n-6 by >10-fold (Fig. 4B).
Figure 4. Effect of Soraphen A on linoleate metabolism.
A. Pathway for linoleate metabolism [42, 62]. B. HepG2 cells were treated with soraphen A (100 nM) for 2 hrs before adding 14C-18:2,n-6 (50 µM). Six hours later cells were harvested for total lipid extraction, saponification, and RP-HPLC analysis. Results are reported at % Distribution of 14C in 18:2,n-6 products; mean ± SD, n=3, t-test.
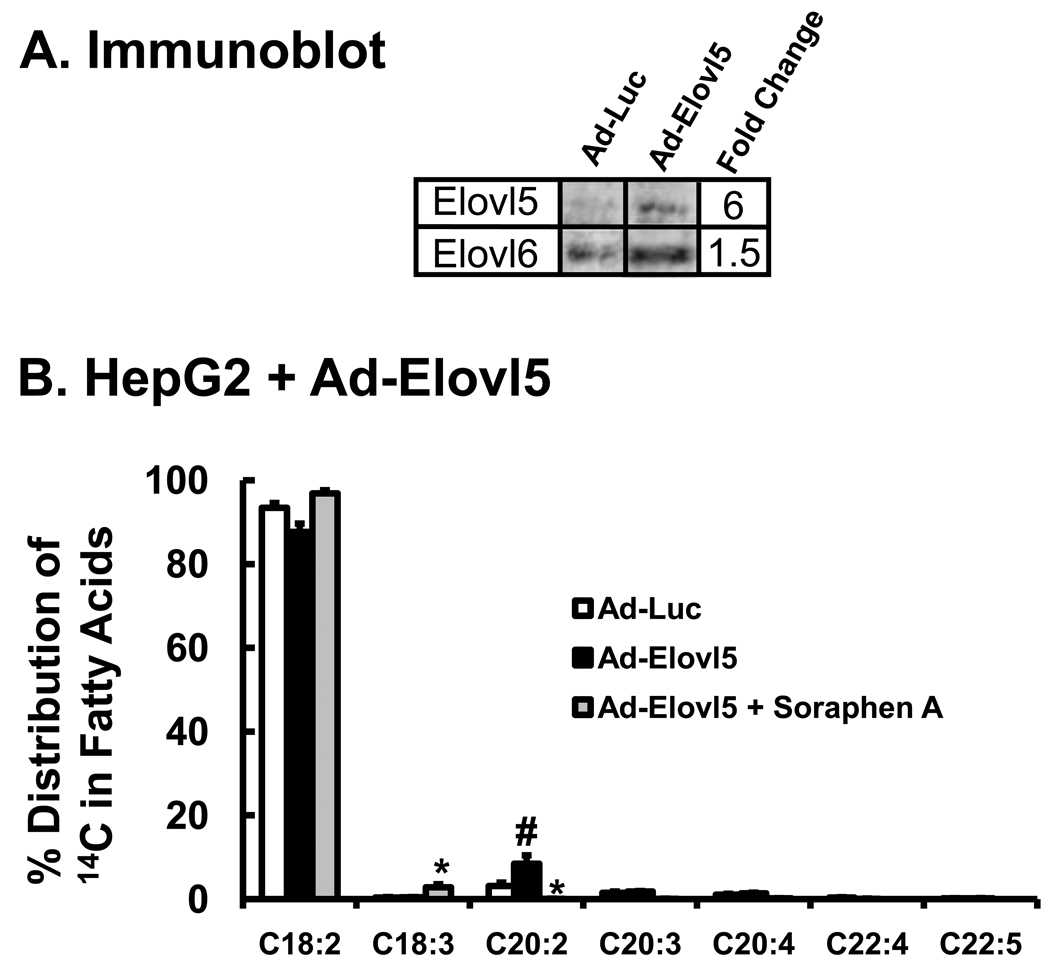
Elongation of 18:2,n-6 in HepG2 cells was induced by infecting cells with an Elovl5-expressing adenovirus (Ad-Elovl5). Elovl5 converts 18:3-CoA to 20:3-CoA as well as 20:4-CoA to 22:4-CoA (Fig. 5A). Ad-Elovl5 infection increased Elovl5 protein abundance by 6-fold (Fig. 5A). Elevated Elovl5 activity also significantly increased 20:2,n-6 formation by 3-fold (Fig. 5B). Soraphen A suppressed the formation of all 20- and 22-carbon PUFA, but stimulated the formation of 18:3,n-6 by 2-fold.
Figure 5. Effect of elevated Elovl5 expression on soraphen A regulation of 18:2,n-6 metabolism in HepG2 cells.
A: Immunoblot analysis for Elovl5. HepG2 cells were infected with Ad-Luc (control virus) or Ad-Elovl5 at 20 PFU/cells 48 hrs prior to treatment with [1-14C]-18:2, n-6 (Methods). The immunoblot represents the level of Elovl5 protein abundance in HepG2 following infection with Ad-Luc or Ad-Elovl5 prior to fatty acid treatment. Ad-Luc has no effect on Elovl5 protein abundance; Ad-Elovl5 infection increases Elovl5 protein 5-fold, a value consistent with physiological changes seen in vivo [24, 25]. B: Forty-eight hours after Ad-Luc or Ad-Elovl5 adenoviral infection, cells were treated with DMSO, soraphen A and [1-14C]-18:2,n-6 (50 µM) as described above. Six hours after treatment cells were harvested for extraction and saponification. 14C-fatty acids were fractionated as described (Methods). Treatments: Ad-Luc + DMSO (white bars); Ad-Elovl5 + DMSO (black bars); Ad-Elovl5 + soraphen A (gray bars). Results are expressed as % Distribution of 14C Fatty Acids; mean ± SD, n=3; *, p≤0.05 DMSO versus soraphen A; #, p≤0.05 Ad-Luc versus Ad-Elovl5; t-test.
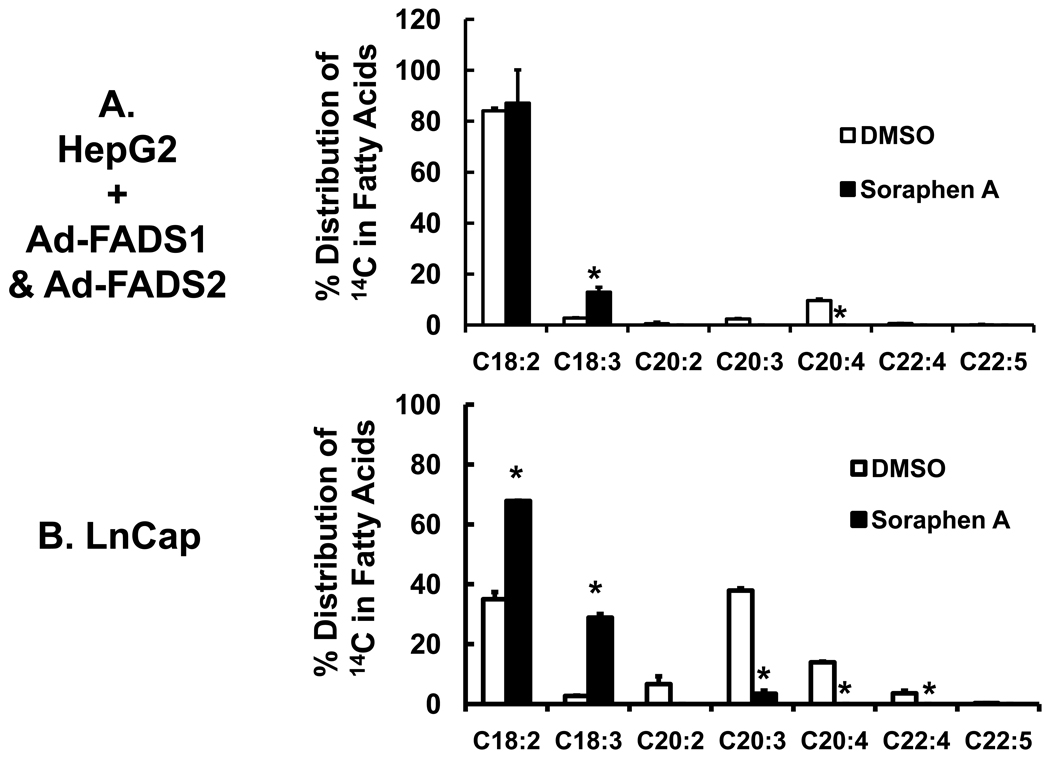
In an effort to stimulate 18:2,n-6 desaturation, HepG2 cells were infected with adenovirus expressing FADS1 (Ad-FADS1) and FADS2 (Ad-FADS2) (Fig. 6A). These two desaturases play a major role in PUFA synthesis (Fig. 4A). The impact of Ad-FADS1 and Ad-FADS2 on 18:2,n-6 metabolism in HepG2 cells is shown in the (Fig. 4S, supplementary data). The combination of Ad-FADS1 and Ad-FADS2 expression in HepG2 cells was required to increased 20:4,n-6 formation by >20-fold. The level of 20:4,n-6 formed represents only 10% of the total 14C-fatty acids in HepG2 cells. Soraphen A essentially abrogated formation of all 20–22 carbon PUFA and stimulated the formation of 18:3,n-6 by >10-fold.
Figure 6. Effect of soraphen A on 18:2,n-6 metabolism in cells with elevated PUFA metabolism.
Panel A: Infection of HepG2 with recombinant adenovirus expressing FADS1 (Ad-FADS1) and FADS2 (Ad-FADS2). HepG2 cells were infected with Ad-FADS1 and Ad-FADS2 at 20 PFU/cell each. The effect of Ad-FADS1, Ad-FADS2 and the combination of Ad-FADS1 & Ad-FADS2 on 18:2,n-6 metabolism in HepG2 cells is illustrated in Fig. 4S, Supplementary data. Forty-eight hours after adenoviral infection, HepG2 cells were treated with DMSO (white bars), soraphen A (black bars) and [1-14C]-18:2,n-6 (50 µM) as described in Fig. 5. Six hours later, cells were harvested for lipid extraction, saponification and fractionation. Results are expressed as % Distribution of 14C Fatty Acids; mean ± SD, n=3; *, p≤0.05 DMSO versus soraphen A. Panel B: Effect of soraphen A on 18:2,n-6 metabolism in LnCap cells. LnCap cells were treated with DMSO (white bars) or soraphen A (black bars) for 2 hrs prior to the addition of 14C-18:2,n-6 (50 µM). Six hours afterward, cells were harvested for extraction, saponification and RP-HPLC fractionation. Results are expressed as % Distribution of 14C Fatty Acids; mean ± SD, n=3, *, p≤0.05 DMSO versus soraphen A, t-test.
In contrast to HepG2 cells, LnCap cells have robust expression of FADS2 (Fig. 1S). As expected, >60% of intracellular 14C-labeled fatty acids are 20:3,n-6, 20:4,n-6 and 22:4,n-6. Soraphen A inhibited the formation of all 20 & 22-carbon products and stimulated the formation of 18:3,n-6 by >10-fold. The fraction of 14C-fatty acids recovered as 18:2,n-6 increased because of inhibited elongation. The outcome of these studies establishes that soraphen A significantly alters essential fatty acid metabolism and the accumulation of 18:2,n-6 metabolites in HepG2 and LnCap cells.
3.5. Effect of fatty acid elongases and desaturases on fatty acid oxidation
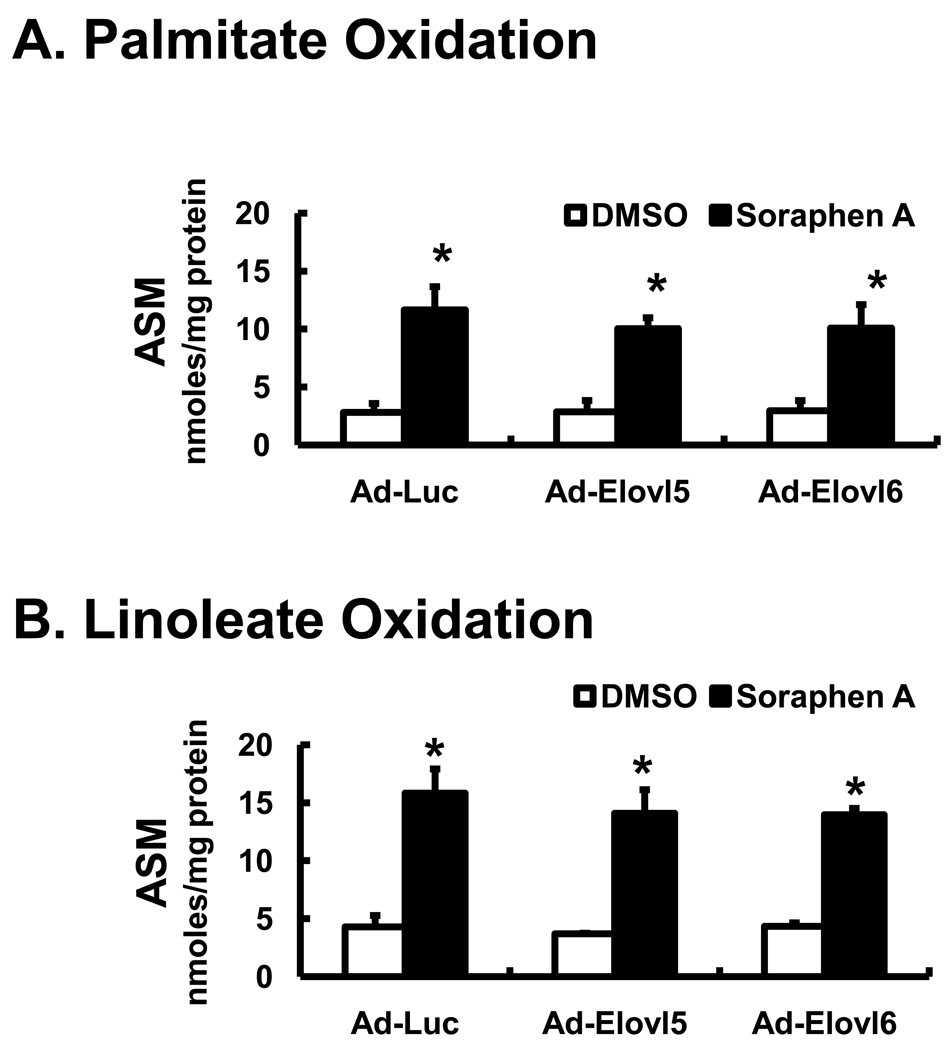
Infection of HepG2 cells with recombinant adenovirus expressing elongases (Elovl5 and Elovl6) and desaturases (FADS1 and FADS2) stimulates16:0 and 18:2,n-6 metabolism by increasing the formation of elongated and desaturated fatty acids (Fig. 3, 5, 6 & Fig. 4S, supplementary data). Elevated expression of Elovl5 and Elovl6 in HepG2 cells did not impair DNL (Fig. 5S, supplementary data). To determine if elevated fatty acid elongase & desaturase activity stimulated fatty acid oxidation, media from the experiments reported in Figs. 3 & 5 was assayed for fatty acid oxidation products, as acid soluble material [ASM] (Fig. 7). ASM consists of 14C-labeled ketone bodies, acyl carnitines and citric acid cycle metabolites derived from the 14C-labeled fatty acids.
Figure 7. Effect of Soraphen A and elevated elongase expression of fatty acid oxidation in HepG2 cells.
HepG2 cells were infected recombinant adenovirus (Ad-Luc, Ad-Elovl5, Ad-Elovl6 [Panels A & B]; treated with DMSO or soraphen A (100 nM) and 50 µM 14C-palmitate [Panels A] or 14C-linoleate [Panels B & C] and as described in Figs. 3–6 above. The media from these studies was collected at the time of cell harvest and assayed for fatty acid oxidation products, ASM, acid soluble material (Methods). Results are reported as ASM, nmoles per mg protein, mean ± SD, n=3; *. p≤0.05 DMSO versus soraphen A; Anova, one-way.
Soraphen A treatment increased β-oxidation ~3-fold following treatment of cells with [1-14C]-palmitate or [1-14C]-linoleate (Fig. 7 A & B). Physiologically relevant levels of expression of Elovl5 or Elovl6 had no apparent effect on β-oxidation of 16- and 18-carbon fatty acids in the absence or presence of soraphen A. Elevated elongase expression also did not enhance 14C-fatty acid conversion to 14CO2 (Fig. 6S, supplementary data).
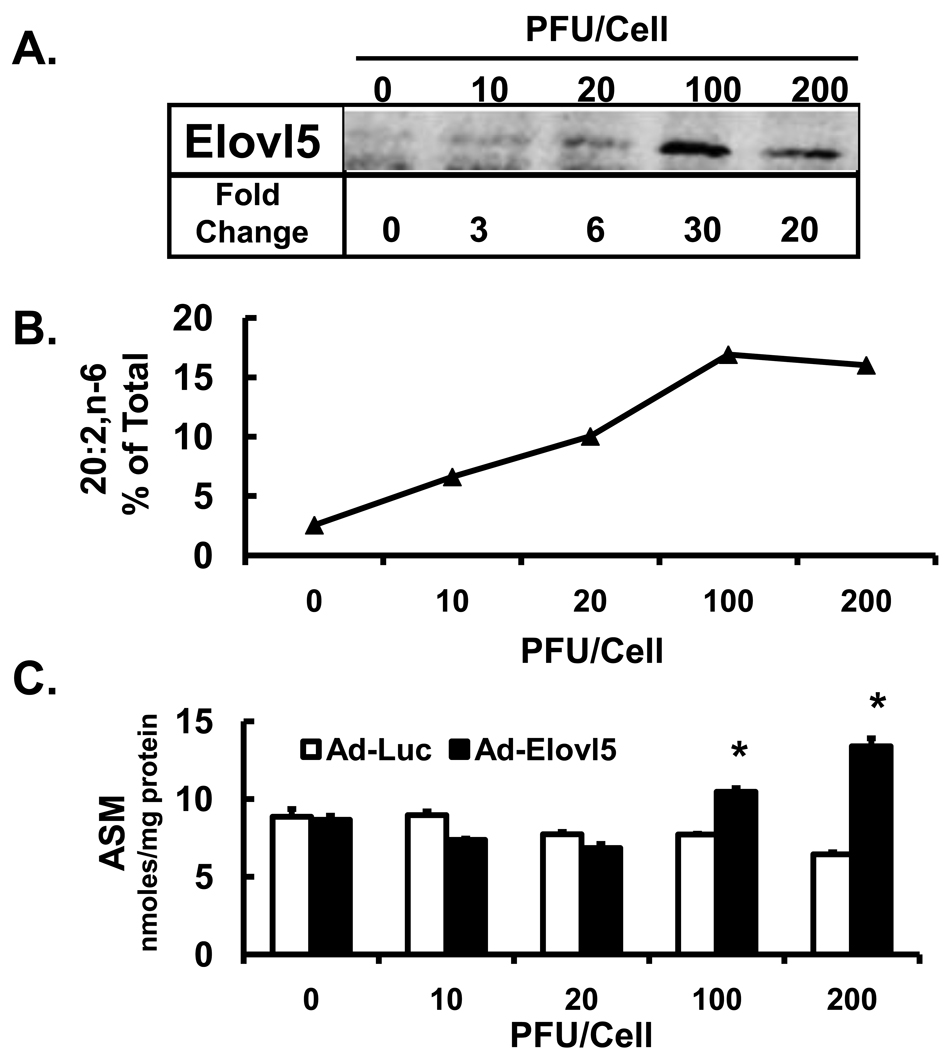
In an effort to determine if higher levels of elongase expression affect β-oxidation, HepG2 cells were infected with either Ad-Luc or Ad-Elovl5 up to 200 PFU/ml; cells were treated with [1-14C]-18:2,n-6 (Fig. 8). The immunoblot illustrates the effect of increasing the dose of Ad-Elovl5 on Elovl5 protein abundance in HepG2 cells. At 100 PFU/cell, Elovl5 protein was induced 30-fold. Elevated expression of Elovl5 correlated with elevated production of 20:2,n-6 (Fig. 8 B). Measurement of fatty acid oxidation (ASM) indicates that when compared to Ad-Luc infected cells, the level of β-oxidation increased only 2-fold in cells receiving ≥100 PFU of Ad-Elovl5 per cell. While supra-physiological levels of Elovl5 expression can induce FAO, this level of Elovl5 expression is likely never achieved in vivo.
Figure 8. High levels of Elovl5 expression increases fatty acid oxidation of 18:2,n-6.
HepG2 cells were infected with Ad-Luc or Ad-Elovl5 at 10–200 PFU/cell 48 hrs before fatty acid treatment. [Panel A]: Levels of Elovl5 were quantified by immunoblot (Methods). [Panel B]: Cells were treated with 50 µM [1-14C]-linoleate for 6 hrs and harvested for total lipid extraction and saponification for RP-HPLC fractionation and quantitation of 14C-20:2,n-6. Results are presented as 20:2,n-6, % of Total 14C-fatty acid recovered by RP-HPLC. [Panel C]: Media was harvested for analysis of 14C-linoleic acid oxidation products, i.e., acid soluble material (ASM, nmoles/mg protein). Results are the mean ± range of 2 separate studies. *. P≤0.05 versus DMSO, t-test.
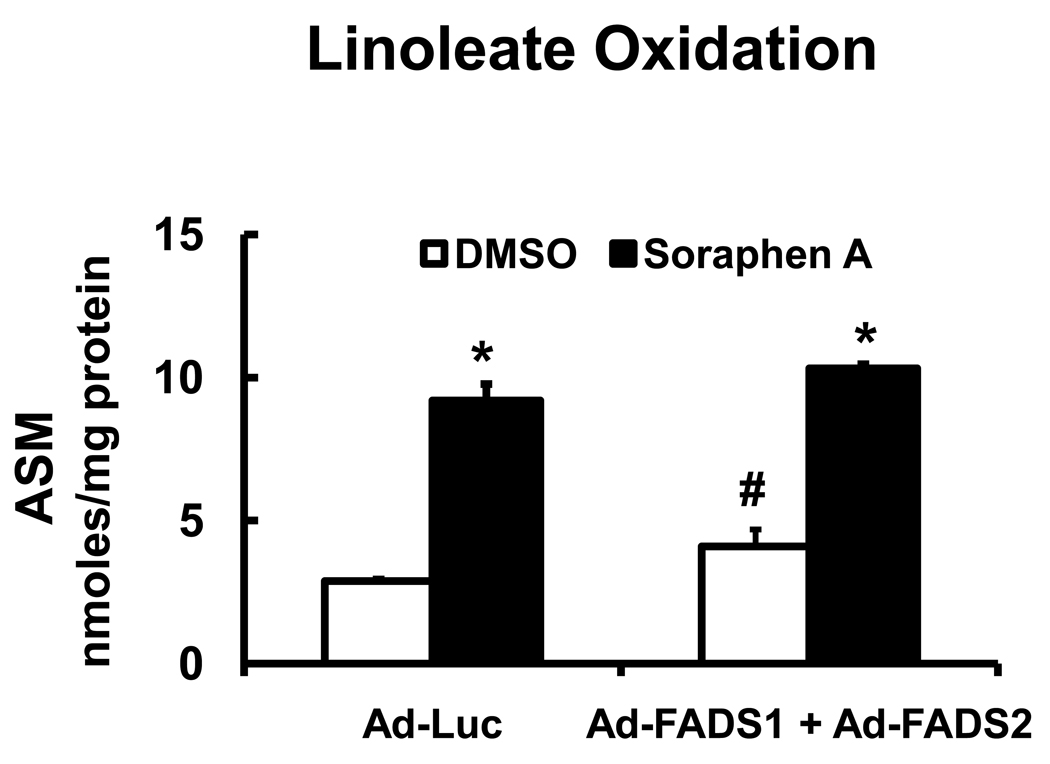
The effect of Ad-FADS1 plus Ad-FADS2 infection on 18:2,n-6 oxidation was also examined (Fig. 9). Expression of FADS1 and FADS2 in HepG2 cells stimulated the conversion of 18:2,n-6 to longer, more unsaturated fatty acids. This was associated with a modest (40%), yet significant increase in FAO. Soraphen A, however, induced a 3-fold increase in 18:2,n-6 oxidation. Stimulation of PUFA synthesis is a weak regulator of FAO, when compared to inhibition of ACC by soraphen A.
Figure 9. Effect of enhanced PUFA synthesis on FAO in HepG2 cells.
HepG2 cells were infected Ad-Luc or Ad-FADS1 + Ad-FADS2 and treated with DMSO or soraphen A (100 nM) and 50 µM 14C-linoleate as described in Figs. 6. The media was collected at the time of cell harvest and assayed for fatty acid oxidation products, ASM, acid soluble material (Methods). Results are reported as ASM, nmoles/mg protein, mean ± SD, n=4; *. p≤0.05 DMSO versus soraphen A; #, Ad-Luc versus Ad-FADS1 + Ad-FADS2, Anova-one way.
3.6. Dose response of soraphen A on fatty acid synthesis & elongation
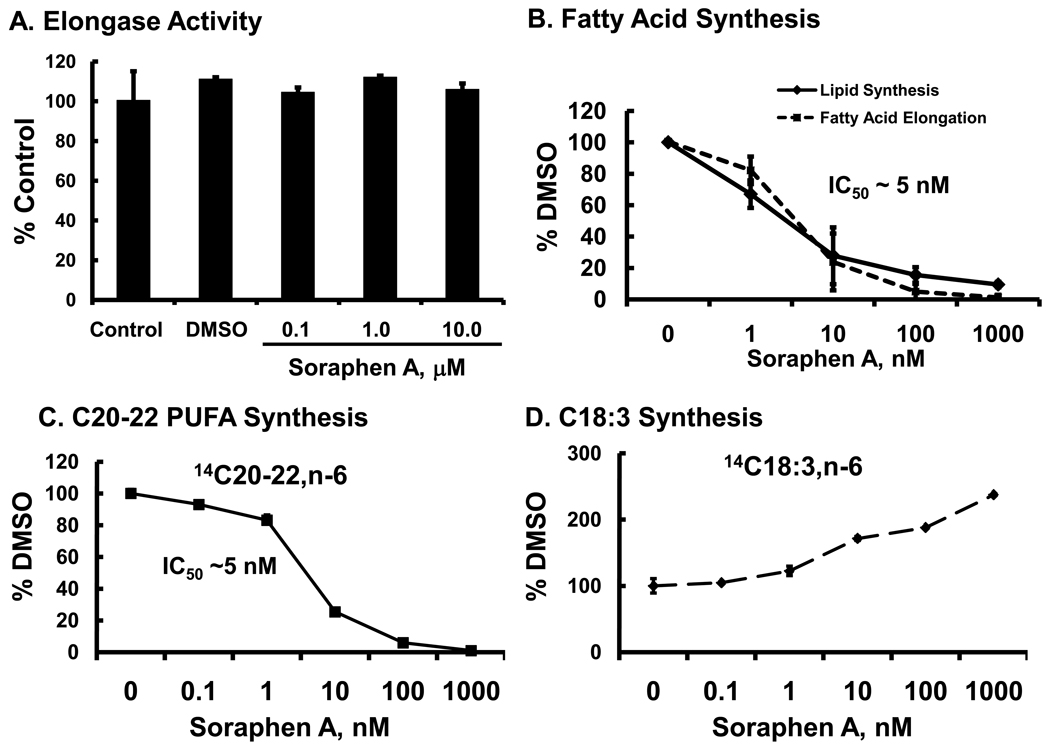
While the inhibitory mechanism of soraphen A on acetyl CoA carboxylase activity is well established [37, 38], it is possible that soraphen A has a direct effect on fatty acid elongation. To assess this possibility, we determined if soraphen A inhibited fatty acid elongation in isolated mouse liver microsomes (Fig. 10A). The fatty acyl CoA substrate used for this assay was 18:3,n-6-CoA; 18:3,n-6-CoA is a substrate for Elovl5, the predominant elongase expressed in HepG2 cells (Fig. 1S) and mouse & human liver (2, 41), and the elongase responsible for generating 20:2,n-6 in HepG2 cells (Fig. 5 & 8). Hepatic microsomes were pretreated with soraphen A for 10 minutes at doses ranging from 0.1 to 10 µM, prior to initiating the reaction with NADPH. These doses of soraphen A are equal to or greater than those used in all studies with HepG2 or LnCap cells. Fatty acid elongase activity was not affected by soraphen A at any dose (Fig. 10A).
Figure 10. Dose effect of soraphen A on microsomal fatty acid elongase activity and HepG2 lipid synthesis, fatty acid elongation & PUFA synthesis.
Panel A: Dose effect of soraphen A on fatty acid elongase activity in isolated hepatic microsomes. Mouse liver microsomes were isolated and used for a fatty acid elongase assay (Methods) [24, 25]. Microsomes were pretreated with DMSO or soraphen A (at 0.1 to 10 µM) for 10 mins prior to initiating the reaction with the addition of NADPH. After a 20 minute reaction, the elongation products were isolated and quantified [24, 25]. Results are expressed as % Control, mean ± SD, n=4. Elongase activity in control microsomes was 6 ± 0.8 nmoles malonyl CoA assimilated into fatty acid/mg protein, a value comparable to previously reported values [24, 25].
Panel B. Dose response of soraphen A regulation of lipid synthesis & fatty acid elongation. HepG2 cells were pre-treated with soraphen A, ranging from 0.1 nM to 1 µM, 2 hour prior to adding [2-14C]-acetate (lipid synthesis) or [1-14C]-18:2,n-6 [50 µM) (fatty acid elongation) as described above for all labeling studies. Cells were harvested and extracted for total lipid 6 hrs after adding [2-14C]-acetate or [1-14C]-18:2,n-6. The evaluation of soraphen A effects on lipid synthesis and fatty acid elongation used cells that were not infected with recombinant adenovirus. Lipid synthesis was assessed by quantifying [2-14C]-acetate assimilation into organic extracts; this includes both fatty acids and cholesterol. Fatty acid elongation was quantified by measuring the amount of 14C-20:2,n-6 formed following [1-14C]-18:2,n-6 treatment. Results are expressed as % DMSO control, mean ± SD, n=3.
Panel C & D: Dose response of soraphen A on PUFA synthesis. To evaluate soraphen A effects on PUFA synthesis, HepG2 cells were infected with Ad-FADS1 and Ad-FADS2 48 hrs prior to adding soraphen A and [1-14C]-18:2,n-6, as described in Fig. 6. PUFA synthesis was quantified by measuring the amount of [1-14C]-18:2,n-6 converted to 14C20–22 PUFA (Panel C) and 14C-18:3,n-6 (Panel D). 14C20–22 PUFA is the sum of 14C assimilated into 20:2,n-6, 20:3,n-6, 20:4,n-6, 22:4,n-6, 22:5,n-6. Results are expressed as % DMSO-treated cells. Results are from 2 separate studies with duplicate samples, mean ± S.D. n=4.
A dose response study was also used to determine if there was a significant difference in the response of DNL and fatty acid elongation to soraphen A. HepG2 cells were not infected in any recombinant adenovirus. Figure 10B illustrates the effect of soraphen A on lipid synthesis and fatty acid elongation in HepG2 cells. [2-14C]-acetate was used to label lipids (fatty acid and cholesterol, Fig. 1). After treatment and organic extraction, the chloroform-soluble products were quantified by β-scintillation counting. [1-14C]-18:2,n-6 was used as a substrate to generate 14C-20:2,n-6, an Elovl5 elongation product (Fig. 5); 14C-20:2,n-6 was quantified by RP-HPLC & β-scintillation counting. The results of this study show that the lipid synthesis and fatty acid elongation are equally sensitive to soraphen A; IC50 ~5 nM.
Next, the effect of soraphen A on PUFA metabolism was assessed in HepG2 cells over-expressing FADS1 and FADS2. This study examined the dose effect of soraphen A on 14C-18:2,n-6 conversion to C20–22 PUFA (Fig. 10C) and 18:3,n-6 (Fig. 10D). Soraphen A inhibited the formation of C20–22 PUFA; IC50 ~5 nM. Soraphen A stimulated a ~2.7-fold increase in 18:3,n-6. These values are identical to the IC50 for the soraphen A inhibition of DNL and fatty acid elongation (Fig. 10 B). Based on these results, soraphen A does not directly inhibit fatty acid elongase activity, but acts indirectly through its robust inhibition of ACC activity. As such, ACC appears to be the major source of malonyl CoA required for microsomal fatty acid elongation. This analysis establishes that DNL, fatty acid elongation and C20–22 PUFA synthesis are equally sensitive to ACC inhibition by soraphen A, i.e., IC50~5 nM.
4. Discussion
Our goal in this report was to assess the impact of ACC inhibition on fatty acid elongation and desaturation in HepG2 and LnCap cells. The rationale for this analysis is based on the fact that malonyl CoA is a substrate for DNL and fatty acid elongation [18–20] and a potent allosteric inhibitor of CPT1 activity and mitochondrial β-oxidation (FAO) [15, 43]. To date, however, no study has reported on the impact of ACC inhibition or ablation on fatty acid elongation. This issue becomes particularly relevant in light of the role fatty acid elongases play in the generation of the diverse array of saturated, mono and polyunsaturated fatty acids in cells. Changes in fatty acid content of cells have broad effects on metabolism, cell signaling, gene expression and impact the onset and progression of chronic diseases.
The increasing obesity epidemic has prompted approaches to manage the accumulation of neutral lipids in tissues because elevated neutral lipid storage promotes inflammation and insulin resistance [44–48]. ACC is an attractive drug target because of its effects on DNL and FAO [12–14]. In LnCap cells, soraphen A inhibits cell growth and promotes apoptosis [8]. ACC inhibitors lower cellular malonyl CoA content and impact cholesterol and fatty acid metabolism, insulin sensitivity, cell growth and apoptosis [7, 8, 13, 16, 17, 49]. Unlike RNAi approaches [50, 51], however, chemical inhibition of ACC rapidly inhibits fatty acid synthesis (Fig. 1) [13, 16]. Soraphen A was chosen for these studies because the mechanism of soraphen A inhibition of ACC is well defined [37, 38]. The rapidity of soraphen A inhibition on lipid metabolism minimizes non-specific or adaptive effects brought on by changes in cell fatty acid composition and cell growth. Recombinant adenoviral approaches were used to elevate elongase activity in an effort to assess the impact of this manipulation on DNL and FAO. In agreement with others [8, 13, 16], soraphen A inhibited DNL and stimulates cholesterol synthesis in HepG2 and LnCap cells (Figs. 1 & 2). The new information reported here is: 1) soraphen A inhibits elongation of products derived from DNL (Figs. 1 & 10), and exogenous saturated (Figs. 2, 3 & 10) and unsaturated fatty acids (Figs. 4–6 & 10). DNL, fatty acid elongation & PUFA synthesis are equally sensitive to soraphen A inhibition, IC50 ~ 5 nM (Figs. 10). Soraphen A, however, has no direct effect on fatty acid elongation in isolated microsomes (Figs. 10). 2) Soraphen A augments the accumulation of unsaturated fatty acids derived from saturated and polyunsaturated fatty acid precursors (Figs. 3–6 & 10). 3) Elevated expression of fatty acid elongases, Elovl5 and Elovl6, or fatty acid desaturases (FADS1 and FADS2) failed to override the inhibitory effect of soraphen A on fatty acid elongation, or synthesis of C18–22 MUFA or PUFA (Figs. 5 & 6). These results establish that ACC inhibition not only impacts fatty acid elongation, but disrupts pathways where both elongases and desaturases are utilized to generate major MUFA and PUFA found in cells. These studies establish a strong link between ACC and SFA, MUFA and PUFA synthesis through the control of fatty acid elongase activity.
Based on mRNA analysis, ACC1 is the major ACC subtype expressed in HepG2 and LnCap cells (Fig. 1S, supplementary data). Although soraphen A binds the BC domain of both ACC1 and ACC2 and inhibits ACC activity [37, 52], soraphen A likely targets ACC1 in both cell types. As such, ACC1 is likely the major source of malonyl CoA for microsomal fatty acid elongation in HepG2 and LnCap cells. Once ACC1 and ACC2-specific inhibitors become available, it will be interesting to determine if ACC2 contributes malonyl CoA to fatty acid elongation.
Addition of soraphen A to high fat diets was found to improve body weight, total body fat, peripheral insulin sensitivity & plasma glucose, insulin and β-hydroxybutyrate levels in C57BL/6 mice [7]. These authors did not describe effects on tissue or plasma PUFA content. Based on our findings, dietary soraphen A or other ACC inhibitors are predicted to alter tissue and plasma MUFA and PUFA content. Inhibition of ACC affects PPAR regulated gene expression [49]. PPARα is a well established target of fatty acid regulation[53]. Changes in cellular fatty acid elongases activity affect cellular fatty acid content which in turn impacts PPARα activity [29].
The effect of soraphen A on 16- and 18-carbon saturated and monounsaturated fatty acid synthesis may be beneficial. Soraphen A inhibits the elongation of fatty acids derived from DNL and exogenously supplied 16:0 (Fig. 1–3). Inhibition of ACC, however, does not attenuate the formation of 16:1,n-7, a stearoyl CoA desaturation (SCD) product of 16:0. Soraphen A and ablation of SCD1 have a common effect on cell fatty acid composition; both treatments lower tissue content of 18:1 (n-7 and n-9). SCD1 ablation inhibits hepatic triglyceride accumulation and protects against diet-induced obesity [26, 27]. The soraphen A-induced accumulation of 16:1,n-7 in cells is noteworthy because 16:1,n-7 was recently reported as a lipokine capable of enhancing muscle insulin sensitivity [54]. Since soraphen A inhibits elongation, and not desaturation, chronic use of ACC inhibitors might inhibit triglyceride synthesis and improve insulin sensitivity.
In contrast, ACC inhibition of PUFA synthesis raises concern (Figs. 4–6). Soraphen A does not inhibit 18:2,n-6 desaturation by FADS2, its blocks the subsequent elongation of 18:3,n-6 to 20:3,n-6 a substrate for FADS1. Soraphen A blocks arachidonic (20:4,n-6) synthesis. Since the same enzymes are used for both n-3 and n-6 PUFA synthesis, we predict that dietary 18:3,n-3 will not be converted to 22:6,n-3. 20:4,n-6 and 22:6,n-3 are major PUFA that affect multiple cell function through diverse mechanisms, including membrane fluidity, cholesterol content & lipid raft integrity, eicosanoids & docosanoids, cytokine & adhesion molecule production, as well as controlling several cell signaling mechanisms & and effects on gene expression [53, 55]. An absence of essential fatty acids in the diet (i.e., essential fatty acid deficiency) or global ablation of a FADS2 leads to major problems with skin, reproduction, vision and learning [56–58]. Disruption of PUFA synthesis through inhibition of ACC is likely to significantly affect multiple physiological systems.
Previous efforts to alter malonyl CoA metabolism involved over expression of malonyl CoA decarboxylase (MCD) (Figure 11); elevated expression of MCD lowers hepatic malonyl CoA by 60%, reverses hepatic steatosis and improves whole body insulin sensitivity in high fat-fed mice [59]. Since elevated hepatic Elovl5 activity lowers hepatic and plasma triglyceride content [29] and lowers plasma glucose and insulin in high fat fed mice [60], we speculated that elevated elongase activity in HepG2 cells might induce FAO. Elevation of Elovl5 and Elovl6 expression in HepG2 cells did not induce FAO of 16:0 or 18:2,n-6 (Fig. 7). Supra-physiological levels of Elovl5 stimulated 18:2,n-6 elongation to 20:2,n-6 by ~10-fold and FAO by ~2-fold (Fig. 8). Despite the fact that hepatic fatty acid elongases are regulated by age, diet and drugs [24, 25], the changes seen in Elovl5 & Elovl6 activity in vivo do not approach the changes described in Fig. 8. Our results do not support a role for Elovl5 or Elovl6 in the suppression of cellular malonyl CoA to levels sufficient to activate FAO. The finding that elevated FADS2 stimulates both PUFA synthesis and FAO (Fig. 9) suggests that altered PUFA synthesis might be a factor controlling hepatic lipid and carbohydrate metabolism. Further study will be required to define this mechanism.
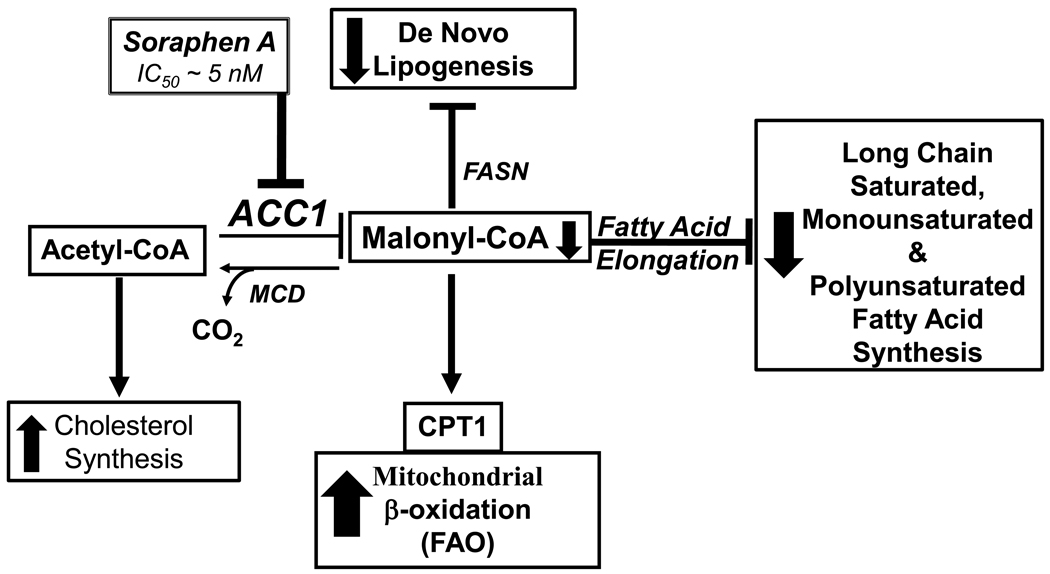
Figure 11. Schematic illustrating effects of soraphen A on lipid metabolism.
See text for explanation.
Finally, HepG2 cells have low FADS2 expression (Fig. 1S, supplementary data) and 20:2,n-6 is the predominant product of 18:2,n-6 metabolism (Figs. 4 & 5). Infection of HepG2 cells with Elovl5 increases 18:2,n-6 conversion to 20:2,n-6. This fatty acid was recently described in studies with the FADS2 null mouse [42]. LnCap cells, in contrast, express high levels of FADS2 and generate robust levels of 20:3,n-6 and 20:4,n-6 from 18:2,n-6 metabolism. The paucity of FADS2 activity is not unique to HepG2 cells. Other hepatoma cell lines (LO2, McA-RH777) as well as rat primary hepatocytes have low FADS2 expression and FADS2-mediated desaturation [61]. Results with primary cells and established cell lines contrast with the level of expression of FADS2 in rat, mouse & human liver [24]. The reason for the deficient FADS2 expression in hepatoma cell lines and rat primary hepatocytes is unknown. Since Ad-FADS2 infection of HepG2 cells restores desaturation of 18:2,n-6, other factors required for fatty acid desaturation are not limiting (Fig. 6). Defining the impact of pharmacological regulators of fatty acid synthesis requires using cells with the capacity for DNL, MUFA and PUFA synthesis.
In summary, inhibition of ACC activity increases FAO and fatty acid desaturation, but blocks DNL and fatty acid elongation. Inhibition of ACC leads to a significant shift in fatty acid metabolism where SFA and essential fatty acids are desaturated but not elongated. This impairs the formation of key fatty acids e.g., 18:1,n-9, 20:4,n-6 and 22:6,n-3, and promotes the accumulation of 16:1,n-7 and 18:3,n-6. How such changes in tissue fatty acid profiles impact cell function remain to be determined. ACC plays an important role in SFA, MUFA and PUFA synthesis through mechanism that are independent of its role in DNL and FAO.
Supplementary Material
Acknowledgements
The authors would like to thank Tedd Elich at Cropsolutions, Inc (NIH SBIR, DK068962) for the generous gift of soraphen A for use in our studies. This project was supported by the National Institutes of Health (DK43220) and the National Institute for Food and Agriculture (2009-65200-05846) to DBJ and the American Diabetes Association (7-06-RA-103) to LKO. The authors also thank James Harwood (Delphi BioMedical Consultants, LLC) for many helpful suggestions regarding soraphen A and the effects of other ACC inhibitors on lipid metabolism. We also thank Drs. Yun Wang and Christopher Green and Ms. Katrina Linning for expert technical support.
Abbreviations
- ACC
acetyl CoA carboxylase
- ASM
acid soluble material
- ARA
arachidonic acid (20:4,n-6)
- CPT1
carnitine palmitoyl transferase 1
- DHA
docosahexaenoic acid (22:6,n-3)
- DNL
de novo lipogenesis
- FADS1
Δ5-desaturase
- FADS2
Δ6-desaturase
- DHGL
dihomo-γ-linolenic acid (20:3,n-6)
- Elovl
fatty acid elongase
- FASN
fatty acid synthase
- LUC
luciferase
- MCD
malonyl CoA decarboxylase
- MUFA
monounsaturated fatty acid
- NEFA
non-esterified fatty acid
- pβOx
peroxisomal β oxidation
- PUFA
polyunsaturated fatty acid
- RP-HPLC
reverse phase high performance chromatography
- SFA
saturated fatty acid
- SCD1
stearoyl CoA desaturase
- RT-PCR
real time PCR
- TLC
thin layer chromatography
Footnotes
Publisher's Disclaimer: This is a PDF file of an unedited manuscript that has been accepted for publication. As a service to our customers we are providing this early version of the manuscript. The manuscript will undergo copyediting, typesetting, and review of the resulting proof before it is published in its final citable form. Please note that during the production process errors may be discovered which could affect the content, and all legal disclaimers that apply to the journal pertain.
Literature Cited
- 1.Mao J, DeMayo FJ, Li H, et al. Liver-specific deletion of acetyl-CoA carboxylase 1 reduces hepatic triglyceride accumulation without affecting glucose homeostasis. Proc Natl Acad Sci U S A. 2006;103:8552–8557. doi: 10.1073/pnas.0603115103. [DOI] [PMC free article] [PubMed] [Google Scholar]
- 2.Abu-Elheiga L, Matzuk MM, Kordari P, et al. Mutant mice lacking acetyl-CoA carboxylase 1 are embryonically lethal. Proc Natl Acad Sci U S A. 2005;102:12011–12016. doi: 10.1073/pnas.0505714102. [DOI] [PMC free article] [PubMed] [Google Scholar]
- 3.Choi CS, Savage DB, Abu-Elheiga L, et al. Continuous fat oxidation in acetyl-CoA carboxylase 2 knockout mice increases total energy expenditure, reduces fat mass, and improves insulin sensitivity. Proc Natl Acad Sci U S A. 2007;104:16480–16485. doi: 10.1073/pnas.0706794104. [DOI] [PMC free article] [PubMed] [Google Scholar]
- 4.Chakravarthy MV, Pan Z, Zhu Y, et al. "New" hepatic fat activates PPARα to maintain glucose, lipid, and cholesterol homeostasis. Cell Metab. 2005;1:309–322. doi: 10.1016/j.cmet.2005.04.002. [DOI] [PubMed] [Google Scholar]
- 5.Ntambi JM, Miyazaki M, Stoehr JP, et al. Loss of stearoyl-CoA desaturase-1 function protects mice against adiposity. Proc Natl Acad Sci U S A. 2002;99:11482–11486. doi: 10.1073/pnas.132384699. [DOI] [PMC free article] [PubMed] [Google Scholar]
- 6.Miyazaki M, Kim YC, Gray-Keller MP, et al. The biosynthesis of hepatic cholesterol esters and triglycerides is impaired in mice with a disruption of the gene for stearoyl-CoA desaturase 1. J Biol Chem. 2000;275:30132–30138. doi: 10.1074/jbc.M005488200. [DOI] [PubMed] [Google Scholar]
- 7.Schreurs M, van Dijk TH, Gerding A, Havinga R, Reijngoud D-J, Kuipers F. Effect of soraphen in insulin sensitivity. Diabetes, Obesity & Metabolism. 2009;11:987–991. doi: 10.1111/j.1463-1326.2009.01078.x. [DOI] [PubMed] [Google Scholar]
- 8.Beckers A, Organe S, Timmermans L, et al. Chemical inhibition of acetyl-CoA carboxylase induces growth arrest and cytotoxicity selectively in cancer cells. Cancer Res. 2007;67:8180–8187. doi: 10.1158/0008-5472.CAN-07-0389. [DOI] [PubMed] [Google Scholar]
- 9.Harwood HJ., Jr Acetyl-CoA carboxylase inhibition for the treatment of metabolic syndrome. Curr Opin Investig Drugs. 2004;5:283–289. [PubMed] [Google Scholar]
- 10.Harwood HJ., Jr Treating the metabolic syndrome: acetyl-CoA carboxylase inhibition. Expert Opin Ther Targets. 2005;9:267–281. doi: 10.1517/14728222.9.2.267. [DOI] [PubMed] [Google Scholar]
- 11.Dobrzyn A, Ntambi JM. Stearoyl-CoA desaturase as a new drug target for obesity treatment. Obes Rev. 2005;6:169–174. doi: 10.1111/j.1467-789X.2005.00177.x. [DOI] [PubMed] [Google Scholar]
- 12.Corbett JW, Harwood JH., Jr Inhibitors of mammalian acetyl-CoA carboxylase. Recent Patents Cardiovasc Drug Discov. 2007;2:162–180. doi: 10.2174/157489007782418928. [DOI] [PubMed] [Google Scholar]
- 13.Harwood HJ, Jr, Petras SF, Shelly LD, Zaccaro LM, Perry DA, Makowski MR, Hargrove DM, Martin KA, Tracey WR, Chapman JG, Magee WP, Dalvie DK, Soliman VF, Martin WH, Mularski CJ, Eisenbeis SA. Isozyme-nonselective N-substituted bipiperidylcarboxamide acetyl CoA carboxylase inhibitors reduce tissue malonyl CoA concentrations, inhibit fatty acid synthesis and increase fatty acid oxidation in cultured cells and in experimental animals. J Biol Chem. 2003;278:37099–37111. doi: 10.1074/jbc.M304481200. [DOI] [PubMed] [Google Scholar]
- 14.Wakil SJ, Abu-Elheiga LA. Fatty acid metabolism: target for metabolic syndrome. J Lipid Res. 2009;50 Suppl:S138–S143. doi: 10.1194/jlr.R800079-JLR200. [DOI] [PMC free article] [PubMed] [Google Scholar]
- 15.Saggerson D. Malonyl-CoA, a key signaling molecule in mammalian cells. Annu. Rev. Nutr. 2008;28:253–272. doi: 10.1146/annurev.nutr.28.061807.155434. [DOI] [PubMed] [Google Scholar]
- 16.Sugimoto Y, Naniwa Y, Nakamura T, Kato H, Yamamato M, Tanabe H, Inoue K, Imaizumi A. A novel acetyl CoA carboxylase inhibitor reduces de novo fatty acid synthesis in HepG2 cells and rat primary hepatocytes. Arch Biochem Biophys. 2007;468:44–48. doi: 10.1016/j.abb.2007.09.012. [DOI] [PubMed] [Google Scholar]
- 17.Tong LaH JH., Jr Acetyl CoA Carboxylase: Versitile targets for drug discovery. J Cell Biochem. 2006;99:1476–1488. doi: 10.1002/jcb.21077. [DOI] [PMC free article] [PubMed] [Google Scholar]
- 18.Cinti DL, Cook L, Nagi MN, Suneja SK. The fatty acid chain elongation system of mammalian endoplasmic reticulum. Prog Lipid Res. 1992;31:1–51. doi: 10.1016/0163-7827(92)90014-a. [DOI] [PubMed] [Google Scholar]
- 19.Jakobsson A, Westerberg R, Jacobsson A. Fatty acid elongases in mammals: Their regulation and role in metabolism. Progress in Lipid Research. 2006;45:237–249. doi: 10.1016/j.plipres.2006.01.004. [DOI] [PubMed] [Google Scholar]
- 20.Leonard AE, Pereira SL, Sprecher H, Huang YS. Elongation of long-chain fatty acids. Prog Lipid Res. 2004;43:36–54. doi: 10.1016/s0163-7827(03)00040-7. [DOI] [PubMed] [Google Scholar]
- 21.Denic V, Weissman JS. A molecular caliper mechanism for determining very long-chain fatty acid length. Cell. 2007;130:663–677. doi: 10.1016/j.cell.2007.06.031. [DOI] [PubMed] [Google Scholar]
- 22.Moon YA, Horton JD. Identification of two mammalian reductases involved in the two-carbon fatty acyl elongation cascade. J Biol Chem. 2003;278:7335–7343. doi: 10.1074/jbc.M211684200. [DOI] [PubMed] [Google Scholar]
- 23.Cook HW. Fatty Acid Desaturation and chain elongation in eucaryotes. In: Vance DE, Vance JE, editors. Biochemistry of Lipids and Membranes. Ch. 6. 1985. pp. 181–212. [Google Scholar]
- 24.Wang Y, Botolin D, Xu J, et al. Regulation of hepatic fatty acid elongase and desaturase expression in diabetes and obesity. J Lipid Res. 2006;47:2028–2041. doi: 10.1194/jlr.M600177-JLR200. [DOI] [PMC free article] [PubMed] [Google Scholar]
- 25.Wang Y, Botolin D, Christian B, et al. Tissue-specific, nutritional, and developmental regulation of rat fatty acid elongases. J Lipid Res. 2005;46:706–715. doi: 10.1194/jlr.M400335-JLR200. [DOI] [PMC free article] [PubMed] [Google Scholar]
- 26.Miyazaki M, Kim YC, Ntambi JM. A lipogenic diet in mice with a disruption of the stearoyl-CoA desaturase 1 gene reveals a stringent requirement of endogenous monounsaturated fatty acids for triglyceride synthesis. J Lipid Res. 2001;42:1018–1024. [PubMed] [Google Scholar]
- 27.Miyazaki M, Flowers MT, Sampath H, et al. Hepatic stearoyl-CoA desaturase-1 deficiency protects mice from carbohydrate-induced adiposity and hepatic steatosis. Cell Metab. 2007;6:484–496. doi: 10.1016/j.cmet.2007.10.014. [DOI] [PubMed] [Google Scholar]
- 28.Matsuzaka T, Shimano H, Yahagi N, et al. Crucial role of a long-chain fatty acid elongase, Elovl6, in obesity-induced insulin resistance. Nat Med. 2007;13:1193–1202. doi: 10.1038/nm1662. [DOI] [PubMed] [Google Scholar]
- 29.Wang Y, Torres-Gonzalez M, Tripathy S, et al. Elevated hepatic fatty acid elongase-5 activity affects multiple pathways controlling hepatic lipid and carbohydrate composition. J Lipid Res. 2008;49:1538–1552. doi: 10.1194/jlr.M800123-JLR200. [DOI] [PMC free article] [PubMed] [Google Scholar]
- 30.Moon YA, Hammer RE, Horton JD. Deletion of ELOVL5 leads to fatty liver through activation of SREBP-1c in mice. J Lipid Res. 2008;50:412–423. doi: 10.1194/jlr.M800383-JLR200. [DOI] [PMC free article] [PubMed] [Google Scholar]
- 31.Minkler P, Kerner J, Ingalls ST, Hoppel CL. Novel isolation prodedure for short, medium- and long-chain acyl-coenzyme A esters from tissue. Anal. Biochem. 2008;376:275–276. doi: 10.1016/j.ab.2008.02.022. [DOI] [PMC free article] [PubMed] [Google Scholar]
- 32.Pizer ES, Chrest FJ, DiGiuseppe JA, Han WF. Pharmacological inhibitors of mammalian fatty acid synthase suppress DNA replication and induce apoptosis in tumor cell lines. Cancer Res. 1998;58:4611–4615. [PubMed] [Google Scholar]
- 33.Kim JH, Lewin TM, Coleman RA. Expression and characterization of recombinant rat Acyl-CoA synthetases 1, 4, and 5. Selective inhibition by triacsin C and thiazolidinediones. J Biol Chem. 2001;276:24667–24673. doi: 10.1074/jbc.M010793200. [DOI] [PubMed] [Google Scholar]
- 34.Gerth K, Bedorf N, Irschik H, et al. The soraphens: a family of novel antifungal compounds from Sorangium cellulosum (Myxobacteria). I. Soraphen A1 alpha: fermentation, isolation, biological properties. J Antibiot (Tokyo) 1994;47:23–31. doi: 10.7164/antibiotics.47.23. [DOI] [PubMed] [Google Scholar]
- 35.Gerth K, Pradella S, Perlova O, et al. Myxobacteria: proficient producers of novel natural products with various biological activities--past and future biotechnological aspects with the focus on the genus Sorangium. J Biotechnol. 2003;106:233–253. doi: 10.1016/j.jbiotec.2003.07.015. [DOI] [PubMed] [Google Scholar]
- 36.Vahlensieck HF, Pridzun L, Reichenbach H, Hinnen A. Identification of the yeast ACC1 gene product (acetyl-CoA carboxylase) as the target of the polyketide fungicide soraphen A. Curr Genet. 1994;25:95–100. doi: 10.1007/BF00309532. [DOI] [PubMed] [Google Scholar]
- 37.Shen Y, Volrath SL, Weatherly SC, et al. A mechanism for the potent inhibition of eukaryotic acetyl-coenzyme A carboxylase by soraphen A, a macrocyclic polyketide natural product. Mol Cell. 2004;16:881–891. doi: 10.1016/j.molcel.2004.11.034. [DOI] [PubMed] [Google Scholar]
- 38.Cho YS, Lee JL, Shin D, Kim HT, Jung HY, Lee TG, Kang LW, Ahn YJ, Cho HS, Heo YS. Molecular mechanism for the regulation of human ACC2 through phosphorylation by AMPK. Biochem. Biophys. Res. Commun. 2010;391:187–192. doi: 10.1016/j.bbrc.2009.11.029. [DOI] [PubMed] [Google Scholar]
- 39.Kridel SJ, Axelrod F, Rozenkrantz N, Smith JW. Orlistat is a novel inhibitor of fatty acid synthase with antitumor activity. Cancer Res. 2004;64:2070–2075. doi: 10.1158/0008-5472.can-03-3645. [DOI] [PubMed] [Google Scholar]
- 40.Pizer ES, Thupari J, Han WF, et al. Malonyl-coenzyme-A is a potential mediator of cytotoxicity induced by fatty-acid synthase inhibition in human breast cancer cells and xenografts. Cancer Res. 2000;60:213–218. [PubMed] [Google Scholar]
- 41.Moon YA, Shah NA, Mohapatra S, et al. Identification of a mammalian long chain fatty acyl elongase regulated by sterol regulatory element-binding proteins. J Biol Chem. 2001;276:45358–45366. doi: 10.1074/jbc.M108413200. [DOI] [PubMed] [Google Scholar]
- 42.Park WJ, Kothapalli KS, Lawrence P, et al. An alternate pathway to long chain polyunsaturates: The FADS2 gene product u8-desaturates 20:2n-6 and 20:3n-3. J Lipid Res. 2009;50:1195–1202. doi: 10.1194/jlr.M800630-JLR200. [DOI] [PMC free article] [PubMed] [Google Scholar]
- 43.Muoio DM, Newgard CB. Fatty acid oxidation and insulin action: when less is more. Diabetes. 2008;57:1455–1456. doi: 10.2337/db08-0281. [DOI] [PubMed] [Google Scholar]
- 44.Handschin C, Spiegelman BM. The role of exercise and PGC1α in inflammation and chronic disease. Nature. 2008;454:463–469. doi: 10.1038/nature07206. [DOI] [PMC free article] [PubMed] [Google Scholar]
- 45.Biddinger SB, Hernandez-Ono A, Rask-Madsen C, et al. Hepatic insulin resistance is sufficient to produce dyslipidemia and susceptibility to atherosclerosis. Cell Metab. 2008;7:125–134. doi: 10.1016/j.cmet.2007.11.013. [DOI] [PMC free article] [PubMed] [Google Scholar]
- 46.Biddinger SB, Kahn CR. From mice to men: insights into the insulin resistance syndromes. Annu Rev Physiol. 2006;68:123–158. doi: 10.1146/annurev.physiol.68.040104.124723. [DOI] [PubMed] [Google Scholar]
- 47.Lionetti L, Mollica MP, Lombardi A, et al. From chronic overnutrition to insulin resistance: the role of fat-storing capacity and inflammation. Nutr Metab Cardiovasc Dis. 2009;19:146–152. doi: 10.1016/j.numecd.2008.10.010. [DOI] [PubMed] [Google Scholar]
- 48.Rocha VZ, Libby P. Obesity, inflammation, and atherosclerosis. Nat Rev Cardiol. 2009;6:399–409. doi: 10.1038/nrcardio.2009.55. [DOI] [PubMed] [Google Scholar]
- 49.Waring JF, Yang Y, Healan-Greenberg CH, et al. Gene expression analysis in rats treated with experimental acetyl-coenzyme A carboxylase inhibitors suggests interactions with the peroxisome proliferator-activated receptor α pathway. J Pharmacol Exp Ther. 2008;324:507–516. doi: 10.1124/jpet.107.126938. [DOI] [PubMed] [Google Scholar]
- 50.Chajes V, Cambot M, Moreau K, et al. Acetyl-CoA carboxylase α is essential to breast cancer cell survival. Cancer Res. 2006;66:5287–5294. doi: 10.1158/0008-5472.CAN-05-1489. [DOI] [PubMed] [Google Scholar]
- 51.Brusselmans K, De Schrijver E, Verhoeven G, Swinnen JV. RNA interference-mediated silencing of the acetyl-CoA-carboxylase-α gene induces growth inhibition and apoptosis of prostate cancer cells. Cancer Res. 2005;65:6719–6725. doi: 10.1158/0008-5472.CAN-05-0571. [DOI] [PubMed] [Google Scholar]
- 52.Weatherly SC, Volrath SL, Elich TD. Expression and characterization of recombinant fungal acetyl-CoA carboxylase and isolation of a soraphen-binding domain. Biochem J. 2004;380:105–110. doi: 10.1042/BJ20031960. [DOI] [PMC free article] [PubMed] [Google Scholar]
- 53.Jump DB. N-3 polyunsaturated fatty acid regulation of hepatic gene transcription. Curr Opin Lipidol. 2008;19:242–247. doi: 10.1097/MOL.0b013e3282ffaf6a. [DOI] [PMC free article] [PubMed] [Google Scholar]
- 54.Liu HY, Wen GB, Han J, et al. Inhibition of Gluconeogenesis in Primary Hepatocytes by Stromal Cell-derived Factor-1 (SDF-1) through a c-Src/Akt-dependent Signaling Pathway. J Biol Chem. 2008;283:30642–30649. doi: 10.1074/jbc.M803698200. [DOI] [PMC free article] [PubMed] [Google Scholar]
- 55.Jump DB, Botolin D, Wang Y, et al. Docosahexaenoic acid (DHA) and hepatic gene transcription. Chem Phys Lipids. 2008;153:3–13. doi: 10.1016/j.chemphyslip.2008.02.007. [DOI] [PMC free article] [PubMed] [Google Scholar]
- 56.Nakamura MT, Nara TY. Structure, function, and dietary regulation of delta6, delta5, and delta9 desaturases. Annu Rev Nutr. 2004;24:345–376. doi: 10.1146/annurev.nutr.24.121803.063211. [DOI] [PubMed] [Google Scholar]
- 57.Nakamura MT, Nara TY. Essential fatty acid synthesis and its regulation in mammals. Prostaglandins Leukot Essent Fatty Acids. 2003;68:145–150. doi: 10.1016/s0952-3278(02)00264-8. [DOI] [PubMed] [Google Scholar]
- 58.Spector AA. Essentiality of fatty acids. Lipids. 1999;34:S1–S4. doi: 10.1007/BF02562220. [DOI] [PubMed] [Google Scholar]
- 59.An J, Muoio DM, Shiota M, Fujimoto Y, Cline GW, Shulman GI, Koves TR, Stevens R, Millington D, Newgard CB. Hepatic expression of malonyl CoA decarboxylase reverses muscle, liver and whole animal insulin resistance. Nat. Med. 2004;10:268–274. doi: 10.1038/nm995. [DOI] [PubMed] [Google Scholar]
- 60.Tripathy S, Torres-Gonzalez M, Jump DB. Elevated hepatic fatty acid elongase-5 (Elovl5) activity corrects dietary fat induced hyperglycemia in obese C57BL/6J mice. J Lipid Res. 2010;51:2642–2654. doi: 10.1194/jlr.M006080. [DOI] [PMC free article] [PubMed] [Google Scholar]
- 61.Pawar A, Jump DB. Unsaturated fatty acid regulation of peroxisome proliferator-activated receptor alpha activity in rat primary hepatocytes. J Biol Chem. 2003;278:35931–35939. doi: 10.1074/jbc.M306238200. [DOI] [PubMed] [Google Scholar]
- 62.Sprecher H. Metabolism of highly unsaturated n-3 and n-6 fatty acids. Biochimica et Biophysica Acta. 2000;1486:219–231. doi: 10.1016/s1388-1981(00)00077-9. [DOI] [PubMed] [Google Scholar]
Associated Data
This section collects any data citations, data availability statements, or supplementary materials included in this article.


