

Abstract
A recent study showed that people evaluate products more positively when they are physically associated with art images than similar non-art images. Neuroimaging studies of visual art have investigated artistic style and esthetic preference but not brain responses attributable specifically to the artistic status of images. Here we tested the hypothesis that the artistic status of images engages reward circuitry, using event-related functional magnetic resonance imaging (fMRI) during viewing of art and non-art images matched for content. Subjects made animacy judgments in response to each image. Relative to non-art images, art images activated, on both subject- and item-wise analyses, reward-related regions: the ventral striatum, hypothalamus and orbitofrontal cortex. Neither response times nor ratings of familiarity or esthetic preference for art images correlated significantly with activity that was selective for art images, suggesting that these variables were not responsible for the art-selective activations. Investigation of effective connectivity, using time-varying, wavelet-based, correlation-purged Granger causality analyses, further showed that the ventral striatum was driven by visual cortical regions when viewing art images but not non-art images, and was not driven by regions that correlated with esthetic preference for either art or non -art images. These findings are consistent with our hypothesis, leading us to propose that the appeal of visual art involves activation of reward circuitry based on artistic status alone and independently of its hedonic value.
Keywords: fMRI, esthetic preference, effective connectivity, Granger causality
1. Introduction
Neuroesthetics, the study of brain responses to the perception of beauty, is a relatively new field which thus far has mainly concentrated on esthetic judgment and preference in relation to art stimuli (reviewed by Di Dio & Gallese, 2009). The experience of art in whatever form has long been characterized as pleasurable both to the senses and to the intellect (Dutton, 2009). It is therefore reasonable to expect that part of the neural response to art should reflect the rewarding aspects of this experience by activating the reward circuit. This circuit consists of the ventral striatum (VS), a region that includes the nucleus accumbens and extends into the ventromedial putamen and caudate (Yacubian et al., 2007), along with the interconnected medial prefrontal and orbitofrontal cortex (OFC), the amygdala and dopaminergic midbrain nuclei (O Doherty, 2004). The VS is considered a key node of the reward circuit (Yacubian et al., 2007; Heekeren et al., 2007;O Doherty, 2004). Note that the commonly used term “reward circuit” does not necessarily imply that the associated pathways functio n exclusively to signal hedonic values; in fact, a key function of this circuit is reinforcement of particular behavioral outcomes under conditions of uncertainty (Schultz, 2006).
Previous neuroimaging studies of responses to visual art have reported activity in regions associated with reward processing: the medial OFC bilaterally (Kawabata & Zeki, 2004; Kirk, 2008; Kirk et al., 2009a,b), the right amygdala (Di Dio et al., 2007) and the left VS (Kirk et al., 2009b). The OFC was activated by art images judged beautiful compared to those judged ugly (Kawabata & Zeki, 2004); its activation correlated with esthetic ratings (Kirk, 2008) and was modulated by context (Kirk et al., 2009b). Further, OFC activity during esthetic judgments of buildings was modulated by architectural expertise (Kirk et al., 2009a). When images of sculptures were viewed by non -experts, images judged beautiful selectively activated the right amygdala, relative to those judged ugly (Di Dio et al., 2007). Left VS activity during viewing of buildings and faces showed a non-linear relationship, independent of architectural expertise, with maximal responses for extreme values of esthetic judgments regardless of valence (Kirk et al., 2009b). Activity in the right caudate nucleus decreased with decreasing esthetic preference for viewed art images (Vartanian & Goel, 2004); note that this activity was in the dorsal striatum, which is less consistently reported to be recruited during reward processing, though it may be involved in reward-associated learning (O Doherty, 2004).
Esthetic preference is clearly an important aspect of the human response to visual art. Not surprisingly, then, it has been the primary focus of earlier neuroimaging studies of responses to visual art. These studies investigated the neural correlates of esthetic preference (Kawabata & Zeki, 2004; Cela-Conde et al., 2004; Vartanian & Goel, 2004; Di Dio et al., 2007), gender differences in esthetic preference (Cela-Conde et al., 2009), and contextual effects on esthetic experience (Lengger et al., 2007; Kirk, 2008; Kirk et al., 2009a). However, esthetic preference is not confined to art and can be expressed about a range of stimuli. Furthermore, it is perhaps not surprising that esthetically pleasing images activate reward circuitry. A related problem is how to define esthetic preference. Several studies use ratings of beauty as a proxy for it (Kawabata & Zeki, 2004; Cela-Conde et al., 2004, 2009), but esthetic preference is unlikely to be a unitary phenomenon and may involve sensorimotor, cognitive, and emotional elements (Di Dio & Gallese, 2009; Leder et al., 2004). Lengger et al. (2007), for example, had participants rate images for how interesting and pleasing they found them, their understanding of the images, and the images ability to evoke emotions and associations, all of which were considered to contribute to esthetic experience. It is important to note that these elements may conflict and yet be consistent with identifying an image as art (Dutton, 2009). For instance, an atheist might appreciate the formal beauty of Dali s Crucifixion but remain unmoved by its associations whilst a religious person might feel the reverse: both might nonetheless agree that it is a work of art. Thus, while studies of esthetic preference are clearly highly relevant to art, they may not reveal processes that are unique to art; indeed, the study implicating the left VS (Kirk et al., 2009b) did not actually use art images.
An alternative viewpoint is suggested by recent research describing the art infusion effect, in which consumers evaluated products more favorably when associated with art images incorporated into packaging, advertisements, or the products themselves, than when associated with control images that depicted the same content but which were not classified as art (Hagtvedt & Patrick, 2008). Since the art and control images were matched for content, the art infusion effect seems to depend on the perceived status of an image as art, rather than the content depicted. This suggests that recognition of an image as art is enough to influence behavior. The effect is posited to arise from a content-independent transfer of art-associated perceptions of luxury and intrinsic worth to the product with which the art is associated (Hagtvedt & Patrick, 2008). The neural basis for the art infusion effect is unknown but a neuroeconomic perspective is helpful here: stimuli that signify wealth, such as sports and luxury cars, activate the VS (Erk et al., 2002; Schaefer & Rotte, 2007); VS activity correlates with product preference and predicts purchasing decisions (Knutson et al., 2007); and the rate of activity change over successive trials at some foci in the striatum (both dorsal and ventral) and midbrain correlates with the marginal utility (decrease in the subjective value of gains as one s assets increase) of monetary gain (Tobler et al., 2007). From the point of view of neural responses to art, we therefore hypothesized that art images would activate reward circuitry and, in particular the VS, simply by virtue of their status as art, independently of their content and particular style, which we controlled for by comparing responses to matched art and non-art images, and by drawing art images from a number of periods and genres.
None of the prior studies reviewed above addressed neural responses that can be isolated to the perceived status of images as art. In some studies, the control stimuli were non-art images but were not matched to the art images in terms of content (Cela-Conde et al., 2004, 2009). Others employed only art images of varying genres: representational and abstract art (Vartanian & Goel, 2004; Lengger et al., 2007; Fairhall & Ishai, 2007); abstract art alone (Kirk et al., 2009a); photographs of sculptures (Di Dio et al., 2007); or portraits, landscapes, still-life and abstract art (Kawabata & Zeki, 2004). Yet another study compared esthetic judgments for buildings and faces (Kirk et al., 2009b). Two studies compared art images to modified versions of the same images: photographs of sculptures with altered proportions (Di Dio et al., 2007) and paintings in which a single element had been transposed (Vartanian & Goel, 2004). Although the control images in these last two studies were matched to the corresponding art images for content, the control images were still recognizable as art. Here, we performed an event-related functional magnetic resonance imaging (fMRI) study to test our hypothesis that viewing visual art is intrinsically rewarding. By contrasting neural responses to art images with responses to control non-art images that were matched for content, we aimed to isolate responses attributable to the status of the image as art. If visual art is intrinsically rewarding, we expected that this contrast would reveal activity in the reward centers of the brain and, in particular, the VS. This approach can be considered as orthogonal to prior approaches exploring the neural correlates of esthetic preference.
In addition to the usual analyses treating subjects as a random factor, which enable generalization of the findings to subjects not included in the study, we also conducted an analysis treating items as a random factor in order to permit generalization of the findings to items not included in the study (Bedny et al., 2007). Such item analysis is almost absent from fMRI research (Bedny et al., 2007) and this methodological step represents an advance on previous imaging studies of responses to art. In the present context, together with the matching of art images to their controls, i t allowed us to test specifically whether the observed activations are attributable to the artistic status of images, regardless of their genre and content. In order to rule out alternative hypotheses for the occurrence of art-selective activations, we examined correlations between fMRI responses and a number of behavioral variables: response time, familiarity ratings and ratings of esthetic preference. Finally, we also conducted effective connectivity analyses to obtain converging evidence for the involvement of ventral striatal connectivity during viewing of art images, as opposed to non-art images. Such analyses have not previously been reported in neuroimaging studies of visual art. A preliminary report of some of the findings has been presented (Sathian et al., 2008).
2. Methods
2.1 Participants
Eight people (four male, four female; mean age 23 years, 1 month), naïve to the hypothesis and with no formal art education, took part. All were right-handed based on the validated subset of the Edinburgh handedness inventory (Raczkowski, Kalat & Nebes, 1974). Informed consent was obtained and all procedures were approved by the Emory University Institutional Review Board.
2.2 Stimuli
Fifty art images representing a variety of artistic styles and time periods were selected by one of the authors (HH), an art historian. Although there are numerous definitions of art (Wartenberg, 2006), we relied on a conceptualization of art as that which viewers categorize as such (Dewey, 1989; Bourdieu & Darbel, 1997). While most of the images selected would not be familiar to a lay audience, they were all selected to be easily recognizable as works of art. The artworks chosen conformed to the guidelines that the works would be “perceived as skillful and creative expressions of human experience, in which the manner of creation is not primarily driven by any other function” (Hagtvedt & Patrick, 2008, p 380). The final selection is listed in Appendix A. The next step was to identify non-art images that were matched for content with the art images. Through an iterative process of searching for suitable images in online photo-libraries, we identified multiple potential controls for each art image and selected the one that was the closest match to the art image in terms of content depicted and the spatial layout of the elements in the image (Figure 1). The resulting non-art images were all photographs while all the art images were paintings or drawings. We were careful to select ordinary photographs, i.e., not work by art photographers and, as detailed later, we performed additional psychophysical testing to confirm that participants agreed with the experimenters classification of these images as art or non-art. Since Cela-Conde et al. (2004) found no differences in activations for esthetic judgments between paintings and photographs (see also Zaidel, 2005), the critical difference between our art and non-art images was artistic status, rather than the medium (photographs vs. paintings/drawings).
Figure 1.

Examples of animate (left pair) and inanimate (right pair) art (a1, a2) and non-art (b1, b2) images.
We then carried out two pilot tests (n = 10), with different participants from those who took part in the main study, to verify that the images were easily classified as art or non-art and that the images were matched for content. In the first pilot test, images were centrally presented on a computer screen, in pseudorandom order so that an art image and its non-art counterpart were never presented consecutively, and participants answered the question Would you consider this image to be a work of art?, rating their responses on a five-point scale where 1 = not at all and 5 = definitely. Art images were rated significantly more highly than non-art images (art: 4.74 ± .06 (mean ± sem); non-art:1.57 ± .08; t9 = 29.9, p < .001). In the second pilot test (with the same participants as the first), each art image and its non-art counterpart were presented side by side on a computer screen and participants answered the question How similar are these images?, again using a five-point scale where 1 = not at all and 5 = extremely. Participants were instructed to assess similarity in terms of what was depicted (i.e., content) rather than how it was depicted (i.e., painting, photograph, sketch, art or not art). Compared to the mid-point of the rating scale (2.5), the matched pairs were rated as highly similar (4.39 ± .14) (t9 = 13.7, p < .001). We tested against the mid-point of the scale because the mid-point represents a point at which images are not clearly similar/dissimilar, and thus serves as a suitable reference point to give meaning to the observed ratings. Thus, these pilot tests showed that the art images were readily identified as works of art while the non-art images were classified as non-art, and that the matched art/non-art pairs were highly similar in content. In the final stimulus set for the main study, we classified 28 image pairs as depicting animate content and 22 pairs as depicting inanimate content (see below and Figure 1).
2.3 Functional imaging and post-scan testing
Participants lay supine in the MR scanner, with foam blocks positioned around the head to minimize movement. A mirror angled over the head coil enabled participants to see the images and a centrally placed fixation cross projected on a screen placed in the rear magnet aperture. Participants were instructed to keep their eyes open, that they would see a series of images and that they were to decide whether the main content in each image was animate or inanimate; when no image was present they were instructed to fix their gaze on the cross. We chose this task as it was orthogonal to the art/non-art contrast. We specifically did not require participants to make esthetic judgments of each image (see below for rationale). A fiberoptic response box was held in the right hand; the second and third fingers were used to press buttons indicating animacy judgments. Participants wore headphones that attenuated external sounds by 20 dB to muffle scanner noise. Each participant completed 2 runs in a single scan session. Each run consisted of 50 trials of 2s duration, with a fixed interval of 8s between the end of one trial and the start of the next, in a slow event-related design. In each trial, an image was presented for 1s, followed by a 1s response period; half the trials were art images and half were non-art images. The stimulus presentation time of 1s is somewhat shorter than in other fMRI studies where presentation times have ranged from 2s (Kawabata & Zeki, 2004) to 6s (Vartanian & Goel, 2004). However, these earlier studies required participants to rate esthetic preference on a scale rather than the binary animate/inanimate decision required here. Since we were interested in the neural basis of the art infusion effect, which is apparent with only brief or incidental exposure to art images (Hagtvedt & Patrick, 2008), our choice of stimulus parameters was intended to approximate the conditions under which the art infusion effect was originally obtained. The two trial types were interleaved in a pseudorandom order within each run so that an art image and its non-art counterpart were never presented consecutively, and the order of the two runs was counterbalanced across participants. There were six 10s baseline periods of fixation without stimulation, one at the beginning and end of each run and four at pseudorandom intervals during each run. The stimuli were presented, and responses recorded, using Presentation software (Neurobehavioral Systems Inc., Albany, California).
Immediately after the scanning session, participants viewed the images again. As was done during pilot testing (in different subjects), they were shown the images presented during scanning, but, instead of rating how strongly they classified each image as art, they classified each image as either art or non-art and answered the additional question How familiar are you with this particular image? (rating responses on a five-point scale where 1 = not at all familiar and 5 = extremely familiar). They also carried out the similarity rating task for paired art and control images, just as in the pilot test. Both post-scan tests were presented in the same session, in counterbalanced order across participants. On later dates, participants completed three questionnaires that tested aspects of esthetic preference. The same images seen during scanning were presented again and participants answered one of the following questions How beautiful is this image?, How much do you like this image? and How esthetically pleasing is this image? (rating responses to each question on a five-point scale). The order in which these questionnaires were completed was counterbalanced; each was completed on a different day with at least a day s separation between one questionnaire and another.
2.4 MR scanning
MR scans were performed on a 3 Tesla Siemens Trio whole body scanner (Siemens Medical Solutions, Malvern, PA), using a twelve-channel matrix head coil. T2*-weighted functional images were acquired using a single-shot gradient-recalled echoplanar imaging (EPI) sequence for blood oxygenation level-dependent (BOLD) contrast. These functional scans acquired 29 axial slices of 4mm thickness using the following parameters: repetition time (TR) 2000ms, echo time (TE) 30ms, field of view (FOV) 220mm, flip angle (FA) 90°, in-plane resolution 3.4×3.4mm, and in-plane matrix 64×64. High-resolution 3D anatomic images were acquired using an MPRAGE sequence (TR 2300ms, TE 3.9ms, inversion time 1100ms, FA 8°) comprising 176 sagittal slices of 1mm thickness (FOV 256mm, in-plane resolution 1×1mm, in-plane matrix 256×256). Once magnetic stabilization was achieved in each run, the scanner triggered the computer running the Presentation software so that the sequence of experimental trials was synchronized with scan acquisition.
2.5 Image processing and analysis
Image processing and analysis was performed using BrainVoyager QX v1.10.3 (Brain Innovation, Maastricht, Netherlands). Each subject’s functional runs were real-time motion-corrected utilizing Siemens 3D-PACE (prospective acquisition motion correction). Functional images were preprocessed utilizing sinc interpolation for slice scan time correction, trilinear-sinc interpolation for intra-session alignment of functional volumes, and high-pass temporal filtering to 3 cycles per run to remove slow drifts in the data. Anatomic 3D images were processed, co-registered with the functional data, and transformed into Talairach space (Talairach & Tournoux, 1988). Activations were localized with respect to 3D cortical anatomy with the help of an MRI atlas (Duvernoy, 1999). For group analysis, the transformed data were spatially smoothed with an isotropic Gaussian kernel (full-width half-maximum 4mm).
2.6 Statistical analyses of imaging data
For analysis of imaging data, runs were percent signal change normalized (i.e., the mean signal value for each voxel’s time course was transformed to a value of 100, so that the individual values fluctuated around that mean as percent signal deviations.) Statistical analysis of group data used random-effects, general linear models (GLM) followed by pairwise contrasts (art > non-art).
In subject-wise analyses, “subject” was treated as a random factor, averaging responses across items of each class to arrive at a single contrast estimate for each subject. This is now standard practice in neuroimaging, allowing generalization of the results to other individuals. However, in order to also allow generalization to items other than those used, it is necessary to conduct another analysis in which “item” is treated as a random factor (Clark, 1973). Implementing the technique described by Bedny et al. (2007), all stimuli (50 art images, 50 non-art images) were itemized by building a stimulation protocol in which each trial was identified as a discrete condition (art image 1, art image 2….art image 50; non-art image 1, non-art image 2….non-art image 50). Items were appropriately numbered to facilitate pairing of each art image to its non-art control image. A multi-subject random-effects general linear model (GLM) with z-transformation was employed to create “standardized” beta maps. Fifty “itemized-pair” (art > non-art) beta maps were specified, and a 1-sample t-test was performed on these “differences”. This equates to performing a paired t-test on data averaged across subjects for each item. Activations were considered significant only if they were present on both the subject-wise and item-wise analyses, enabling generalization of the results beyond the specific subjects scanned and specific items used (Bedny et al., 2007).
In order to test our primary a priori hypothesis that viewing art images, relative to their non-art controls, activates the VS, we generated bilateral VS regions of interest (ROIs) based on the study of Yacubian et al. (2007) that examined activity during processing of reward probability and reward magnitude. We chose this study as it included 98 subjects: this was the largest number of subjects taking part in a single study of reward processing in the VS that we were able to find, and was thus likely to have yielded the most reliable localization. The ROIs were cubes of 20mm side, centered halfway between the average coordinates of the peak voxels for reward probability and reward magnitude. The Talairach coordinates of these ROI centers were at 10, 12, −2 and −12, 9, −1. In addition to the ROIs, we also searched for activations in the whole brain. Corrections for multiple comparisons (corrected p<.05) were achieved by imposing a threshold for the volume of clusters comprising contiguous voxels (anatomic dimensions, 1×1×1mm) that passed a voxel-wise threshold of p<.05, using a 3D extension (implemented in BrainVoyager QX) of the 2D Monte Carlo simulation procedure described by Forman et al. (1995). The resulting cluster-size threshold was 28 voxels for the subject-wise analysis and 23 voxels for the item-wise analysis. Whole-brain corrections were performed within a functionally defined mask comprising all voxels active (p<0.05, uncorrected, fixed-effects analysis) for either art or non-art images relative to baseline. For the VS, small-volume corrections were performed within the ROIs defined as above, with a cluster-size threshold of 13 voxels for both subject- and item-wise analyses.
Because differences emerged between art and non-art images for ratings of esthetic preference and familiarity, and response times on the animacy task, the ANCOVA option in BrainVoyager was used to test for voxels showing significant correlations between their activation magnitude and item familiarity/response time/esthetic preference ratings. These analyses were performed in an item-wise manner, analogous to that described for the item analysis above, separately for the sets of art and non-art images and also on the entire set of 100 images. We set a threshold r-value of .4, which is equivalent to a moderate correlation (Guilford, 1965). The resulting r-maps were corrected for multiple comparisons as above (corrected p<.05), but without application of a mask, in order to search for correlations in the whole brain. The rationale for this is that correlations could be found in regions with high enough variance between individuals that they do not show activations on the group map.
2.7 Effective connectivity
Effective connectivity was assessed using Granger causality analysis (GCA), which can be used to infer causality between two time series by cross-prediction – if future values of time series y(t) can be predicted from past values of time series x(t), then x(t) can be said to have a causal influence on y(t) (Granger, 1969). This approach has been applied to the time series of BOLD signal intensities from selected ROIs in order to assess effective connectivity (Roebroeck et al., 2005; Stilla et al., 2007, 2008; Deshpande et al., 2008, 2009b, 2010a; Chen et al., 2009; Marinazzo et al., 2010). While GCA is often used in a bivariate manner using a given ROI as a seed to investigate its inputs and outputs (Roebroeck et al., 2005; Chen et al., 2009; Marinazzo et al., 2010), our group has reported applications of a multivariate implementation of GCA to fMRI data (Stilla et al., 2007, 2008; Deshpande et al., 2008, 2010a), including task-specific analyses (Deshpande et al., 2010a). Where this multivariate approach requires a large number of candidate ROIs, e.g., when selected in a data-driven manner, the resulting connectivity network can be simplified using a recursive network reduction method that eliminates ROIs that do not contribute significantly to overall connectivity, thus aiding interpretation (Deshpande et al., 2008). Because the temporal resolution of BOLD time series data is poor, being constrained by the TR, such time-lagged analyses are susceptible to zero-lag correlations leaking into the connectivity estimates (Deshpande et al., 2009b). This can be resolved by modeling the zero-lag effects and excluding them from the computation of causal influences; we call this correlation-purged Granger causality (CPGC) (Deshpande et al., 2009b, 2010a).
Our previous applications of GCA were all in block design studies (Stilla et al., 2007, 2008; Deshpande et al., 2008, 2010a). The use of an event-related design in the present study presents additional complications for GCA, owing to the limited number of time points for each event. Thus, we performed a temporally adaptive CPGC analysis for every run and every subject, using a first-order, multivariate, vector autoregressive (mVAR) model and discrete wavelet transforms (see Appendix B for details). Each run was modeled using a single-wavelet mVAR model, without any assumptions about timing or shape of responses on individual trials. It was verified that the number of functions in the wavelet expansion was large enough so that the smoothness of connectivity variation would match that of the HRF-convolved experimental paradigm, i.e., the frequency spectrum of the wavelet basis included the frequencies of interest in the evoked BOLD signal. The boxcar function corresponding to the experimental paradigm was smoothed by a standard hemodynamic response function (HRF) and entered into the design matrix. Using a fixed-effects general linear model, considering temporally-varying CPGC as the response variable and the HRF-convolved paradigm as the predictor variable, the paths which significantly (p<0.05, Bonferroni-corrected) covaried with the experimental paradigm were determined, to yield task-specific patterns of effective connectivity (art and non-art). The advantage of this approach is that it does not suffer from the lack of sufficient time points per event that can limit application of traditional GCA to event-related paradigms. Also, this approach formulates connectivity investigation within the methodological framework used for “activity detection”, which makes it easier to interpret the relationship between activity and connectivity.
Selection of ROIs
ROIs for GCA were selected in a data-driven manner to investigate interconnections between regions that were selectively active during the viewing of art images. To this end, regions significantly active on the art > non-art contrast were included. In order to rule out the hypothesis that the VS was driven by regions exhibiting correlations between their activity and ratings of esthetic preference, those regions were also included. Where there were multiple “hot spots” within an ROI, or when the same region was correlated with different ratings, the focus with the highest t-max was chosen. Because of the large number of ROIs, we analyzed the connectivity for each hemisphere separately and also ran the network reduction procedure cited above (Deshpande et al., 2008). ROIs were based on the center of gravity of activations and restricted to be no larger than 125mm3 (5×5×5mm cube). For each ROI, the time series was based on the t-weighted spatial average of activity over that ROI. The resulting data was normalized across runs and subjects before being entered into the GCA procedures.
3. Results
3.1 Behavior
Repeated-measures ANOVAs showed no significant differences in animacy judgments between either art (90.0 ± 3.5% correct (mean ± sem)) and non-art (96.6 ± 1.0% correct) images (F1,7 = 4.6, p = .07), or animate (91.3 ± 3.2% correct) and inanimate (95.3 ± 1.3% correct) images (F 1,7 = 2.3, p = .17). Participants were significantly slower in making animacy judgments (t7 = 5.9, p = .001) for art images (.97 ± .08s) than non-art images (.89 ± .08s) but did not differ significantly in response times for animate and inanimate images (t7 = −1.7, p = .13).
In immediate post-scan testing, participants showed good (88.3 ± 2.6%) agreement with the experimenters classification of images as art or non-art, significantly higher than chance (t7 = 14.5, p < .001). Similarity ratings for the matched art/non-art pairs were significantly higher than the mid-point of the scale (2.5) for both animate (3.27 ± .16, t 7 = 4.8, p = .002) and inanimate (3.53 ± .24, t7 = 4.4, p = .003) pairs, without a significant difference between animate and inanimate pairs (t7 = −2.2, p = .06). Compared to the mid-point of the scale (2.5), non-art images were rated as unfamiliar (1.52 ± .26, t7 = −3.7, p = .007). Art images were not rated as highly familiar, since their mean rating (2.61 ± .28) was not significantly different from the mid-point of the scale (t7 = .4, p = .72). However, art images were rated as more familiar than non-art images (t7 = 5.4, p = .001). (As for the pilots, we tested against the mid-points of the scales, representing points at which images are not clearly familiar/unfamiliar or similar/dissimilar and thus suitable as reference points to give meaning to the observed ratings).
Participants liked art images more than non-art images (art 3.49 ± .09; non-art 2.91 ± .07; t7 = 4.9, p = .002) and also rated them as more beautiful (art 3.51 ± .1; non-art 2.81 ± .1; t7 = 4.5, p = .003). Ratings of esthetic pleasing were not significantly different between art and non-art (art 3.18 ± .2; 2.93 ± .1; t7 = .9, p = .4). However, one participant s response on this last rating appeared to be an outlier; when this person s data was excluded, there was a significant effect of image type (art 3.38 ± .1, non-art 2.89 ± .1, t6 = 3.2, p = .02). Correlations between the three rating scores for art and non-art images showed, unsurprisingly, that art images considered beautiful were also liked (r = .8, p = .01); however, there were no other significant correlations. This suggests that responses to one questionnaire did not necessarily influence responses to another and that these aspects of esthetic experience were independent for non-art images while, for art images, esthetic pleasure was independent of the other two ratings.
3.2 Activations
Our primary a priori hypothesis was that viewing art images, compared to non-art images, would activate the VS. Figure 2a shows, in red and green respectively, voxels in the VS that were more strongly activated for art compared to non-art images, on the analyses treating subject and item, respectively, as random factors. Voxels identified as art-selective on both subject- and item-wise analyses are shown in tan; the VS ROIs are outlined in light blue. The subject-wise analyses survived small-volume corrections for multiple comparisons within these ROIs bilaterally; the item-wise analyses survived correction on the left but not the right.
Figure 2.
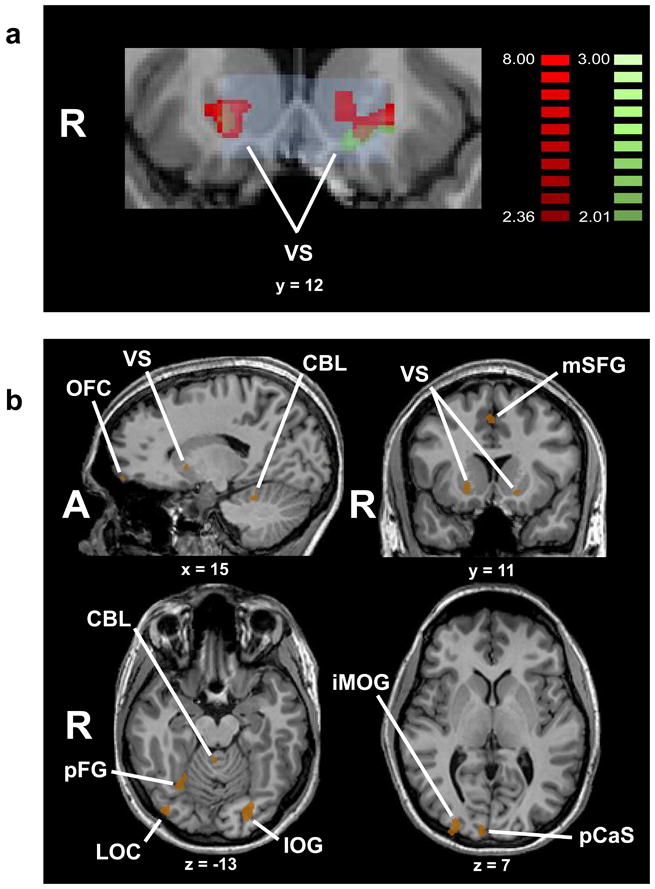
(a) Art-selective activations in the ventral striatum (VS). VS regions of interest (ROIs) shown in light blue; voxels identified on subject-wise analysis shown in red (small-volume corrected for multiple comparisons within both VS ROIs); voxels identified on item -wise analysis shown in green (small-volume corrected for multiple comparisons within left VS ROI; activation in right VS ROI did not survive correction for multiple comparisons); overlap of subject- and item-wise analyses shown in tan. Color t scales on right of figure. (b) Activations common to both subject-wise and item-wise analyses of the art > non-art contrast shown in tan. Activations outside the VS are corrected for multiple comparisons. Talairach plane is given below each slice. See list for abbreviations.
Because of the small sample size, we carried out several checks to confirm that the VS activity was robust. Firstly, the primary analyses were conducted in a random-effects manner, treating subjects as a random factor for the subject-wise analyses and item as a random factor for the item-wise analyses. In addition, we verified VS activity on an individual basis and confirmed that this was present in all 8 subjects individually on the left, and in 7 of 8 on the right (Table 1). We also calculated the effect sizes and confidence intervals for the VS activations by extracting the baseline-referenced z-transformed beta weights for each VS ROI in each condition for each participant. This subject-wise analysis showed that Cohen s d was 1.18 (95% confidence interval [CI] .94 – 1.33) for the right VS and 1.08 (95% CI .81 – 1.37) for the left VS. On item-wise analysis, Cohen s d was .48 (95% CI .27 – .7) for the right VS and .64 (95% CI .43 – .86) for the left VS. Thus there is a large subject-wise effect and at least a medium item-wise effect in the VS, both with narrow confidence intervals that are clearly distinct from zero. A major concern with small samples is their association with wide confidence intervals that can result in spuriously large effect size estimates. Verifying that the effect sizes here were associated with relatively narrow confidence intervals that are clearly far from zero, on both subject- and item-wise analyses, provides reasonable assurance that they are robust. Overall, these data support the hypothesis that art images selectively recruit VS activity.
Table 1.
Activations common to both subject-wise and item-wise analyses on the art > non-art contrast. Activations outside the ventral striatum are corrected for multiple comparisons in both analyses; x,y,z = Talairach coordinates; tmax = peak t value. Cluster size = number of activated voxels in region. Verified = number of individual subjects (total = 8) in whom activation was verified (p < .05 uncorrected). See list for abbreviations.
| Region | x | y | z | Subject-wise tmax | Item-wise tmax | Cluster size | Verified |
|---|---|---|---|---|---|---|---|
| R VS | 17 | 12 | 1 | 3.8 | 2.6 | 131 | 7 |
| L VS | −16 | 14 | −2 | 4.2 | 2.6 | 103 | 8 |
| L mSFG | 0 | 16 | 44 | 5.1 | 3.0 | 883 | 7 |
| R IFS | 40 | 27 | 30 | 3.6 | 3.5 | 757 | 7 |
| R OFC | 16 | 56 | −5 | 4.9 | 3.6 | 32 | 7 |
| R hypoth | 5 | −21 | −1 | 4.0 | 3.1 | 226 | 6 |
| L hypoth | −5 | −19 | −1 | 5.2 | 3.4 | 659 | 7 |
| R iMOG | 27 | −89 | 5 | 4.9 | 2.9 | 502 | 8 |
| L IOG | −23 | −78 | −16 | 5.1 | 3.2 | 687 | 8 |
| R pCaS | 8 | −93 | 7 | 2.8 | 3.2 | 185 | 8 |
| L pCaS | −16 | −87 | −7 | 3.7 | 3.8 | 781 | 8 |
| R FG | 27 | −59 | −13 | 6.5 | 3.6 | 329 | 7 |
| R LOC | 38 | −79 | −12 | 3.7 | 2.5 | 219 | 6 |
| R CBL | 7 | −42 | −17 | 5.1 | 2.9 | 480 | 7 |
| L CBL | −14 | −49 | −27 | 5.7 | 3.7 | 394 | 8 |
Table 1 lists details of activations common to both the subject- and item-wise analyses. All the activations outside the VS survived correction for multiple comparisons. These additional activations selective for art images were located in right medial OFC, bilateral hypothalamus, prefrontal cortex, multiple regions of visual cortex, and bilateral cerebellum. The prefrontal activations were in the right inferior frontal sulcus (IFS) and medial superior frontal gyrus (mSFG). Figure 2b illustrates some of the activations, while activation time-courses at selected foci, including those in the VS, are shown in Figure 3. Because some of these cortical areas, particularly the OFC, are close to sinuses they are potentially susceptible to signal drop-out (Li et al., 1996). We therefore verified the existence of all activations in individual subjects. Table 1 shows that each of the activations, including those in the OFC, was present in 6 or more of our 8 participants.
Figure 3.

Time-courses of BOLD signal change in representative regions common to the subject- and item-wise analyses for the art > non-art contrast. Error bars: SEM. See list for abbreviations.
3.3 Correlations with esthetic preference
To test the possibility that the art-selective activations arose from differential esthetic preference for art compared to non-art images, we computed r-maps reflecting the item-wise correlation of the esthetically pleasing, beauty and like ratings with voxel activation magnitudes (relative to baseline), for art and non-art conditions separately. The resulting regions, shown in Figures 4 and 5 and listed in Table 2, were entirely independent of the art-selective regions in Table 1 with the exception of a minimal (3 voxels) overlap in the right lateral occipital complex for the correlation of like ratings with activation magnitude for art images. When the r-maps were computed for these ratings across the entire set of 100 images, the correlated regions were reduced to three foci in the fusiform gyrus that were independent of the art-selective activations (Supplementary Table 1). We also tested for correlations within the two VS ROIs with a small volume correction, i.e., at the same threshold that the main hypothesis was tested (see 3.2 above). For the esthetically pleasing and beauty ratings, there were no correlated voxels for the art and non-art images separately, or for the complete 100 image set. For the like ratings, there was a small correlated region (2 voxels) for art images in the right VS (x,y,z: 1, 21, 2; r-max = .5), overlapping with the subject-wise art-selective activation only and actually located in the inferior part of the anterior cingulate gyrus rather than the VS per se. There were no correlated regions for non-art images or for the complete 100 image set. Thus we conclude that the art-selective activations did not reflect differences in participants esthetic experience of the art and non-art images.
Figure 4.
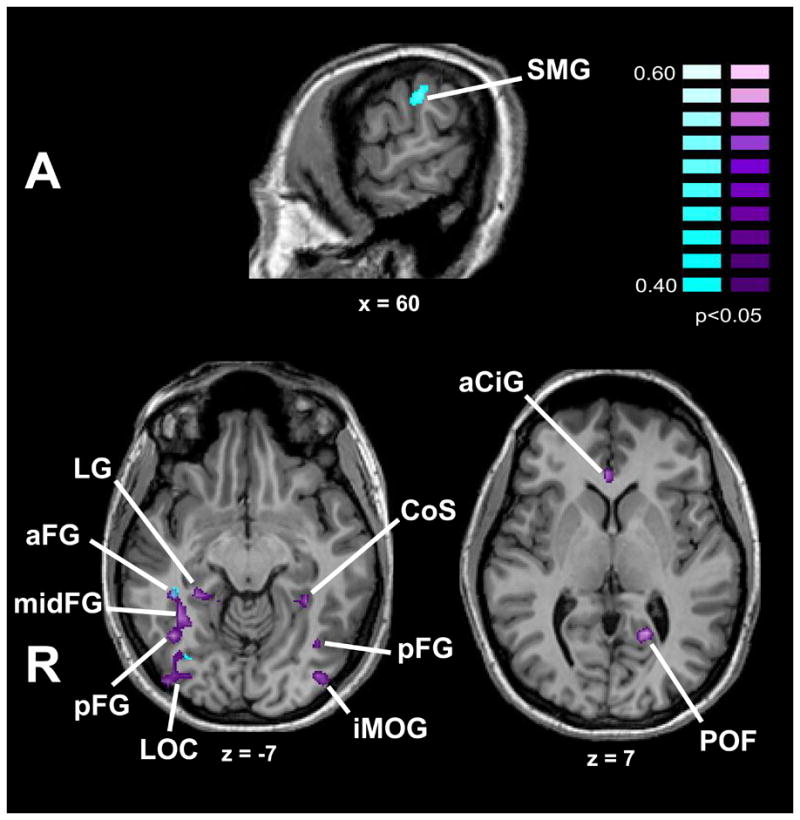
r-map showing regions with item-wise correlation of activation magnitude with esthetic preference ratings (turquoise = “how beautiful is this image?”, purple = “how much do you like this image?”) for art images, corrected for multiple comparisons. See list for abbreviations.
Figure 5.
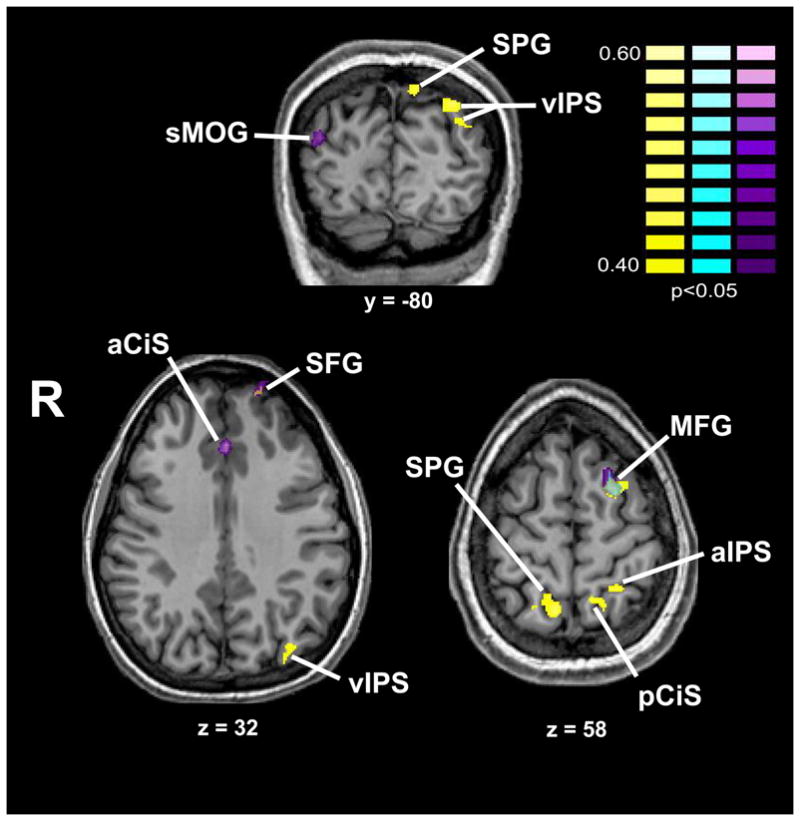
r-map showing regions with item-wise correlation of activation magnitude with esthetic preference ratings (turquoise and purple as for Figure 4, yellow = “how esthetically pleasing is this image?”) for non-art images, corrected for multiple comparisons. See list for abbreviations.
Table 2.
Regions where activation magnitudes showed correlations with three esthetic preference ratings for art and non-art images; x,y,z = Talairach coordinates; rmax = peak r value. See list for abbreviations.
| Questionnaire: | How esthetically pleasing is this image? | How beautiful is this image? | How much do you like this image? | ||||||||||||
|---|---|---|---|---|---|---|---|---|---|---|---|---|---|---|---|
| Image type | Region | x | y | z | rmax | Region | x | y | z | rmax | Region | x | y | z | rmax |
| Art | No correlated regions | R SMG | 60 | −33 | 34 | .5 | R aCiS | 3 | 25 | 5 | .51 | ||||
| R LOC | 34 | −73 | −4 | .46 | R LOC *† | 37 | −76 | −5 | .51 | ||||||
| R CoS | 32 | −50 | −11 | .54 | R aFG | 38 | −38 | −9 | .58 | ||||||
| R FG† | 34 | −41 | −15 | .56 | R mid FG | 34 | −48 | −8 | .58 | ||||||
| R pFG | 39 | −57 | −6 | .53 | |||||||||||
| R LG | 24 | −36 | −6 | .5 | |||||||||||
| L POF | −16 | −55 | 9 | .56 | |||||||||||
| L CoS | −27 | −42 | −5 | .53 | |||||||||||
| L aFG | −37 | −43 | −17 | .51 | |||||||||||
| L pFG | −36 | −61 | −9 | .48 | |||||||||||
| L iMOG | −38 | −80 | −10 | .57 | |||||||||||
| L amyg | −23 | 2 | −16 | .52 | |||||||||||
| Non-art | R SPG | 12 | −54 | 59 | .51 | L MFG | −20 | 7 | 56 | .51 | L aCiS | 0 | 29 | 34 | .53 |
| L MFG† | −21 | 7 | 55 | .54 | R sMOG | 41 | −78 | 22 | .48 | ||||||
| L aIPS | −18 | −50 | 62 | .48 | L MFG† | −19 | 8 | 56 | .55 | ||||||
| L pCiS | −9 | −50 | 55 | .47 | L SFG | −16 | 59 | 35 | .57 | ||||||
| L SPG | −8 | −73 | 48 | .55 | |||||||||||
| L vIPS | −29 | −80 | 37 | .54 | |||||||||||
| L SFG† | −16 | 58 | 37 | .56 | |||||||||||
3 voxels in this region overlapped with the region common to subject- and item-wise analyses (Table 1).
These regions were excluded from the effective connectivity analysis as they were duplicated in other ROI sets.
3.4 Familiarity effects
To rule out the possibility that the art-selective activations were due to the somewhat greater familiarity of art images compared to the non-art images, an r-map was computed, reflecting the item-wise correlation of voxel activation magnitudes in the art condition (relative to baseline) with familiarity ratings. These regions, all in left inferior frontal cortex, were completely independent of the activation map: there was no overlap between the activation map and the r-map (Supplementary Figure 1 and Supplementary Table 2). This indicates that none of the art-selective activations was attributable to greater familiarity of the art images. There were no regions correlated with familiarity ratings for the non-art images, or when the r-map was computed for the entire set of 100 images. As above, we also tested for correlations in the VS ROIs with a small volume correction; there were no significant correlations for art, non-art, or the complete 100 image set. Therefore, we concluded that the art-selective activations did not reflect differential familiarity with the images.
3.5 Response time effects
To rule out the possibility that the art-selective activations were due to longer response times for art images, we computed r-maps reflecting the item-wise correlation of voxel activation magnitudes in the art condition (relative to baseline) with response times for art images. These regions were primarily in prefrontal and visual cortex and, again, constituted a network largely independent of the regions showing selectivity for art images (Supplementary Figure 2 and Supplementary Table 3). The only exception was in the mSFG, where voxels showing significant correlations between activation magnitudes and response times to art images overlapped with art-selective activations. A similar correlational analysis for response times to non-art images revealed a substantially different network in parts of frontal, parietal and inferotemporal visual cortex, again without overlap with the art-selective activations (Supplementary Figure 2 and Supplementary Table 4). Computing the r-map for all 100 images resulted in a smaller set of regions, also independent of the art-selective activations (Supplementary Table 1). As above, we also tested for correlations in the VS ROIs with a small volume correction. In the left VS, there were correlations for both art (Talairach coordinates: −12, 4, 7) and non-art (Talairach coordinates: −13, 11, −5) images; the former comprising 2 voxels that overlapped with the subject-wise activation (but not the item-wise activation or the common region listed in Table 1) while the latter overlapped with the common region in Table 1. In the right VS, there was a correlation for art images (Talairach coordinates: 13, 6, 6), part of which overlapped with the common region in Table 1 and part with the subject-wise activation only, but no correlation for non-art images. When considering the complete 100 image set, there were no correlations in either the right or left VS. Thus, any correlations with response times in the left VS were not specific to the art images; although those in the right VS were, the absence of correlations in the entire image set on either side in the VS suggest that response time effects did not explain art -selective activations in the VS. This is consistent with the fact that the response times were to the animacy task which is orthogonal to any art- or reward-related processing. Thus, even if response time correlations and art-selective activations in the VS are considered co-extensive, any potential response time confound is not necessarily attributable to processing of art or reward per se. We therefore conclude that the art-selective activations could not be explained by the longer response times to the art images.
3.6 Effective connectivity
Temporally adaptive CPGC analysis of effective connectivity showed that, when viewing art images, the VS was driven by art-selective visual cortex, particularly in the right hemisphere, but not by regions that were correlated with esthetic preference – these correlated regions did not show connectivity with the VS for either kind of image (Figures 6 and 7: for the path weights see Supplementary Tables 5–8). When viewing non-art images, the VS was completely disengaged, with neither inputs nor outputs to any other region. Regions showing correlations between activation magnitude and esthetic preference ratings tended to drive visual cortical regions for both art and non-art images. These results further reinforce our conclusion that individual differences in esthetic preference do not account for the art-selective activations.
Figure 6.

Left hemisphere effective connectivity between ventral striatum, art -selective regions (white font) and regions correlated with esthetic preference ratings (blue font) for art (a) and non-art (b) images after network reduction. The pseudocolor code indexes task-specific path weights. See list for abbreviations.
Figure 7.

Right hemisphere effective connectivity between ventral striatum, art -selective regions (white font) and regions correlated with esthetic preference ratings (blue font) for art (a) and non-art (b) images after network reduction. The pseudocolor code indexes task-specific path weights. See list for abbreviations.
4. Discussion
The present study is the first to report activity in reward-related regions of the brain, attributable to the artistic status of viewed images independently of the depicted content and of the particular genre or style. In accordance with our a priori hypothesis, viewing art images activated the VS. This was true in both subject and item analyses, indicating that this finding generalizes to other individuals and art images (Bedny et al., 2007). The VS activation was verified in all participants on the left and in all but one on the right. Effect sizes in bilateral VS were large with relatively narrow 95% confidence intervals that were distinctly separate from zero. Taken together, these results suggest that, despite the small sample size, the VS activity was robust. Since the content and other properties of the paired art and non-art images were chosen to be, and were also rated as, highly similar, the greater activations for art images can be attributed to their status as art. The VS is involved in coding both reward probability and magnitude (Heekeren et al., 2007;O Doherty, 2004; Yacubian et al., 2007). Our VS ROIs were chosen without bias towards reward probability or magnitude, since they were centered on the mid-point between the probability and magnitude peaks identified by Yacubian et al. (2007). The VS foci that were preferentially active during viewing art images were located anteriorly, close to foci shown to encode reward probability, whereas more posterior foci encode reward magnitude (Yacubian et al., 2007). The VS is also involved in computing reward prediction errors (the difference between expected and actual outcomes) in tasks involving decision-making (Hare et al., 2008) or classical conditioning (O Doherty et al., 2003). Our study involved no explicit gain/loss consequences to viewing art or non-art images, and the animacy task on which participants actually made decisions was orthogonal to the artistic status of the stimuli. These considerations tend to argue against the idea that VS activity in the present study reflected prediction error signals; however, we cannot rule out the possibility that unpredictability of the timing of art/non-art images may have led to VS activation.
Art as a rewarding experience
Experiencing art, whether visual or otherwise, is a pleasurable, rewarding experience (Dutton, 2009). The finding that artistic status alone activates reward centers is interesting in the light of recent suggestions (e.g., Zaidel, 2005; Dutton, 2009) that production and appreciation of art may be related to the evolution in humans of mechanisms that were important for survival of the individual and species. It has been suggested that visual artists, consciously or otherwise, have learned to exploit the evolved characteristics of human visual perception (Ramachandran, 2004; Zaidel, 2005). On this account, visual art exploits perceptual processes such as grouping, attention, etc. in order to produce a visually appealing image. While visual appeal might thus be part of the basis for artistic status, it no doubt also contributes to esthetic preference. In this respect, it is interesting to note that the left VS focus observed here was previously reported to be active during esthetic judgments of both buildings and faces, regardless of the architectural expertise of the subjects (Kirk et al., 2009b). By contrast, the right OFC focus in the present study was somewhat lateral to the near -midline activity reported during judgments of beauty (Kawabata & Zeki, 2004) and foci found to be modulated by esthetic preference (Kirk, 2008; Kirk et al., 2009a). However, it still lies within the medial sector of the OFC and within the region associated with encoding predicted reward values (Hare et al., 2008).
Perhaps surprisingly, we did not find activity selective for viewing art images in the amygdala, which is also implicated in reward processing (O Doherty, 2004). However, abstract reward-associated activity is reported less consistently in the amygdala than at other sites such as the VS and OFC (Elliott et al., 2003) and, as pointed out by Nadal et al. (2008), a number of other studies utilizing art images also failed to find amygdala activation (e.g., Kawabata & Zeki, 2004; Vartanian & Goel, 2004; Kirk, 2008; Kirk et al., 2009a). However, a study involving images of sculptures found selective activity in the right amygdala for images judged to be beautiful, compared to those judged to be ugly (Di Dio et al., 2007). By contrast, we did find art-selective activity in the hypothalamus which is not typically considered part of the reward circuit (e.g., O Doherty, 2004) although more recent evidence suggests that hypothalamic orexin neurons are involved in reward-related behavior (Ganjavi & Shapiro, 2007; Hikosaka et al., 2008). It is not clear why there was activation in the mSFG. This activation was in the pre-supplementary motor area; it is relevant to note that viewing art images that were deemed ugly selectively activated primary motor cortex, relative to images deemed beautiful, perhaps as a precursor to action avoiding aversive stimuli (Kawabata and Zeki, 2004). The mSFG also showed a significant correlation across subjects between activation magnitude and response time; this could reflect processing of potential actions that delayed response. Clearly, these ideas require further study.
Art images were rated higher than non-art images on all three esthetic preference questionnaires. However, none of the art-selective activations had an activation magnitude that was correlated with any of the three ratings. Instead, esthetic preference ratings were correlated in regions that were essentially independent of the art-selective activations. This, and the effective connectivity results (see below), reinforce our view that esthetic preference, while important to the experience of art, is not unique to it and thus may not be the sole determinant of reward-related activity in processing of visual art. Esthetic preference is likely a complex phenomenon involving sensorimotor, cognitive and emotional processes (Di Dio & Gallese, 2009; Leder et al., 2004). This complexity is reflected in the nature of the regions exhibiting correlations with esthetic preference ratings. Interestingly, most regions where activity correlated with esthetic preference for art images w ere in extrastriate visual cortex, whereas those showing correlations with esthetic preference for non -art images were in frontoparietal cortex.
The present study is the first to examine effective connectivity in relation to processing of visual art. This analysis showed that the VS was driven by art-selective regions when viewing art images, was disengaged when non-art images were viewed, and was not driven by any region correlated with ratings of esthetic preference. These findings support our hypothesis that the VS responds specifically to the artistic status of the images and argue against the idea that the art -selective activations were associated with esthetic ratings. Further work is necessary to delineate the relationship between the activity and connectivity of the reward circuit reported here and learning, in the context of motivation (Camara et al., 2009).
Art as marketing tool – the ‘art infusion’ effect
The present study was originally motivated by the discovery of the art infusion effect, in which consumers rate products more positively when associated with art images than when associated with non-art images depicting similar content (Hagtvedt & Patrick, 2008). The psychological basis for this was assumed to be a content-independent transfer of perceptions of luxury and intrinsic value from the art image to the product (Hagtvedt & Patrick, 2008). The reward-related activity observed in the present study supports the view that the neural basis of the art infusion effect is a content-independent activation of reward circuitry, deriving from the status of images as art, that presumably induces more favorable evaluation of the product associated with the image. In the original experiments, consumers attention was directed to the product that t hey were required to rate so that perception of the images associated with the product, whether art or not, was not explicit. It is interesting to note that similarly, in the present study, the reward circuit was activated in the absence of explicit rewards: participants made animacy, but not explicit value or affective judgments. This contrasts with other studies in which participants rated the attractiveness of sports cars compared to ordinary cars during scanning (Erk et al., 2002), or imagined owning an d driving luxury/sports cars (Schaefer & Rotte, 2007).
Our understanding of the neural bases of marketing phenomena is still at an early stage (Plassmann et al., 2007; Kenning & Plassmann, 2008). The present study examined responses evoked by images merely by virtue of being art, which is assumed to be the basis of the art infusion effect, but did not explicitly investigate the art infusion effect itself. This could be done in future studies by examining the neural response to art and non-art images when presented with images of products varying in such measures as cost, perceived luxury and so on. As noted in the Introduction, VS responses to financial reward scale with the marginal utility of the reward (Tobler et al., 2007). Our finding of VS activity evoked by visual art thus raises the possibility that the art infusion effect could be used to modify perceived marginal utility.
Familiarity and response time effects
Art images were rated as generally unfamiliar, though somewhat more familiar than non-art images. However, activation magnitudes of the art-selective activations did not correlate significantly with familiarity ratings for either art or non-art images. Instead, familiarity with the art (but not non-art) images correlated with activation strength in a separate network that comprised left inferolateral frontal foci, some of which have previously been implicated in mediating the sense of familiarity in memory retrieval paradigms (Yonelinas et al., 2005). In a recent study, Fairhall & Ishai (2008) showed participants representational, abstract, and indeterminate paintings and asked them to indicate if they recognized any familiar objects within each image. In contrast to our findings, perceiving such familiar objects was associated with activity in the right temporoparietal junction but this no doubt reflected familiarity with the objects in the images rather than with the images themselves.
The analysis of response time/activation magnitude correlations similarly showed that response time drove a network largely independent of that involved in processing art images. Independent networks for response time and processing art images would be consistent with findings of a dissociation between perceptual and decision processes in other domains (e.g., Binder et al., 2004). The correlations with response times found in cingulate and motor-related regions could reflect the attentional demands of the animacy discrimination task and the use of button presses to record responses. The bilateral anterior insular regions showing response time correlations here were also found to show positive correlations with response times in auditory discrimination (Binder et al., 2004), while the correlations with response times in the anterior cingulate, middle and inferior frontal gyri found here are similar to those reported in a visual discrimination task (Thielscher & Pessoa, 2007).
Conclusions
The present study suggests that reward processing makes a specific contribution to the neural processing of visual art, that artistic status alone is enough to instantiate reward processing, and that the brain thus responds to art for art s sake. The findings reported here complement earlier studies describing activity in reward-related regions during esthetic judgments (Kawabata & Zeki, 2004; Vartanian & Goel, 2004; Di Dio et al., 2007; Kirk, 2008; Kirk et al., 2009a, b). In the present study, esthetic preference was uncorrelated with activity in art-selective regions and did not drive reward-related activity. It remains for future research to delineate the relationship between neural processing of perceived artistic status and that of individual esthetic appeal, and how these neural processes relate to the function of reward circuitry.
Highlights.
Reward circuitry activated by artistic status of image independent of content
Activation independent of esthetic preference, familiarity, and response time
Ventral striatum activity driven by visual cortex for art images
Ventral striatum not activated by non-art images matched for content
Ventral striatum not driven by regions correlated with esthetic preference ratings
Supplementary Material
Acknowledgments
Support from the University of Georgia (HH, VP), the National Institutes of Health (KS, XH), and the Veterans Administration (KS) is gratefully acknowledged. We thank William de l Aune (Rehabilitation R&D Center of Excellence, Atlanta VAMC) for statistical advice.
ABBREVIATIONS
- amyg
amygdala
- CaS
calcarine sulcus
- CBL
cerebellum
- CiS
cingulate sulcus
- CoS
collateral sulcus
- FG
fusiform gyrus
- hypoth
hypothalamus
- IFS
inferior frontal sulcus
- IOG
inferior occipital gyrus
- IPS
intraparietal sulcus
- LG
lingual gyrus
- LOC
lateral occipital complex
- MFG
middle frontal gyrus
- MOG
middle occipital gyrus
- OFC
orbitofrontal cortex
- POF
parieto-occipital fissure
- SFG
superior frontal gyrus
- SMG
supramarginal gyrus
- SPG
superior parietal gyrus
- VS
ventral striatum
- L
left
- R
right
- a
anterior
- i
inferior
- m
medial
- p
posterior
- s
superior
- v
ventral
APPENDIX A: Art images
| Artist | Date of composition | Title |
|---|---|---|
| Anonymous | c200 CE | Fayum funerary portrait of adult male: Roman Egypt |
| Unknown | Cave art (horses and bulls), origin unknown. | |
| Unknown | Venice, Grand Canal | |
| Balla, Giacomo | 1909 | Street Light. |
| 1912 | Dynamism of a Dog on a Leash | |
| Chagall, Marc | 1911 | I and the Village |
| da Vinci, Leonardo | c1499–1500 | The Virgin and Child with St. Anne and St. John the Baptist |
| Degas, Edgar | 1872 | Dance Studio at the Opera (detail) |
| de Vlaminck, Maurice | 1906 | Tugboat on the Seine, Chatou |
| Fragonard, Jean-Honoré | c1770–72 | The Reader |
| Gordon, Jerry | 2001 | Vlaminck and Derain - Studio |
| Hagtvedt, Henrik | 1996 | Search |
| 1998 | Search | |
| 2000 | Bjørnstjerne Bjørnson | |
| 1996 | Focus | |
| 1996 | Lost | |
| 2002 | Picasso | |
| 1996 | Evasion | |
| 2000 | Roald Amundsen | |
| Heda, Willem Claesz | 1631 | Breakfast: Still Life with Blackberry Pie |
| Hokusai, Katsushika | c1829–32 | The Great Wave off Kanagawa |
| Kandinsky, Wassiliy | 1916 | Moscow I |
| Klee, Paul | 1922 | Senecio |
| Klimt, Gustav | 1907–08 | The Kiss |
| Kokoschka, Oskar | 1926 | Mandrill |
| Manet, Edouard | 1882 | The House at Rueil |
| Millais, John Everett | 1852 | Ophelia |
| Monet, Claude | 1899 | The Japanese Bridge |
| 1897–99 | Water Lilies | |
| 1891 | Haystacks at the End of Summer, Morning Effect | |
| Munch, Edvard | 1893 | The Scream |
| O Keeffe, Georgia | 1924 | Light Iris |
| Picasso, Pablo | 1922 | Still Life with Guitar |
| Renoir, Pierre-Auguste | 1883 | Dance at Bougival |
| 1881 | The Doge s Palace, Venice | |
| 1876 | Girl with a Watering Can | |
| Rouault, Georges | 1937 | The Old King |
| Seurat, Georges | 1884–86 | A Sunday Afternoon on the Island of La Grande Jatte |
| Titian | 1510 | Portrait of Ariosto |
| Turner, JMW | 1835 | The Burning of the Houses of Lords and Commons |
| 1838 | The Fighting Temeraire | |
| van Gogh, Vincent | 1889 | Landscape with House and Ploughman |
| 1888 | Shoes | |
| 1888 | Chair | |
| 1888 | Café Terrace at Night | |
| 1889 | Irises | |
| 1890 | Road with Cypress and Star | |
| Warhol, Andy | 1962 | Turquoise Marilyn |
| Wood, Grant | 1930 | American Gothic |
| Wyeth, Andrew | 1948 | Christina s World |
APPENDIX B: Granger causality analysis methods
Correlation-purged Granger causality
Suppose xm, m=1.. k correspond to the k selected ROI time series and X(t) =(x1(t),x2(t)... xk(t))T, then the traditional vector autoregressive (VAR) model with model parameters A(n) of order p is given by
| (1) |
Where V is the intercept vector, E(t) is the vector corresponding to the residuals and t represents discrete time. Direct causal relationship between the k time series can be inferred from the VAR coefficients (Kaminski et al., 2001) as follows
| (2) |
where aij are the elements of the matrix A. In order to model the effects of instantaneous correlation, we introduced the zero-lag terms into Eq.1, thereby obtaining a modified VAR (or mVAR) (Deshpande et al., 2010b) as shown below
| (3) |
where the diagonal elements of A'(0) are zero such that only the instantaneous cross-correlation, and not the zero-lag auto-correlation, between the time series are modeled. Accordingly, correlation-purged Granger causality (CPGC) is defined as follows
| (4) |
It is noteworthy that A'(1) … A' (p) ≠ A(1) … A(p) and the causal relationship obtained from only A'(1) … A' (p) (Eq.4) is purged of correlation leakage effects as shown before (Deshpande et al., 2010b).
Network reduction
The total number of paths obtained from 23 and 32 ROIs for the left and right hemispheric networks, respectively, was very large. We were deliberately inclusive in selecting ROIs in order to avoid the problem of circularity that can result from overly constraining ROI selection. To reduce the number of paths to be considered, we employed network reduction using a recursive procedure as previously reported by us (Deshpande et al., 2008). Accordingly, let the CPGC matrix of the original k ROIs be A. Upon removal of an ROI, a connectivity matrix B was determined using the remaining k-1 ROIs. A cost function, η, was then defined as follows
| (5) |
where Nk=k(k-1) are the total number of possible paths. A null distribution of n, i.e. nnull, was obtained by repeated calculation from phase randomized surrogate time series (Theiler et al., 1992; Deshpande et al., 2009a) which were generated from the original data. Subsequently, n was compared with nnull and the ROI under consideration was retained if n was found to be significantly positive (p<0.05). The above procedure was started with k=23 (for left hemisphere) or k=32 (for right hemisphere) ROIs and successively repeated by dropping the least significant ROI at each stage where in the network was recalculated with the remaining ROIs. The procedure was terminated when the cost function of all the ROIs in the residual network was significant.
Temporally adaptive CPGC using wavelets
Let k’ (k’ < k) denote the number of ROIs surviving the reduction process. Then, X(t) was defined as (x1(t),x2(t)... xk’ (t))T. A temporally adaptive mVAR using X(t) was defined such that its coefficients are a function of time
| (6) |
In accordance with previous studies (Sato et al., 2006), the elements of A'(n,t), i.e. a'ij(n,t), can be expanded using a wavelet basis as follows
| (7) |
Where cnx,y (x = −1,0,1 … T-1, y = 0,1,2 … 2x −1 and n = 1 … p) are the wavelet coefficients, ϕ(t) is the scaling function and ψx,y(t) are orthonormal basis functions derived from a mother wavelet. We chose the Daubechies wavelet as the mother wavelet owing to its regularity and compact support (Daubechies, 1988). The choice of the specific Daubechies wavelet (D2-D20) is dictated by the expected order of polynomial behavior in the data, given the fact that the number of vanishing moments of DN is N/2. For example, D4 is most suited for modeling a constant and linear component in the data (polynomial with two coefficients) because it has four wavelet filter coefficients and two vanishing moments. We chose the D8 Daubechies wavelet as the mother wavelet in this study because previous studies have indicated that fMRI activation data may be appropriately modeled by polynomials of order 3 to 5 (Gibbons et al., 2004; Clark, 2002). Both parameter T and maximum resolution parameter X must be a power of two. An iterative generalized least squares estimation procedure (Sato et al., 2006) was adopted to solve for the wavelet coefficients in order to obtain A'(n,t) and V(t). Temporally adaptive CPGC was then obtained as follows
| (8) |
Footnotes
Publisher's Disclaimer: This is a PDF file of an unedited manuscript that has been accepted for publication. As a service to our customers we are providing this early version of the manuscript. The manuscript will undergo copyediting, typesetting, and review of the resulting proof before it is published in its final citable form. Please note that during the production process errors may be discovered which could affect the content, and all legal disclaimers that apply to the journal pertain.
References
- Bedny M, Aguirre GK, Thompson-Schill SL. Item analysis in functional magnetic resonance imaging. NeuroImage. 2007;35:1093–1102. doi: 10.1016/j.neuroimage.2007.01.039. [DOI] [PubMed] [Google Scholar]
- Binder JR, Liebenthal E, Possing ET, Medler DA, Ward D. Neural correlates of sensory and decision processes in auditory object identification. Nature Neuroscience. 2004;7:295–301. doi: 10.1038/nn1198. [DOI] [PubMed] [Google Scholar]
- Bourdieu P, Darbel A. The Love of Art: European Art Museums and Their Public. Oxford: Blackwell; 1997. [Google Scholar]
- Camara E, Rodriguez-Fornells A, Ye Z, Munte TF. Reward networks in the brain as captured by connectivity measures. Frontiers in Neuroscience. 2009;3:350–362. doi: 10.3389/neuro.01.034.2009. [DOI] [PMC free article] [PubMed] [Google Scholar]
- Cela-Conde CJ, Marty G, Maestu F, Ortiz T, Munar E, Fernandez A, Roca M, Rossello J, Quesney F. Activation of the prefrontal cortex in the human visual aesthetic perception. Proceedings of the National Academy of Sciences USA. 2004;101:6321–6325. doi: 10.1073/pnas.0401427101. [DOI] [PMC free article] [PubMed] [Google Scholar]
- Cela-Conde CJ, Ayala FJ, Munar E, Maestu F, Nadal M, Capo MA, del Rio D, Lopez -Ibor JJ, Ortiz T, Mirasso C, Marty G. Sex-related similarities and differences in the neural correlates of beauty. Proceedings of the National Academy of Sciences USA. 2009;106:3847–3852. doi: 10.1073/pnas.0900304106. [DOI] [PMC free article] [PubMed] [Google Scholar]
- Chen H, Yang Q, Liao W, Shen S. Evaluation of the effective connectivity of supplementary motor areas during motor imagery using Granger causality mapping. NeuroImage. 2009;47:1844–1853. doi: 10.1016/j.neuroimage.2009.06.026. [DOI] [PubMed] [Google Scholar]
- Clark H. The language-as-a-fixed-effect fallacy: critique of language statistics in psychological research. Journal of Verbal Learning and Verbal Behavior. 1973;12:335–359. [Google Scholar]
- Clark VP. Orthogonal Polynomial Regression for the Detection of Response Variability in Event-Related fMRI. NeuroImage. 2002;17:344–363. doi: 10.1006/nimg.2002.1100. [DOI] [PubMed] [Google Scholar]
- Daubechies I. Orthonormal bases of compactly supported wavelets. Communications on Pure and Applied Mathematics. 1988;41:909–996. [Google Scholar]
- Deshpande G, Hu X, Lacey S, Stilla R, Sathian K. Object familiarity modulates effective connectivity during haptic shape perception. NeuroImage. 2010a;49:1991–2000. doi: 10.1016/j.neuroimage.2009.08.052. [DOI] [PMC free article] [PubMed] [Google Scholar]
- Deshpande G, Hu X, Stilla R, Sathian K. Effective connectivity during haptic perception: A study using Granger causality of functional magnetic resonance imaging data. NeuroImage. 2008;40:1807–1814. doi: 10.1016/j.neuroimage.2008.01.044. [DOI] [PMC free article] [PubMed] [Google Scholar]
- Deshpande G, LaConte S, James GA, Peltier S, Hu X. Multivariate Granger causality analysis of brain networks. Human Brain Mapping. 2009a;30:1361–1373. doi: 10.1002/hbm.20606. [DOI] [PMC free article] [PubMed] [Google Scholar]
- Deshpande G, Sathian K, Hu X. Effect of hemodynamic variability on Granger causality analysis of fMRI. NeuroImage. 2009b doi: 10.1016/j.neuroimage.2009.11.060. in press. [DOI] [PMC free article] [PubMed] [Google Scholar]
- Deshpande G, Sathian K, Hu X. Assessing and compensating for zero-lag correlation effects in time-lagged Granger causality analysis of fMRI. IEEE Transactions in Biomedical Engineering. 2010b doi: 10.1109/TBME.2009.2037808. in press. [DOI] [PMC free article] [PubMed] [Google Scholar]
- Dewey J. Having an Experience. In: Ann Boydston Jo., editor. John Dewey: The Later Works, 1925–1953, Vol 10: Art as Experience. Carbondale: Southern Illinois University Press; 1989. pp. 42–63. [Google Scholar]
- Di Dio C, Gallese V. Neuroaesthetics: a review. Current Opinion in Neurobiology. 2009;19:682–687. doi: 10.1016/j.conb.2009.09.001. [DOI] [PubMed] [Google Scholar]
- Di Dio C, Macaluso E, Rizzolatti G. The golden beauty: Brain responses to Classical and Renaissance sculptures. PLoS ONE. 2007;2:e1201. doi: 10.1371/journal.pone.0001201. [DOI] [PMC free article] [PubMed] [Google Scholar]
- Dutton D. The Art Instinct: Beauty, Pleasure and Human Evolution. Bloomsbury Press; New York: 2009. [Google Scholar]
- Duvernoy HM. The human brain. Surface, blood supply and three-dimensional sectional anatomy. Springer; New York: 1999. [Google Scholar]
- Elliott R, Newman JL, Longe OA, Deakin JFW. Differential response patterns in the striatum and orbitofrontal cortex to financial reward in humans: a parametric functional magnetic resonance imaging study. Journal of Neuroscience. 2003;23:303–307. doi: 10.1523/JNEUROSCI.23-01-00303.2003. [DOI] [PMC free article] [PubMed] [Google Scholar]
- Erk S, Spitzer M, Wunderlich AP, Galley L, Walter H. Cultural objects modulate reward circuitry. NeuroReport. 2002;13:2499–2503. doi: 10.1097/00001756-200212200-00024. [DOI] [PubMed] [Google Scholar]
- Fairhall SL, Ishai A. Neural correlates of object indeterminacy in art compositions. Consciousness and Cognition. 2008;17:923–932. doi: 10.1016/j.concog.2007.07.005. [DOI] [PubMed] [Google Scholar]
- Forman SD, Cohen JD, Fitzgerald M, Eddy WF, Mintun MA, Noll DC. Improved assessment of significant activation in functional magnetic resonance imaging (fMRI): Use of a cluster-size threshold. Magnetic Resonance Imaging in Medicine. 1995;33:636–647. doi: 10.1002/mrm.1910330508. [DOI] [PubMed] [Google Scholar]
- Ganjavi H, Shapiro CM. Hypocretin/orexin: A molecular link between sleep, energy regulation and pleasure. Journal of Neuropsychiatry & Clinical Neurosciences. 2007;19:413–419. doi: 10.1176/jnp.2007.19.4.413. [DOI] [PubMed] [Google Scholar]
- Gibbons RD, Lazar NA, Bhaumik DK, Sclove SL, Chen HY, Thulborn KR, Sweeney JA, Hur K, Patterson D. Estimation and classification of fMRI hemodynamic response patterns. NeuroImage. 2004;22:804–814. doi: 10.1016/j.neuroimage.2004.02.003. [DOI] [PubMed] [Google Scholar]
- Granger CWJ. Investigating causal relations by econometric models and cross -spectral methods. Econometrica. 1969;37:424–438. [Google Scholar]
- Guilford JP. Fundamental Statistics in Psychology and Education. McGraw Hill; New York: 1965. [Google Scholar]
- Hagtvedt H, Patrick VM. Art infusion: The influence of visual art on the perception and evaluation of consumer products. Journal of Marketing Research. 2008;45:379–389. [Google Scholar]
- Hare TA, O’Doherty J, Camerer CF, Schultz W, Rangel A. Dissociating the role of the orbitofrontal cortex and the striatum in the computation of goal values and prediction errors. Journal of Neuroscience. 2008;28:5623–5630. doi: 10.1523/JNEUROSCI.1309-08.2008. [DOI] [PMC free article] [PubMed] [Google Scholar]
- Heekeren HR, Wartenburger I, Marschner A, Mell T, Villringer A, Reischies FM. Role of ventral striatum in reward-based decision making. NeuroReport. 2007;18:951–955. doi: 10.1097/WNR.0b013e3281532bd7. [DOI] [PubMed] [Google Scholar]
- Hikosaka O, Bromberg-Martin E, Hong S, Matsumoto M. New insights on the subcortical representation of reward. Current Opinion in Neurobiology. 2008;18:203–208. doi: 10.1016/j.conb.2008.07.002. [DOI] [PMC free article] [PubMed] [Google Scholar]
- Kaminski M, Ding M, Truccolo WA, Bressler SL. Evaluating causal relations in neural systems: Granger causality, directed transfer function and statistical assessment of significance. Biological Cybernetics. 2001;85:145–157. doi: 10.1007/s004220000235. [DOI] [PubMed] [Google Scholar]
- Kawabata H, Zeki SJ. Neural correlates of beauty. Journal of Neurophysiology. 2004;91:1699–1705. doi: 10.1152/jn.00696.2003. [DOI] [PubMed] [Google Scholar]
- Kenning P, Plassmann H. How neuroscience can inform consumer research. IEEE Transactions on Neural Systems and Rehabilitation Engineering. 2008;16:532–538. doi: 10.1109/TNSRE.2008.2009788. [DOI] [PubMed] [Google Scholar]
- Kirk U. The neural basis of object-context relationships on aesthetic judgment. PLoS ONE. 2008;3:e3754. doi: 10.371/journal.pone.0003754. [DOI] [PMC free article] [PubMed] [Google Scholar]
- Kirk U, Skov M, Hulme O, Christensen MS, Zeki S. Modulation of aesthetic value by semantic context: An fMRI study. NeuroImage. 2009a;44:1125–1132. doi: 10.1016/j.neuroimage.2008.10.009. [DOI] [PubMed] [Google Scholar]
- Kirk U, Skov M, Christensen MS, Nygaard N. Brain correlates of aesthetic expertise: A parametric fMRI study. Brain and Cognition. 2009b;69:306–315. doi: 10.1016/j.bandc.2008.08.004. [DOI] [PubMed] [Google Scholar]
- Knutson B, Rick S, Wimmer GE, Prelec D, Loewenstein G. Neural predictors of purchases. Neuron. 2007;53:147–156. doi: 10.1016/j.neuron.2006.11.010. [DOI] [PMC free article] [PubMed] [Google Scholar]
- Leder H, Belke B, Oeberst A, Augustin D. A model of aesthetic appreciation and aesthetic judgments. British Journal of Psychology. 2004;95:489–508. doi: 10.1348/0007126042369811. [DOI] [PubMed] [Google Scholar]
- Lengger PG, Fischmeister FPhS, Leder H, Bauer H. Functional neuroanatomy of the perception of modern art: A DC-EEG study on the influence of stylistic information on aesthetic experience. Brain Research. 2007;1158:93–102. doi: 10.1016/j.brainres.2007.05.001. [DOI] [PubMed] [Google Scholar]
- Li S, Dardzinski BJ, Collins CM, Yang QX, Smith MB. Three-dimensional mapping of the static magnetic field inside the human head. Magnetic Resonance in Medicine. 1996;36:705–714. doi: 10.1002/mrm.1910360509. [DOI] [PubMed] [Google Scholar]
- Marinazzo D, Liao W, Chen H, Stramaglia S. Nonlinear connectivity by Granger causality. NeuroImage. 2010 doi: 10.1016/j.neuroimage.2010.01.099. in press. [DOI] [PubMed] [Google Scholar]
- Nadal M, Munar E, Capó MA, Rosselló J, Cela-Conde CJ. Towards a framework for the study of the neural correlates of aesthetic preference. Spatial Vision. 2008;21:379–396. doi: 10.1163/156856808784532653. [DOI] [PubMed] [Google Scholar]
- O’Doherty J. Reward representations and reward-related learning in the human brain: insights from neuroimaging. Current Opinion in Neurobiology. 2004;14:769–776. doi: 10.1016/j.conb.2004.10.016. [DOI] [PubMed] [Google Scholar]
- Plassmann H, Ambler T, Braeutigam S, Kenning P. What can advertisers learn from neuroscience? International Journal of Advertising. 2007;26:151–175. [Google Scholar]
- Raczkowski D, Kalat JW, Nebes R. Reliability and validity of some handedness questionnaire items. Neuropsychologia. 1974;12:43–47. doi: 10.1016/0028-3932(74)90025-6. [DOI] [PubMed] [Google Scholar]
- Ramachandran VS. A Brief Tour of Human Consciousness. Pi Press; New York: 2004. [Google Scholar]
- Roebroeck A, Formisano E, Goebel R. Mapping directed influence over the brain using Granger causality and fMRI. NeuroImage. 2005;25:230–242. doi: 10.1016/j.neuroimage.2004.11.017. [DOI] [PubMed] [Google Scholar]
- Sathian K, Lacey S, Anderson A, Stilla R, Hagtvedt H, Patrick V, Reddy S. Viewing art images activates reward and affective circuitry. Society for Neuroscience Abstracts. 2008:189.10. [Google Scholar]
- Sato JR, Junior EA, Takahashi DY, de Maria Felix M, Brammer MJ, Morettin PA. A method to produce evolving functional connectivity maps during the course of an fMRI experiment using wavelet-based time-varying Granger causality. NeuroImage. 2006;31:187–196. doi: 10.1016/j.neuroimage.2005.11.039. [DOI] [PubMed] [Google Scholar]
- Schaefer M, Rotte M. Favorite brands as cultural objects modulate reward circuit. NeuroReport. 2007;18:141–145. doi: 10.1097/WNR.0b013e328010ac84. [DOI] [PubMed] [Google Scholar]
- Schultz W. Behavioral theories and the neurophysiology of reward. Annual Review of Psychology. 2006;57:87–115. doi: 10.1146/annurev.psych.56.091103.070229. [DOI] [PubMed] [Google Scholar]
- Stilla R, Deshpande G, LaConte S, Hu X, Sathian K. Posteromedial parietal cortical activity and inputs predict tactile spatial acuity. Journal of Neuroscience. 2007;27:11091–11102. doi: 10.1523/JNEUROSCI.1808-07.2007. [DOI] [PMC free article] [PubMed] [Google Scholar]
- Stilla R, Hanna R, Hu X, Deshpande G, Sathian K. Neural processing underlying tactile microspatial discrimination in the blind: A functional magnetic resonance imaging study. Journal of Vision. 2008;8(10):13, 1–19. doi: 10.1167/8.10.13. [DOI] [PMC free article] [PubMed] [Google Scholar]
- Talairach J, Tournoux P. Co-planar stereotaxic atlas of the brain. Thieme Medical Publishers; New York: 1988. [Google Scholar]
- Theiler J, Eubank S, Longtin A, Galdrikian B, Farmer D. Testing for non-linearity in time series: The method of surrogate data. Physica D. 1992;58:77–94. [Google Scholar]
- Thielscher A, Pessoa L. Neural correlates of perceptual choice and decision making during fear-disgust discrimination. Journal of Neuroscience. 2007;27:2908–2917. doi: 10.1523/JNEUROSCI.3024-06.2007. [DOI] [PMC free article] [PubMed] [Google Scholar]
- Tobler PN, Fletcher PC, Bullmore ET, Schultz W. Learning-related human brain activations reflecting individual finances. Neuron. 2007;54:167–175. doi: 10.1016/j.neuron.2007.03.004. [DOI] [PubMed] [Google Scholar]
- Vartanian O, Goel V. Neuroanatomical correlates of aesthetic preference for paintings. NeuroReport. 2004;15:893–897. doi: 10.1097/00001756-200404090-00032. [DOI] [PubMed] [Google Scholar]
- Wartenberg TE. The Nature of Art: An Anthology. 2. Belmont, CA: Wadsworth; 2006. [Google Scholar]
- Yacubian J, Sommer T, Schroeder K, Gläscher J, Braus DF, Büchel C. Subregions of the ventral striatum show preferential coding of reward magnitude and probability. NeuroImage. 2007;38:557–563. doi: 10.1016/j.neuroimage.2007.08.007. [DOI] [PubMed] [Google Scholar]
- Yonelinas AP, Otten LJ, Shaw KN, Rugg MD. Separating the brain regions involved in recollection and familiarity in recognition memory. The Journal of Neuroscience. 2005;25:3002–3008. doi: 10.1523/JNEUROSCI.5295-04.2005. [DOI] [PMC free article] [PubMed] [Google Scholar]
- Zaidel DW. Neuropsychology of Art: Neurological, Cognitive and Evolutionary Perspectives. Psychology Press; Hove, UK: 2005. [Google Scholar]
Associated Data
This section collects any data citations, data availability statements, or supplementary materials included in this article.