

Abstract
3-Nitropropionic acid (3-NPA), an inhibitor of succinate dehydrogenase (SDH) at complex II of the mitochondrial electron transport chain induces cellular energy deficit and oxidative stress-related neurotoxicity. In the present study, we identified the site of reactive oxygen species production in mitochondria. 3-NPA increased O2•− generation in mitochondria respiring on the complex I substrates pyruvate + malate, an effect fully inhibited by rotenone. Antimycin A increased O2•− production in the presence of complex I and/or II substrates. Addition of 3-NPA markedly increased antimycin A-induced O2•− production by mitochondria incubated with complex I substrates, but 3-NPA inhibited O2•− formation driven with the complex II substrate succinate. At 0.6 μM, myxothiazol inhibits complex III, but only partially decreases complex I activity, and allowed 3-NPA-induced O2•− formation; however, at 40 μM myxothiazol (which completely inhibits both complexes I and III) eliminated O2•− production from mitochondria respiring via complex I substrates. These results indicate that in the presence of 3-NPA, mitochondria generate O2•− from a site between the ubiquinol pool and the 3-NPA block in the respiratory complex II.
Keywords: 3-NPA, Superoxide anion, Mitochondrial respiratory complexes
1. Introduction
3-Nitropropionic acid (3-NPA) is a natural environmental toxin synthesized by plants (e.g. Indigofera endecaphylla) and fungi (e.g. Aspergillus flavus) (Alston et al., 1977). Human exposure to 3-NPA has occurred via ingestion of fungally contaminated peanuts, corn, and sugar cane (Ludolph et al., 1991). The mechanism of cellular toxicity of 3-NPA is not clearly understood. The toxicity of 3-NPA is thought to be due to its irreversible covalent binding to the 70 kDa subunit of succinate dehydrogenase (SDH), inhibiting the enzyme (Alston et al., 1977; Coles et al., 1979; Huang et al., 2006). In addition to its neurotoxicity (Beal et al., 1993; Bogdanov et al., 1998), 3-NPA has impact on cardiac tissue characterized by diffuse swelling of cardiomyocytes and multifocal coagulative contraction band necrosis, atrial thrombosis, cardiac mineralization, cell loss, and fibrosis, which correlates with significant reduction in SDH activity, and decrease in heart ATP levels (Gabrielson et al., 2001). Our studies have shown that the basal kinase activities of redox-sensitive JNKs, MAP kinase kinase-4 and -7, as well as p38α and its upstream activator MKK3, and its downstream substrate ATF-2 are all elevated in hepatocytes of 3-NPA-treated C57BL/6 mice (Hsieh and Papaconstantinou, 2002; Hsieh et al., 2003). Systemic administration of 3-NPA, induces brain damage accompanied by disturbance in the endothelial cells of blood–brain barrier (Mogami et al., 2002). Chemical preconditioning by 3-NPA administration before cardiac arrest suppressed succinate-related oxidation and reduced ischemia–reperfusion injury in cardiac arrested rat lungs (Hirata et al., 2001). We recently showed that increasing antioxidant capacity of mitochondria by Bcl-2 overexpression protects PC12 cells from 3-NPA toxicity (Mandavilli et al., 2005). These cellular and organ pathologies caused by 3-NPA are thought to arise from an increase in levels of ROS, oxidatively damaged molecules and inhibition of ATP production (Ryu et al., 2003; Tunez et al., 2004; Wang et al., 2001) suggesting that 3-NPA may impact a variety of cells types in culture or in experimental animals.
Release of superoxide anions (O2•−) from mitochondria is the main source of cellular oxidative stress. 3-NPA significantly increases the levels of oxidized hydroethidine, 8-hydroxy-2-deoxyguanosine levels, and induces DNA fragmentation in the manganese superoxide dismutase (SOD2) heterozygous mice (Andreassen et al., 2001; Kim and Chan, 2001). 3-NPA causes a corresponding increase in the activities of SOD2 and glutathione peroxidase (GPx) (Fu et al., 1995; Tunez et al., 2004). Also, 3-NPA increases production of lipid peroxides and oxidized protein levels both in mitochondria and the cytosol (Fu et al., 1995; Pocernich et al., 2005). Oxidative stress induces age-dependent neuronal apoptosis in the mouse striatum, which in turn produces an age-dependent vulnerability to 3-NPA (Kim and Chan, 2001).
3-NPA inhibits SDH by binding to the active site of the enzyme (Alston et al., 1977; Coles et al., 1979; Huang et al., 2006). This covalent attachment to the 70 kDa FAD-containing subunit blocks succinate oxidization to fumarate. The mechanism of free radical production caused by 3-NPA is difficult to envision, and raises a question about the source of the electrons that reduce molecular oxygen to generate O2•−. The aims of our studies were to test: (a) whether 3-NPA-induced ROS generation cell-type specific, and (b) identify the site(s) of the electron transport chain involved in ROS generation after 3-NPA addition. To our knowledge, this is the first study that describes the mechanism by which 3-NPA causes ROS generation.
2. Materials and methods
2.1. Cells
The A549, type II alveolar bronchial epithelial cells were cultured in F-12 Kaigh's modified medium. Medullary pheochromocytoma (PC12) cells were maintained in Dulbecco's minimal essential medium (DMEM)/F12. AML12, nontumorigenic parenchymal liver cells with features characteristic of mature hepatocytes, were cultured in DMEM-Ham's F-12 containing ITS solution and 0.1 nM dexamethasone. The MH-S cell line developed from an adherent cell-enriched population of BALB/c mouse alveolar macrophages by transformation with simian virus 40 (SV40) “T” antigen was maintained in RPMI-1640. RAW267.1 murine peritoneal macrophage cells were cultured in RPMI-1640 medium. These mycoplasma tested cell lines were obtained from American Type Culture Collection. All media were supplemented with 10% fetal bovine serum (FBS; Sigma Inc, MO), glutamine (292 mg/L), penicillin (100 U/ml) and streptomycin (100 μg/ml). The cells were routinely subcultured using trypsin–EDTA and cultured under a humidified atmosphere (95% air and 5% CO2) at 37 °C.
2.2. Establishment of respiration-deficient cells
AML12, MH-S and A549 cells were incubated in culture media in the presence of 50 ng/ml ethidium bromide for >60 population doublings to develop respiration-deficient cells. Depletion of mitochondrial DNA was confirmed by Southern blot hybridization (Dobson et al., 2002). Respiration-deficient cells become pyrimidine auxotrophs, and media were supplemented with uridine (50 μg/ml) and sodium pyruvate (120 μg/ml) (King and Attardi, 1989).
2.3. Peritoneal macrophage isolation
Peritoneal macrophages were isolated as previously described (Galindo et al., 2004). Briefly, 3% thioglycolate (1 ml per animal) was injected into the peritoneal cavity of BALB/c mice to elicit macrophage migration. Four days after injection, the mice were sacrificed by an overdose of isoflurane followed by cervical dislocation. Peritoneal macrophages were harvested by flushing the peritoneal cavity with 5 ml of RPMI-1640 medium. Cells were counted, centrifuged, and plated at 5 × 10⁶ cells in 35 mm tissue culture dishes containing RPMI-1640 medium supplemented with 10% FBS, 100 U/ml penicillin, and 100 μg/ml streptomycin. Cells were allowed to adhere, and the non-adherent cells were washed from the cultures. Cells were incubated for the appropriate times before mitochondria were isolated.
2.4. Amplex Red assay
Amplex® Red (10-acetyl-3,7-dihydroxyphenoxazine; Molecular Probes, Eugene, OR) reacts with H2O2 in the presence of horseradish peroxidase (HRP) to generate a stable product, resorufin (Votyakova and Reynolds, 2001; Zhou et al., 1997). Briefly, mitochondria (100 μg/ml) or sub-mitochondrial particles (100 μg/ml) were suspended in 100 μl (per well) reaction buffer and incubated at room temperature (25 °C) for 30 min with 0.25 U/ml (determined in preliminary studies) of Amplex® Red and 0.5 U/ml of HRP. The increase in fluorescence (with excitation and emission wavelengths of 563 and 587 nm, respectively) was measured using a microplate reader (SpectraMass M2, Molecular Devices Inc). The rate of H2O2 production was linear with mitochondrial protein concentration. Reactions were carried out with exogenously added superoxide dismutase (SOD). The addition of catalase (400 U/ml, Sigma Inc) decreased H2O2 levels by ∼90%. As a positive control, increasing concentrations of H2O2 (0–400 pmol) were used.
2.5. Measurement of intracellular ROS
The intracellular site of ROS generation was identified by fluorescence microscopy. Cells were loaded with 2 μM dihydroethidium (H2Et; Molecular Probes, Eugene, OR) for 10 min after which the cells were treated with 3.0 mM 3-NPA (pH 7.4) and placed in a thermo-controlled microscopic chamber. Fluorescent images were captured just after the 3-NPA additions and after a 20 min incubation using a Photometrix Cool-SNAP Fx digital camera mounted on a NIKON Eclipse TE 200 UV microscope. Mito-Tracker Red (Molecular Probes, Eugene, OR) a cell-permeable fluorescent probe that accumulates in active mitochondria was used to stain mitochondria at a final concentration of 50 nM. The microscopic images were superimposed by using Metamorph™ Version 5.0 software (Universal Imaging, Downingtown, Pennsylvania).
Dihydrorhodamine-123 (DHR-123; Molecular Probes, Eugene, OR), a redox-sensitive probe was used to determine 3-NPA-induced ROS (Henderson and Chappell, 1993; Royall and Ischiropoulos, 1993). Cells were loaded with DHR-123 for 15 min then treated with 0.03, 0.3, 0.6, 1.0, 2.0, 3.0 and 5.0 mM 3-NPA for 30 min. As a positive control, 25 and 100 μM H2O2 was added to DHR-123-loaded cells. The changes in fluorescence intensities were determined by flow cytometry (Bekton–Dickinson FAC-Scan). We collected and analyzed 12,000 events for each sample. A second method was used to corroborate ROS generation by 3-NPA, 250 μM nitroblue tetrazolium (NBT, Molecular Probes, Eugene, OR) was added to the media of cell cultures at the end of the 3-NPA treatment period. The cells were incubated for an additional 15 min at 37 °C, washed, and allowed to air-dry. The cells were then solubilized with 2 M KOH and the resulting formazan levels were measured at 630 nm spectrophotometrically (Beckman DU530) (Messner and Imlay, 2002). As a positive control, 10 μU of glucose oxidase (GO) was added to cells and the amount of formazan was determined (Vrablic et al., 2001).
2.6. Mitochondria isolation
Cells were propagated in large volumes and collected by centrifugation (800g). Cell pellets were incubated in 5× volume of hypotonic buffer (10 mM KCl, 20 mM MOPS, and 1 mM EGTA; ethylene glycol-bis (β-aminoethyl ether)-N,N,N′,N′-tetraacetic acid) for 20 min. Sucrose (200 mM) and mannitol (50 mM) were added to the swollen cells, which were then Dounce-homogenized. The homogenate was centrifuged at 800g and the supernatants re-centrifuged at 10,000g to collect mitochondria. Mitochondrial pellets were washed, and resuspended in 10 mM KCl, 20 mM MOPS, and 1 mM EGTA containing 200 mM sucrose, 50 mM mannitol.
Mitochondria were isolated from the livers and hearts of 4- to 6-months-old BALB/c mice. The mice were anesthetized with pentobarbital (100 mg/kg i.p.) in compliance with the UTMB's Animal Care and Use Committee-approved protocol. Organs of sacrificed animals were excised and rinsed in buffer A (100 mM KCl, 20 mM MOPS, 1 mM EGTA, 5 mM MgSO4, and 1 mM ATP; pH 7.6) at 4 °C. Livers and hearts were homogenized in buffer A, containing 200 mM sucrose, 50 mM mannitol, 0.2% bovine serum albumin, using a Dounce homogenizer. Isolation of mitochondria was done as described above. Fresh mitochondrial suspensions from cultured cells or organs were purified on a continuous sucrose gradient (0.1–1.5 M) and used immediately for determining the site(s) of superoxide anion formation or stored at −80 °C for further studies.
2.7. Preparation of submitochondrial particles
Purified mitochondria from cultured cells or organs were sonicated in a Branson sonicator for 15 s in an ice-water bath (0 °C) at 75% of maximal output. Sonication was repeated six times at 1 min intervals, and the suspension was centrifuged at 16,000g for 10 min. The supernatant was removed and re-centrifuged at 145,000g for 60 min (Chen et al., 2003). The pellets were re-suspended in 10 mM MOPS buffer (pH 7.4) and protein concentrations were determined.
2.8. Measurement of mitochondria complex activities
Complex I (NADH-ubiquinone oxidoreductase) activity was measured using NADH-decylubiquinone reduction monitored at 340 nm using 200 μM NADH and 100 μM decylubiquinone (Smeitink et al., 2001). Complex II activity (succinate–ubiquinone oxidoreductase) was determined by reduction of 2,6-dichlorophenolindophenol (DCIP; 20 μM) in the presence of 5 mM succinate and 0.1 mM phenazine methosulfate as described previously (Trounce et al., 1996). The reaction was monitored spectrophotometrically at 600 nm for 3 min at 30 °C. Complex III activity was determined by monitoring the reduction of cytochrome c at 550 nm (Jarreta et al., 2000). Complex IV (Cytochrome c-oxidase) activity was quantified by monitoring the rate of cytochrome c oxidation at 550 nm (Jarreta et al., 2000).
To inhibit complex activities, we added rotenone (5 μM, complex I), antimycin A (0.4 μM, complex III), myxothiazol (0.6 μM; fully inhibited complex III, but inhibited 40% of complex I activity; 40 μM fully inhibited complexes I and III activities) (Lambert and Brand, 2004), and stigmatellin (6 μM, complex III) (Becker et al., 1999). Complex II was inhibited by 3-NPA (1–3 mM). The reaction mixtures were equilibrated for 2 min at 30 °C, before spectrophotometry at 30 °C. Protein concentrations were measured using Bio-Rad reagent, bovine serum albumin was used as the standard.
2.9. Reagents
Rotenone, myxothiazol, antimycin A (AA), 2,6-dichlorophenolindophenol, NADH, KCN, K3Fe (CN)6, ATP, succinate, pyruvate, SOD and malate were purchased from Sigma Chemical (St. Louis, MO). Supplies for the Amplex Red assay, dihydrorhodamine-123, dihydroethidium, and carbonylcyanide m-chlorophenyl-hydrazone (CCCP) and MitoTracker red were obtained from Molecular Probes (Eugene, OR). The 3-NPA (Aldrich Chemical Co., Milwaukee, WI) was dissolved in PBS and the pH was adjusted to 7.4 with 1 M NaOH (Stefanova et al., 2005). The osmolarity of pH-balanced 3-NPA solution was determined using an Advanced Osmometer (SIM International Co). The solutions were filtered through a 0.2-μm filter (Amicon, Inc.) to remove bacterial/fungal contamination for tissue cultures use.
2.10. Statistical analysis
Data are expressed as means ± SE. Results were analyzed for significant differences using ANOVA procedures and Student's t-tests (Sigma Plot 6.0). Differences were considered significant at p < 0.05 (*p < 0.05, **p < 0.01, ***p < 0.001, ****p < 0.0001).
3. Results
3.1. Cell type-dependent ROS generation upon 3-NPA exposure
Increased ROS levels in 3-NPA-treated cells have been documented (Ryu et al., 2003; Tunez et al., 2004; Wang et al., 2001); however, site of ROS overproduction has not been identified. Therefore, first we determined the intracellular site of ROS generation by microscopic imaging using dihydroethidium (H2Et) (Zhao et al., 2003). Cells were loaded with 2 μM H2Et, and placed in a thermo-controlled microscopic chamber and pH (7.4)-adjusted 3-NPA (2 mM) was then added. Mock-treated cultures were exposed to PBS, substituting an equimolar amount of NaCl for 3-NPA. The changes in fluorescence intensities were recorded at time 0 and 20 min after treatment. Our results showed that the green fluorescence mediated by H2Et/superoxide reaction products (Zhao et al., 2003) colocalized with MitoTracker red suggesting that mitochondria are the sites of ROS generation (Fig. 1A).
Fig. 1.
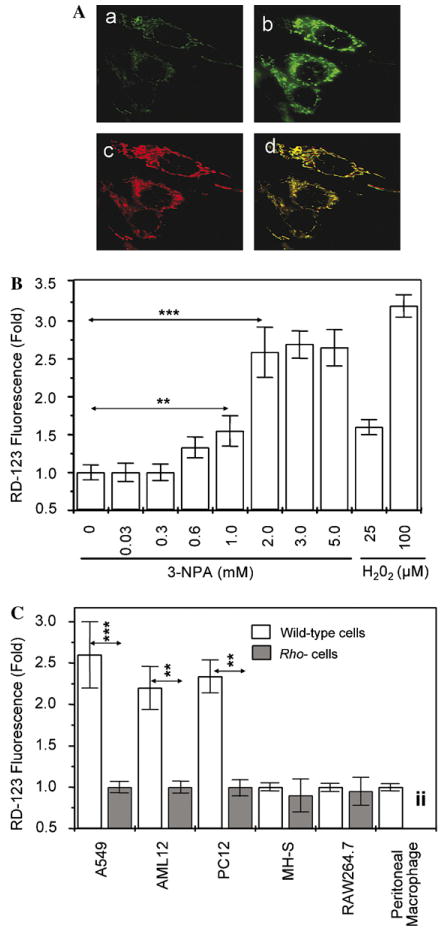
3-NPA increases intracellular levels of ROS. (A) Microscopic visualization of the intracellular site of ROS generation. Cells (A549) were loaded with dihydroethidum for 10 min and then treated with 3 mM 3-NPA (pH 7.4). Images were taken at the time of 3-NPA addition (a) and 20 min later (b). The MitoTracker-mediated image (c) overlaps with the dihydroethidium/superoxide fluorescence after superimposition (d) of images. (B) Dose-dependent increases in ROS levels in A549 cells after exposure to 3-NPA. Cells at 70% confluence were loaded with 10 μM DHR-123 and treated with 0, 0.03, 0.3, 0.6, 1, 2, 3 and 5 mM 3-NPA; 25 or 100 μM H2O2 were used as positive controls. Changes in fluorescence intensities were determined by flow cytometry 30 min after 3-NPA additions. 12,000 events for each sample were collected and analyzed. The cumulative means ± SEM are shown (n ≥ 3). **p < 0.01, ***p < 0.001. (C) 3-NPA increases ROS levels in cell-type dependent manner. Cells at 70% confluence were loaded with 10 μM DHR-123 and treated with 3 mM 3-NPA. Changes in fluorescence intensities were determined by flow cytometry 30 min after 3-NPA additions. Twelve thousand events for each sample were collected and analyzed. Results are expressed as means ± SEM values of at least three independent experiments. **p < 0.01, ***p < 0.001. iiRho- cells were not developed from primary peritoneal macrophages for analysis.
To determine the dose-dependent impact of 3-NPA on overall intracellular ROS levels, parallel cell (A549) cultures were loaded with 5 μM dihydrorhodamine-123 (DHR-123) (Henderson and Chappell, 1993; Royall and Ischiropoulos, 1993), treated with 0, 0.03, 0.3, 0.6, 1, 2, 3 and 5 mM pH (7.4)-adjusted 3-NPA. Equimolar amounts of NaCl for 3-NPA in PBS was added to control cultures. Changes in DHR-123-mediated fluorescence were determined by flow cytometry. Cells showed a concentration-dependent (in the range of 0.3–2 mM) increase in ROS levels 30 min after the addition of 3-NPA (Fig. 1B). The cell type-dependent changes in ROS levels were investigated in A549, AML12, PC12, MH-S, RAW264.7 cells and primary macrophage cultures. As shown in Fig. 1C, 3-NPA (2 mM) treatment significantly increased in A549, AML12, and PC12, while 3-NPA failed to induce a detectable change in ROS levels in the MH-S and RAW264.7 cells. Similarly, 3-NPA did not change oxidative stress levels in freshly prepared primary murine peritoneal macrophage cells (Fig. 1C). Mitochondrial DNA-depleted cells (rho−A549, rho−AML12, rho−PC12) did not generate detectable levels of ROS after 3-NPA treatment (Fig. 1C), suggesting that functional mitochondria are required for ROS generation. Similar results (data not shown) were obtained when we repeated these experiments using nitroblue tetrazolium (NBT), another redox-sensitive probe, which primarily reacts with O2•− (Messner and Imlay, 2002). Together, these results strongly indicate that the generation of ROS is cell type-specific and of mitochondrial origin after 3-NPA addition.
3.2. 3-NPA induces ROS from isolated mitochondria
To provide further evidence that ROS are of mitochondrial origin, we have determined O2•− production from isolated mitochondria, using Amplex Red assays to measure the H2O2 originating from O2•− dismutation by SOD (Votyakova and Reynolds, 2001; Zhou et al., 1997). 3-NPA increased the O2•− production from intact mitochondria isolated from A549, AML12, and PC12 cells oxidizing the complex I substrates, pyruvate + malate (Fig. 2A). A similar increase in the H2O2 production was observed in heart mitochondria, while mitochondria from liver released somewhat less H2O2 (Fig. 2A). 3-NPA treatments induced no detectable levels of O2•− in mitochondria from MH-S and RAW267.4 cells respiring on complex I substrates (pyruvate + malate). Mitochondria from freshly prepared murine peritoneal macrophages behaved similarly.
Fig. 2.
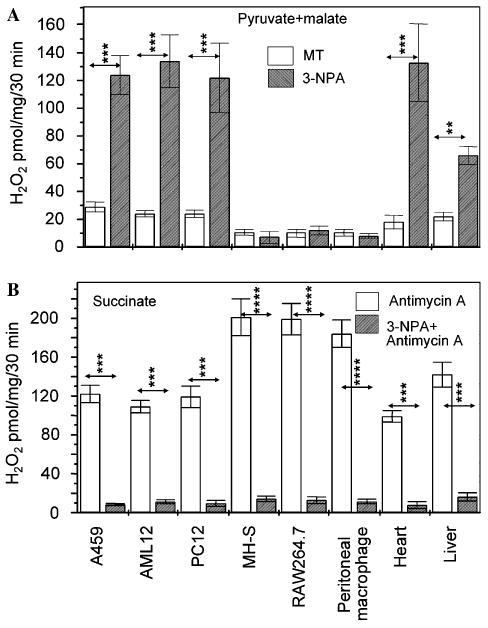
3-NPA-exposed mitochondria produce ROS. (A) Generation of O2•− in mitochondria is cell type-dependent. Purified mitochondria respiring on pyruvate + malate were exposed to 3-NPA (3 mM, pH 7.4) and O2•− levels were determined after dismutation to H2O2 by Amplex Red assay. **p < 0.01, ***p < 0.001. (B) 3-NPA prevents O2•− generation from mitochondria respiring from succinate ± AA. The H2O2 production was determined by Amplex Red assay. Results are means ± SEM (n = 4–7). ***p < 0.001, ****p < 0.0001. MT, mock-treated.
3-NPA inhibited the O2•− formation during succinate oxidization in mitochondria of all cell types as well as heart and liver mitochondria (Fig. 2B). In the absence of 3-NPA cells generated low levels of ROS (data not shown). Addition of AA (0.4 μM), an inhibitor of cytochrome b reoxidation in complex III (Trumpower, 1990) increased amounts of released H2O2 from mitochondria isolated from A549, PC12, AML12, heart, and liver. Similar results were obtained using mitochondria from MH-S, RAW267.4 cells and freshly prepared murine peritoneal macrophages (Fig. 2B). 3-NPA inhibited AA-mediated O2•− generation (Fig. 2B) indicating that electrons arising from complex II (succinate oxidation alone) are not the source of ROS in 3-NPA-treated cells.
3.3. O2•− is released between the ubiquinol pool and the 3-NPA block in the complex II
Because of the cell type-specific differences in 3-NPA-induced ROS generation, we selected A549 and MH-S mitochondria for further investigations. Site-specific inhibitors of respiratory complexes were utilized to identify the site of O2•− generation. As shown in Fig. 3A, in the presence of succinate mitochondria produced low levels of O2•− and AA increased the O2•− formation in mitochondria of both cell types. H2O2 levels released from MH-S macrophage mitochondria were consistently higher (∼190 pmol/mg/30 min) than in A549-derived mitochondria (∼120 pmol/mg/30 min) (Fig. 3A). 3-NPA (and malonate, another complex II inhibitor) inhibited spontaneous and AA-induced H2O2 formation from A549 and MH-S mitochondria with succinate as electron donor (Fig. 3A). Succinate as the substrate, rotenone had insignificant impact on the H2O2 levels released from either A549 or MH-S mitochondria. The uncoupler, carbonylcyanide m-chlorophenyl-hydrazone (CCCP) (Minamikawa et al., 1999; Trumpower and Katki, 1975) significantly decreased H2O2 levels suggesting that a mitochondrial inner membrane potential is required for 3-NPA-induced ROS generation. CCCP also inhibited AA-induced ROS generation (Fig. 3A).
Fig. 3.
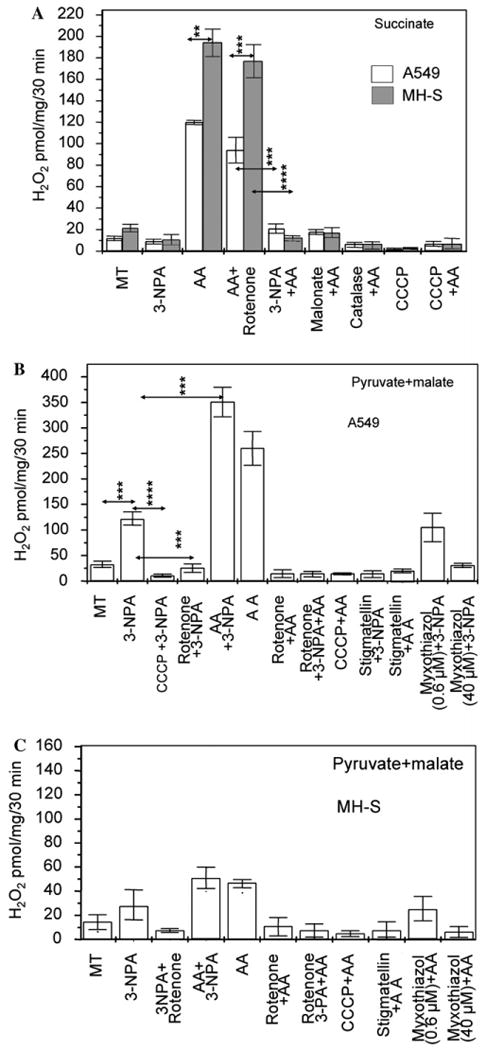
Identification of ROS-generating site in 3-NPA-treated mitochondria. (A) 3-NPA inhibits ROS generation from A549 or MH-S mitochondria respiring on the complex II substrate, succinate. Purified mitochondria respiring on succinate were exposed to 3-NPA (3 mM, pH 7.4) and O2•− levels were determined after its dismutation to H2O2 by SOD by Amplex Red assays. MT, mock-treated; AA, Antimycin A; CCCP, carbonylcyanide m-chlorophenyl-hydrazone. **p < 0.01, ***p < 0.001, ****p < 0.0001. (B) 3-NPA increases ROS production from A549 mitochondria in the presence of pyruate + malate. Changes in O2•− levels were determined as in A. ***p < 0.001, ****p < 0.0001. MT, mock-treated; antimycin A, AA; SOD, superoxide dismutase. (C) MH-S cell mitochondria respiring on pyruate + malate ± 3-NPA generate low levels of ROS. ROS generation was determined as in (A) and (B). Results in (A), (B) and (C) are means ± SEM (n = 4–6).
Using pyruvate + malate as substrates, we observed significant differences between A549 and MH-S cells. 3-NPA increased H2O2 levels released from mitochondria of A549 but low levels of H2O2 was generated in mitochondria of MH-S cells (Fig. 3B and C). Results summarized in Fig. 3B using mitochondria from A549 cells results are as follows: (a) AA further increased 3-NPA-induced H2O2 levels and (b) rotenone inhibited these actions of AA and 3-NPA. (c) Myxothiazol (40 μM) effectively inhibits both complexes I and III (Degli Esposti, 1998; Genova et al., 2001), so blocked H2O2 production from A549 mitochondria oxidizing complex I substrates, regardless of whether 3-NPA was present or not (Fig. 3B). (d) 0.6 μM myxothiazol decreased complex I activity by ∼30%, while the complex III “Qo” site was fully inhibited (determined in preliminary studies) allowed 3-NPA-mediated O2•− formation (Fig. 3B). (e) To support data derived from these experiments, we used 6.0 μM stigmatellin, which inhibits complex I and electron transport into complex III at the Qo site (Trumpower, 1990). Stigmatellin decreased 3-NPA-induced O2•− generation in A549 mitochondria oxidizing pyruvate + malate. Stigmatellin also suppressed the AA-induced H2O2 production in A549 mitochondria (Fig. 3B). Together these data strongly suggest that electrons generated by complex I are required for 3-NPA-induced O2•− generation.
3.4. 3-NPA-induced ROS generation requires electron transfer from complex I
Next, we tested whether cell type-specific (A549 vs. MH-S cells) differences in 3-NPA-induced mitochondrial formation of O2•− are due to different ratios in their complexes I to II activities. Because submitochondrial particles are unable to oxidize pyruvate + malate, NADH was used as the complex I substrate (Barja, 1999). Submitochondrial particles (25 μg/ml) oxidized NADH, and rotenone completely inhibited this NADH–decylubiquinone reductase activity. MH-S sub-mitochondrial particles had lower complex I activity compared to A549 sub-mitochondrial particles (Fig. 4A). 3-NPA had no affect on complex I activity in either cell type (Fig. 4B). A549 and MH-S sub-mitochondrial particles possessed complex II activity based on the reduction of 2,6-dichlorophenolindophenol (DCIP) by succinate. As shown in Fig. 4B, the complex II activity was considerably higher in MH-S sub-mitochondrial particles. Complex II activities were abolished in the presence of 3-NPA (Fig. 4B) or malonate (data not shown). Complex III activity was comparable between the two-cell lines (A549 or MH-S). AA inhibited the activity of complex III regardless of the cell type. We did not observe differences in activities of complex IV in mitochondrial particles from A549 and MH-S, and 3-NPA had no effect on the activity of complex III and (data not shown). These data may provide an explanation for the cell type-dependent ROS generation in response to 3-NPA.
Fig. 4.
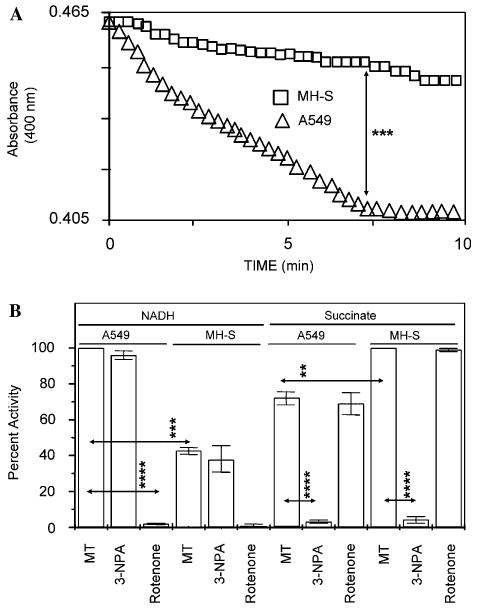
Sub-mitochondrial particles from MH-S cells exhibit low complex I activity. (A) Changes in absorbance by sub-mitochondrial particles from A549 (□) and MH-S (Δ) cells. Kinetic changes in complex I activities were determined using equal amounts (25 μg/ml) of sub-mitochondrial particles. ***p < 0.001. (B) Relative activities of respiratory complexes I and II in A549 and MH-S cells. Sub-mitochondrial particles were isolated and activities were determined as described in Section 2. Results are means ± SEM (n = 3–4). **p < 0.01, ***p < 0.001, ****p < 0.0001. MT, mock-treated.
4. Discussion
3-NPA treatment of cells causes an increase in levels of intracellular ROS and oxidatively damaged molecules (Fu et al., 1995; Tunez et al., 2004; Wang et al., 2001). Irreversible binding of 3-NPA to respiratory complex II along with oxidatively damaged mitochondrial proteins lead to the arrest of ATP synthesis presumably by interrupting the electron transfer in the mitochondrial inner membrane (Coles et al., 1979; Hirata et al., 2001). We have previously shown that 3-NPA induced the release of H2O2 from PC12 cells, and that this H2O2 release was prevented by overexpression and mitochondrial accumulation of Bcl2 (Mandavilli et al., 2005). In the present study, we show that 3-NPA has induced release of ROS from mitochondria and it is cell-type dependent. Furthermore, studies with site-specific inhibitors of mitochondrial respiratory complexes show that in the presence of 3-NPA, mitochondria generate O2•− from a site between the ubiquinol pool and the 3-NPA block in the respiratory complex II.
For defining the intracellular site(s) of ROS production, we selected the redox-sensitive H2Et and changes in fluorescence intensities were determined by real-time microscopic imaging. Results showed that H2Et/superoxide-mediated green fluorescence was localized to mitochondria. The green fluorescence of the H2Et/superoxide reaction product is well-established as it has a lower excitation (480 nm) and emission (567 nm) wavelength maximum compared to oxidized ethidium (excitation, 500–530 nm; emission, 590–620 nm) (Zhao et al., 2003). Overall changes in ROS levels were determined using DHR-123. Results show significantly increased ROS levels in A549, AML12, and PC12 cells, while 3-NPA failed to do so in the macrophage lines, MH-S and RAW264.7. DHR-123 reacts primarily with H2O2 (dismutated from O2•− (Ehleben et al., 1997; Royall and Ischiropoulos, 1993). To rule out that increase in intracellular ROS levels is due to culture conditions and/or autooxidation of DHR-123 (Ehleben et al., 1997; Royall and Ischiropoulos, 1993), we repeated these experiments using NBT, another redox-sensitive probe, which primarily reacts with O2•− (Messner and Imlay, 2002). Fold increases in formazan formation were similar to those seen for DHR-123.
To obtain an insight into intra-mitochondrial site of 3-NPA-induced overproduction of O2•− we used specific inhibitors of the mitochondrial respiratory chain. Overproduction of O2•− was determined by the levels of released H2O2 from isolated intact mitochondria by Amplex Red assay (Votyakova and Reynolds, 2001; Zhou et al., 1997). 3-NPA prevented O2•− formation when mitochondrial respiration was driven by the complex II substrate, succinate. This observation is consistent with the irreversible binding of 3-NPA to SDH in the respiratory complex II (Coles et al., 1979). 3-NPA generated ROS from mitochondria when electrons were supplied via pyruvate + malate oxidation. The addition of rotenone to mitochondria prevented while AA-promoted 3-NPA-mediated generation of O2•−. Inhibition by rotenone of 3-NPA ROS production is consistent with the fact that rotenone blocks complex I near the binding site for ubiquinol and inhibits electron to enter Q pool (Degli Esposti, 1998; Okun et al., 1999).
At low concentrations (e.g., 0.6 μM), myxothiazol inhibits quinol oxidation at the Qo site in complex III, while at higher concentrations (e.g., 40 μM) it effectively inhibits both complexes I and III (Degli Esposti, 1998; Genova et al., 2001). Therefore, myxothiazol was used to define whether 3-NPA-mediated H2O2 formation due to a leak of electrons from complex III, or arises before electrons enter complex III. Our results show that 40 μM myxothiazol prevented, while at low concentration (0.6 μM) permitted 3-NPA-induced O2•− formation. Since the Qo site is inhibited at the lower concentration of myxothiazol, which does not block O2•− formation, complex III involvement in O2•− generation is unlikely. These results suggest two possible sources for O2•− formation: (1) the reduced ubiquinol pool and (2) 3-NPA inhibits backflow of electrons into complex II. The first possibility can be excluded because fully reduced ubiquinol is a very poor electron donor to O2. Second, we propose that O2•− formation by 3-NPA is that 3-NPA may result in supraphysiological levels of ubisemiquinone by inhibiting electron backflow into complex II. More specifically, the inhibition of fumarate reduction may result in the build-up of reducing equivalents in complex II leading to O2•− production (Fig. 5). Previous observations provide evidence that complex II may switch functions from succinate oxidation to fumarate reduction and exhibit fumarate reductase activity (Chandel et al., 1998; Duranteau et al., 1998). Fumarate reductase activity of complex II was shown e.g., during anaerobic conditions, in the bovine heart, in pulmonary arteries of hypoxic mice and in perfused hypoxic rat hearts (Archer et al., 1993; Hagerhall, 1997; Paddenberg et al., 2000; Yu et al., 1987). In organisms, such as Caenorhabditis elegans, Ascaris suum, and Trypanosoma cruzi complex II possesses well-defined fumarate reductase activity (Boveris et al., 1986; Kuramochi et al., 1994; Takamiya et al., 1999). Bacterial (e.g., Escherichia coli) fumarate reductases are known to be potent producers of ROS (Imlay, 1995). Although fumarate reductase activity of complex II in our experimental conditions remains to be proven, several lines of evidence support it: (a) 3-NPA does not inhibit complex III activity; and (b) O2•− generation by 3-NPA requires membrane potential as CCCP inhibited ROS generation. Indeed, electron backflow from cytochrome c to fumarate reduction has been shown to be membrane potential dependent (Moroney et al., 1984).
Fig. 5.
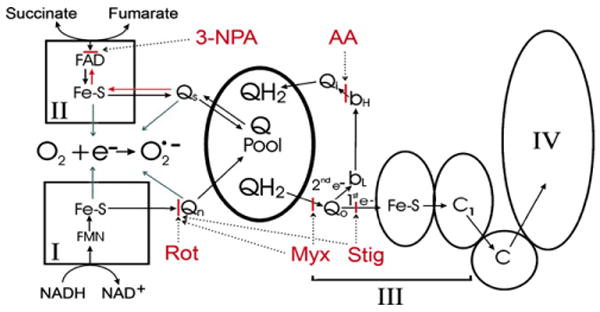
Site of superoxide formation in mitochondrial respiratory chain after 3-NPA addition. The complex II substrate, succinate, donates electrons to a bound FAD and then to the iron-sulfur clusters. In turn, they transfer the electrons to the Q pool through a bound intermediate ubisemiquinone (Qs) (Salerno and Ohnishi, 1980). 3-NPA addition blocks electron entry and electron backflow into complex II (Sun et al., 2005) and ROS are produced using electrons derived from complex I substrates. ROS levels are augmented by AA and are inhibited by rotenone (Rot) stigmatellin (Stig) and myxothiazol (Myx, 40 μM). Stigmetellin inhibits both at the Qo site and at Qn while myxothiazol inhibits at Qo only at low concentrations (0.6 μM) but inhibits electron flow at both Qo and Qn sites at high concentrations (e.g., 40 μM). 3-NPA-induced ROS arises between the 3-NPA and the myxothiazol (0.6 μM) blocks. Ubiquinol itself is not a source of ROS, which suggests that electron backflow into complex II through Qs or other complex II redox clusters, is the source of ROS production. Furthermore, in the presence of 3-NPA putative sites for ROS production (single electron donation sites; blue arrows) are the semiubiquinone species, Qs and Qn, and the iron–sulfur clusters from both complexes I and II. Qo is also a possible ROS donation site, but thermodynamics and reaction mechanisms of single electron transfer to oxygen may suggest otherwise (Tang and Trumpower, 1986). I–IV, respiratory complexes I–IV. Sites of inhibitor action are depicted in a solid red bar with dotted arrows pointing to the sites. (For interpretation of the references to color in this figure legend, the reader is referred to the web version of this paper.)
The relative importance of complexes I and II in providing electrons to the ubiquinone pool appears to vary among tissues and species (Barja, 1999). Accordingly, we showed that cell type-specific differences in 3-NPA-induced mitochondrial formation of O2•− are due to different ratios in complex I to II activities. In the absence of 3-NPA, MH-S mitochondria respiring on succinate produced O2•− and further increased when the Qi site of complex III was inhibited by AA, yet insignificant O2•− levels were detected in the presence of pyruvate + malate. The combination of 3-NPA and 0.6 μM myxothiazol produced no release of H2O2 from MH-S mitochondria (Fig. 3C) in the presence of pyruvate + malate. This observation correlates well with the lower NADH dehydrogenase activity of MHS mitochondria compared to complex I activity in A549. Since complex I activity is relatively low in cells of macrophage origin, 3-NPA inhibits rather than promotes O2•− formation in these cells. Because rotenone inhibits 3-NPA-induced ROS generation in A549 cells, we propose that 3-NPA-induced ROS generation requires electron transfer from complex I. Taken together, we concluded that those cell types (e.g., MH-S) that primarily rely on electron generation by complex II do not generate detectable levels of ROS when 3-NPA is added.
In summary, we show that AA, a Qi site inhibitor, synergistically increases O2•− production when combined with 3-NPA. Low concentration of myxothiazol a Qo inhibitor allows 3-NPA-mediated ROS production. Rotenone, stigmatellin, and 40 μM myxothiazol each inhibits O2•− production because they block the entry of electron flow into the Q pool. Results of our studies suggest that addition of 3-NPA inhibits formation of fumarate from ubiquinol (QH2) and ubisemiquinone (QS) (e.g., QH2 → QS → fumarate → succinate), so large amounts of QS over-reduce complex II and O2•− is produced from a site between the Q pool and the 3-NPA block (Fig. 5). These data provide an explanation for the cell type-dependent ROS generation and oxidative stress-mediated cellular toxicity of 3-NPA that was not clearly understood previously.
Acknowledgments
We appreciate the editorial and scientific assistance of Dr. David Konkel. This work was supported by the P01 AG 021830 (I.B., J.P., and S.M.) from the NIH/NIA, P01 AI062885-01 (I.B.) from the NIAID and NIEHS Center Grant, EOS 006677 and the Welch Foundation grant E-1381 to W.R.W.
Abbreviations
- AA
antimycin A
- CCCP
carbonylcyanide m-chlorophenyl-hydrazone
- DHR-123
dihydrorhodamine-123
- H2Et
dihydroethidium
- DCIP
2,6-dichlorophenolindophenol
- NBT
nitroblue tetrazolium
- SDH
succinate dehydrogenase
- O2•−
superoxide anion
- SOD
superoxide dismutase
- 3-NPA
3-nitropropionic acid
- Qs
ubisemiquinone
- Q
ubiquinone
- QH2
ubiquinol
References
- Alston TA, Mela L, Bright HJ. 3-Nitropropionate, the toxic substance of Indigofera, is a suicide inactivator of succinate dehydrogenase. Proc Natl Acad Sci USA. 1977;74:3767–3771. doi: 10.1073/pnas.74.9.3767. [DOI] [PMC free article] [PubMed] [Google Scholar]
- Andreassen OA, Ferrante RJ, Dedeoglu A, Albers DW, Klivenyi P, Carlson EJ, Epstein CJ, Beal MF. Mice with a partial deficiency of manganese superoxide dismutase show increased vulnerability to the mitochondrial toxins malonate, 3-nitropropionic acid, and MPTP. Exp Neurol. 2001;167:189–195. doi: 10.1006/exnr.2000.7525. [DOI] [PubMed] [Google Scholar]
- Archer SL, Huang J, Henry T, Peterson D, Weir EK. A redox-based O2 sensor in rat pulmonary vasculature. Circ Res. 1993;73:1100–1112. doi: 10.1161/01.res.73.6.1100. [DOI] [PubMed] [Google Scholar]
- Barja G. Mitochondrial oxygen radical generation and leak: sites of production in states 4 and 3, organ specificity, and relation to aging and longevity. J Bioenerg Biomembr. 1999;31:347–366. doi: 10.1023/a:1005427919188. [DOI] [PubMed] [Google Scholar]
- Beal MF, Brouillet E, Jenkins BG, Ferrante RJ, Kowall NW, Miller JM, Storey E, Srivastava R, Rosen BR, Hyman BT. Neurochemical and histologic characterization of striatal excitotoxic lesions produced by the mitochondrial toxin 3-nitropropionic acid. J Neurosci. 1993;13:4181–4192. doi: 10.1523/JNEUROSCI.13-10-04181.1993. [DOI] [PMC free article] [PubMed] [Google Scholar]
- Becker LB, vanden Hoek TL, Shao ZH, Li CQ, Schumacker PT. Generation of superoxide in cardiomyocytes during ischemia before reperfusion. Am J Physiol. 1999;277:H2240–H2246. doi: 10.1152/ajpheart.1999.277.6.H2240. [DOI] [PubMed] [Google Scholar]
- Bogdanov MB, Ferrante RJ, Kuemmerle S, Klivenyi P, Beal MF. Increased vulnerability to 3-nitropropionic acid in an animal model of Huntington's disease. J Neurochem. 1998;71:2642–2644. doi: 10.1046/j.1471-4159.1998.71062642.x. [DOI] [PubMed] [Google Scholar]
- Boveris A, Hertig CM, Turrens JF. Fumarate reductase and other mitochondrial activities in Trypanosoma cruzi. Mol Biochem Parasitol. 1986;19:163–169. doi: 10.1016/0166-6851(86)90121-0. [DOI] [PubMed] [Google Scholar]
- Chandel NS, Maltepe E, Goldwasser E, Mathieu CE, Simon MC, Schumacker PT. Mitochondrial reactive oxygen species trigger hypoxia-induced transcription. Proc Natl Acad Sci USA. 1998;95:11715–11720. doi: 10.1073/pnas.95.20.11715. [DOI] [PMC free article] [PubMed] [Google Scholar]
- Chen Q, Vazquez EJ, Moghaddas S, Hoppel CL, Lesnefsky EJ. Production of reactive oxygen species by mitochondria: central role of complex III. J Biol Chem. 2003;278:36027–36031. doi: 10.1074/jbc.M304854200. [DOI] [PubMed] [Google Scholar]
- Coles CJ, Edmondson DE, Singer TP. Inactivation of succinate dehydrogenase by 3-nitropropionate. J Biol Chem. 1979;254:5161–5167. [PubMed] [Google Scholar]
- Degli Esposti M. Inhibitors of NADH–ubiquinone reductase: an overview. Biochim Biophys Acta. 1998;1364:222–235. doi: 10.1016/s0005-2728(98)00029-2. [DOI] [PubMed] [Google Scholar]
- Dobson AW, Grishko V, LeDoux SP, Kelley MR, Wilson GL, Gillespie MN. Enhanced mtDNA repair capacity protects pulmonary artery endothelial cells from oxidant-mediated death. Am J Physiol Lung Cell Mol Physiol. 2002;283:L205–L210. doi: 10.1152/ajplung.00443.2001. [DOI] [PubMed] [Google Scholar]
- Duranteau J, Chandel NS, Kulisz A, Shao Z, Schumacker PT. Intracellular signaling by reactive oxygen species during hypoxia in cardiomyocytes. J Biol Chem. 1998;273:11619–11624. doi: 10.1074/jbc.273.19.11619. [DOI] [PubMed] [Google Scholar]
- Ehleben W, Porwol T, Fandrey J, Kummer W, Acker H. Cobalt and desferrioxamine reveal crucial members of the oxygen sensing pathway in HepG2 cells. Kidney Int. 1997;51:483–491. doi: 10.1038/ki.1997.67. [DOI] [PubMed] [Google Scholar]
- Fu YT, He FS, Zhang SL, Zhang JS. Lipid peroxidation in rats intoxicated with 3-nitropropionic acid. Toxicon. 1995;33:327–331. doi: 10.1016/0041-0101(94)00173-6. [DOI] [PubMed] [Google Scholar]
- Gabrielson KL, Hogue BA, Bohr VA, Cardounel AJ, Nakajima W, Kofler J, Zweier JL, Rodriguez ER, Martin LJ, de Souza-Pinto NC, Bressler J. Mitochondrial toxin 3-nitropropionic acid induces cardiac and neurotoxicity differentially in mice. Am J Pathol. 2001;159:1507–1520. doi: 10.1016/S0002-9440(10)62536-9. [DOI] [PMC free article] [PubMed] [Google Scholar]
- Galindo CL, Fadl AA, Sha J, Gutierrez C, Jr, Popov VL, Boldogh I, Aggarwal BB, Chopra AK. Aeromonas hydrophila cytotoxic enterotoxin activates mitogen-activated protein kinases and induces apoptosis in murine macrophages and human intestinal epithelial cells. J Biol Chem. 2004;279:37597–37612. doi: 10.1074/jbc.M404641200. [DOI] [PubMed] [Google Scholar]
- Genova ML, Ventura B, Giuliano G, Bovina C, Formiggini G, Parenti Castelli G, Lenaz G. The site of production of superoxide radical in mitochondrial Complex I is not a bound ubisemiquinone but presumably iron–sulfur cluster N2. FEBS Lett. 2001;505:364–368. doi: 10.1016/s0014-5793(01)02850-2. [DOI] [PubMed] [Google Scholar]
- Hagerhall C. Succinate: quinone oxidoreductases. Variations on a conserved theme. Biochim Biophys Acta. 1997;1320:107–141. doi: 10.1016/s0005-2728(97)00019-4. [DOI] [PubMed] [Google Scholar]
- Henderson LM, Chappell JB. Dihydrorhodamine 123: a fluorescent probe for superoxide generation? Eur J Biochem. 1993;217:973–980. doi: 10.1111/j.1432-1033.1993.tb18328.x. [DOI] [PubMed] [Google Scholar]
- Hirata T, Fukuse T, Ishikawa S, Hanaoka S, Chen Q, Shoji T, Wada H. “Chemical preconditioning” by 3-nitropropionate reduces ischemia–reperfusion injury in cardiac-arrested rat lungs. Transplantation. 2001;71:352–359. doi: 10.1097/00007890-200102150-00003. [DOI] [PubMed] [Google Scholar]
- Hsieh CC, Papaconstantinou J. The effect of aging on p38 signaling pathway activity in the mouse liver and in response to ROS generated by 3-nitropropionic acid. Mech Ageing Dev. 2002;123:1423–1435. doi: 10.1016/s0047-6374(02)00084-2. [DOI] [PubMed] [Google Scholar]
- Hsieh CC, Rosenblatt JI, Papaconstantinou J. Age-associated changes in SAPK/JNK and p38 MAPK signaling in response to the generation of ROS by 3-nitropropionic acid. Mech Ageing Dev. 2003;124:733–746. doi: 10.1016/s0047-6374(03)00083-6. [DOI] [PubMed] [Google Scholar]
- Huang LS, Sun G, Cobessi D, Wang AC, Shen JT, Tung EY, Anderson VE, Berry EA. 3-Nitropropionic acid is a suicide inhibitor of mitochondrial respiration that, upon oxidation by complex II, forms a covalent adduct with a catalytic base arginine in the active site of the enzyme. J Biol Chem. 2006;281:5965–5972. doi: 10.1074/jbc.M511270200. [DOI] [PMC free article] [PubMed] [Google Scholar]
- Imlay JA. A metabolic enzyme that rapidly produces superoxide, fumarate reductase of Escherichia coli. J Biol Chem. 1995;270:19767–19777. [PubMed] [Google Scholar]
- Jarreta D, Orus J, Barrientos A, Miro O, Roig E, Heras M, Moraes CT, Cardellach F, Casademont J. Mitochondrial function in heart muscle from patients with idiopathic dilated cardiomyopathy. Cardiovasc Res. 2000;45:860–865. doi: 10.1016/s0008-6363(99)00388-0. [DOI] [PubMed] [Google Scholar]
- Kim GW, Chan PH. Oxidative stress and neuronal DNA fragmentation mediate age-dependent vulnerability to the mitochondrial toxin, 3-nitropropionic acid, in the mouse striatum. Neurobiol Dis. 2001;8:114–126. doi: 10.1006/nbdi.2000.0327. [DOI] [PubMed] [Google Scholar]
- King MP, Attardi G. Human cells lacking mtDNA: repopulation with exogenous mitochondria by complementation. Science. 1989;246:500–503. doi: 10.1126/science.2814477. [DOI] [PubMed] [Google Scholar]
- Kuramochi T, Hirawake H, Kojima S, Takamiya S, Furushima R, Aoki T, Komuniecki R, Kita K. Sequence comparison between the flavoprotein subunit of the fumarate reductase (complex II) of the anaerobic parasitic nematode, Ascaris suum and the succinate dehydrogenase of the aerobic, free-living nematode, Caenorhabditis elegans. Mol Biochem Parasitol. 1994;68:177–187. doi: 10.1016/0166-6851(94)90163-5. [DOI] [PubMed] [Google Scholar]
- Lambert AJ, Brand MD. Inhibitors of the quinone-binding site allow rapid superoxide production from mitochondrial NADH:ubiquinone oxidoreductase (complex I) J Biol Chem. 2004;279:39414–39420. doi: 10.1074/jbc.M406576200. [DOI] [PubMed] [Google Scholar]
- Ludolph AC, He F, Spencer PS, Hammerstad J, Sabri M. 3-Nitropropionic acid-exogenous animal neurotoxin and possible human striatal toxin. Can J Neurol Sci. 1991;18:492–498. doi: 10.1017/s0317167100032212. [DOI] [PubMed] [Google Scholar]
- Mandavilli BS, Boldogh I, Van Houten B. 3-Nitropropionic acid induced hydrogen peroxide, mitochondrial DNA damage and cell death are attenuated by Bcl-2 overexpression in PC12 cells. Mol Brain Res. 2005;133:215–223. doi: 10.1016/j.molbrainres.2004.10.033. [DOI] [PubMed] [Google Scholar]
- Messner KR, Imlay JA. In vitro quantitation of biological superoxide and hydrogen peroxide generation. Methods Enzymol. 2002;349:354–361. doi: 10.1016/s0076-6879(02)49351-2. [DOI] [PubMed] [Google Scholar]
- Minamikawa T, Williams DA, Bowser DN, Nagley P. Mitochondrial permeability transition and swelling can occur reversibly without inducing cell death in intact human cells. Exp Cell Res. 1999;246:26–37. doi: 10.1006/excr.1998.4290. [DOI] [PubMed] [Google Scholar]
- Mogami M, Hida H, Hayashi Y, Kohri K, Kodama Y, Gyun Jung C, Nishino H. Estrogen blocks 3-nitropropionic acid-induced [Ca2+]i increase and cell damage in cultured rat cerebral endothelial cells. Brain Res. 2002;956:116–125. doi: 10.1016/s0006-8993(02)03488-1. [DOI] [PubMed] [Google Scholar]
- Moroney PM, Scholes TA, Hinkle PC. Effect of membrane potential and pH gradient on electron transfer in cytochrome oxidase. Biochemistry. 1984;23:4991–4997. doi: 10.1021/bi00316a025. [DOI] [PubMed] [Google Scholar]
- Okun JG, Lummen P, Brandt U. Three classes of inhibitors share a common binding domain in mitochondrial complex I (NADH:ubiquinone oxidoreductase) J Biol Chem. 1999;274:2625–2630. doi: 10.1074/jbc.274.5.2625. [DOI] [PubMed] [Google Scholar]
- Paddenberg R, Ishaq B, Goldenberg A, Faulhammer P, Rose F, Weissmann N, Braun-Dullaeus RC, Kummer W. Essential role of complex II of the respiratory chain in hypoxia-induced ROS generation in the pulmonary vasculature. Am J Physiol Lung Cell Mol Physiol. 2000;284:L710–L719. doi: 10.1152/ajplung.00149.2002. [DOI] [PubMed] [Google Scholar]
- Pocernich CB, Fai Poon H, Boyd-Kimball D, Lynn BC, Nath A, Klein JB, Butterfield DA. Proteomic analysis of oxidatively modified proteins induced by the mitochondrial toxin 3-nitropropionic acid in human astrocytes expressing the HIV protein tat. Brain Res Mol Brain Res. 2005;133:299–306. doi: 10.1016/j.molbrainres.2004.10.024. [DOI] [PubMed] [Google Scholar]
- Royall JA, Ischiropoulos H. Evaluation of 2′,7′-dichlorofluorescin and dihydrorhodamine 123 as fluorescent probes for intracellular H2O2 in cultured endothelial cells. Arch Biochem Biophys. 1993;302:348–355. doi: 10.1006/abbi.1993.1222. [DOI] [PubMed] [Google Scholar]
- Ryu JK, Nagai A, Kim J, Lee MC, McLarnon JG, Kim SU. Microglial activation and cell death induced by the mitochondrial toxin 3-nitropropionic acid: in vitro and in vivo studies. Neurobiol Dis. 2003;12:121–132. doi: 10.1016/s0969-9961(03)00002-0. [DOI] [PubMed] [Google Scholar]
- Salerno JC, Ohnishi T. Studies on the stabilized ubisemiquinone species in the succinate-cytochrome c reductase segment of the intact mitochondrial membrane system. Biochem J. 1980;192:769–781. doi: 10.1042/bj1920769. [DOI] [PMC free article] [PubMed] [Google Scholar]
- Smeitink J, Sengers R, Trijbels F, van den Heuvel L. Human NADH:ubiquinone oxidoreductase. J Bioenerg Biomembr. 2001;33:259–266. doi: 10.1023/a:1010743321800. [DOI] [PubMed] [Google Scholar]
- Stefanova N, Reindl M, Neumann M, Haass C, Poewe W, Kahle PJ, Wenning GK. Oxidative stress in transgenic mice with oligodendroglial alpha-synuclein overexpression replicates the characteristic neuropathology of multiple system atrophy. Am J Pathol. 2005;166:869–876. doi: 10.1016/s0002-9440(10)62307-3. [DOI] [PMC free article] [PubMed] [Google Scholar]
- Sun F, Huo X, Zhai Y, Wang A, Xu J, Su D, Bartlam M, Rao Z. Crystal structure of mitochondrial respiratory membrane protein complex II. Cell. 2005;121:1043–1057. doi: 10.1016/j.cell.2005.05.025. [DOI] [PubMed] [Google Scholar]
- Takamiya S, Matsui T, Taka H, Murayama K, Matsuda M, Aoki T. Free-living nematodes Caenorhabditis elegans possess in their mitochondria an additional rhodoquinone, an essential component of the eukaryotic fumarate reductase system. Arch Biochem Biophys. 1999;371:284–289. doi: 10.1006/abbi.1999.1465. [DOI] [PubMed] [Google Scholar]
- Tang HL, Trumpower BL. Triphasic reduction of cytochrome b and the protonmotive Q cycle pathway of electron transfer in the cytochrome bc1 complex of the mitochondrial respiratory chain. J Biol Chem. 1986;261:6209–6215. [PubMed] [Google Scholar]
- Trounce IA, Kim YL, Jun AS, Wallace DC. Assessment of mitochondrial oxidative phosphorylation in patient muscle biopsies, lymphoblasts, and transmitochondrial cell lines. Methods Enzymol. 1996;264:484–509. doi: 10.1016/s0076-6879(96)64044-0. [DOI] [PubMed] [Google Scholar]
- Trumpower BL. The protonmotive Q cycle. Energy transduction by coupling of proton translocation to electron transfer by the cytochrome bc1 complex. J Biol Chem. 1990;265:11409–11412. [PubMed] [Google Scholar]
- Trumpower BL, Katki A. Effect of bathophenanthroline and carbonylcyanide-m-chlorophenyl hydrazone on cytochrome c reductase activity of resolved succinate cytochrome c reductase complex. Biochem Biophys Res Commun. 1975;62:282–288. doi: 10.1016/s0006-291x(75)80135-5. [DOI] [PubMed] [Google Scholar]
- Tunez I, Montilla P, Del Carmen Munoz M, Feijoo M, Salcedo M. Protective effect of melatonin on 3-nitropropionic acid-induced oxidative stress in synaptosomes in an animal model of Huntington's disease. J Pineal Res. 2004;37:252–256. doi: 10.1111/j.1600-079X.2004.00163.x. [DOI] [PubMed] [Google Scholar]
- Votyakova TV, Reynolds IJ. DeltaPsi(m)-dependent and - independent production of reactive oxygen species by rat brain mitochondria. J Neurochem. 2001;79:266–277. doi: 10.1046/j.1471-4159.2001.00548.x. [DOI] [PubMed] [Google Scholar]
- Vrablic AS, Albright CD, Craciunescu CN, Salganik RI, Zeisel SH. Altered mitochondrial function and overgeneration of reactive oxygen species precede the induction of apoptosis by 1-O-octadecyl-2-methyl-rac-glycero-3-phosphocholine in p53-defective hepatocytes. FASEB J. 2001;15:1739–1744. doi: 10.1096/fj.00-0300com. [DOI] [PubMed] [Google Scholar]
- Wang J, Green PS, Simpkins JW. Estradiol protects against ATP depletion, mitochondrial membrane potential decline and the generation of reactive oxygen species induced by 3-nitroproprionic acid in SK-N-SH human neuroblastoma cells. J Neurochem. 2001;77:804–811. doi: 10.1046/j.1471-4159.2001.00271.x. [DOI] [PubMed] [Google Scholar]
- Yu L, Xu JX, Haley PE, Yu CA. Properties of bovine heart mitochondrial cytochrome b560. J Biol Chem. 1987;262:1137–1143. [PubMed] [Google Scholar]
- Zhao H, Kalivendi S, Zhang H, Joseph J, Nithipatikom K, Vasquez-Vivar J, Kalyanaraman B. Superoxide reacts with hydroethidine but forms a fluorescent product that is distinctly different from ethidium: potential implications in intracellular fluorescence detection of superoxide. Free Radic Biol Med. 2003;34:1359–1368. doi: 10.1016/s0891-5849(03)00142-4. [DOI] [PubMed] [Google Scholar]
- Zhou M, Diwu Z, Panchuk-Voloshina N, Haugland RP. A stable nonfluorescent derivative of resorufin for the fluorometric determination of trace hydrogen peroxide: applications in detecting the activity of phagocyte NADPH oxidase and other oxidases. Anal Biochem. 1997;253:162–168. doi: 10.1006/abio.1997.2391. [DOI] [PubMed] [Google Scholar]