Abstract
A major parameter limiting immune responses to vaccination is the number of activated antigen-presenting cells (APC) that capture antigen and migrate to draining lymph nodes (LN). Currently, a quantitative noninvasive technique for monitoring in vivo antigen capture and delivery is lacking. The use of cellular magnetic resonance (MR) imaging (MRI) is a promising approach for this purpose; however, cellular imaging currently requires ex vivo prelabeling of cells with contrast agents followed by reintroduction of cells into the subject being monitored. Here, we describe an in vivo labeling method, which relies upon cell-to-cell transfer of super-paramagnetic iron oxide (SPIO) from tumor cells to endogenous APCs, in situ, to quantify APC delivery to LNs in a tumor vaccine model. Mice were immunized with a tumor cell–based vaccine that was irradiated and labeled with SPIO. APCs that had captured SPIO were imaged over time as they accumulated in LNs. We show here that MRI is capable of monitoring, in vivo, the trafficking of magnetically labeled APCs inducing a tumor-specific immune response, and that these cells can be magnetically recovered ex vivo. Excellent correlation was observed between in vivo and ex vivo quantification of APCs, with resolution sufficient to detect increased APC trafficking elicited by an adjuvant. This study shows the potential of magnetovaccination and MRI cell tracking to systematically evaluate a key parameter relevant to the optimization of vaccine therapies through noninvasive MRI-based quantification of APC numbers.
Introduction
Despite a wealth of knowledge about the many parameters that regulate the host immune response to cancer, clinical translation of effective therapeutic vaccines has not yet been convincingly achieved (1–4). Clearly, there is a need for understanding the immunologic basis of individual successes or failures. Tools to quantify key intermediate biological end points that can be targeted for optimization will greatly assist in the development of more effective cancer immunotherapy strategies.
For effective tumor vaccine therapy, dendritic cells (DC) must migrate from the site of antigen delivery via afferent lymphatics to present captured antigens to T cells located within lymph nodes (LN). The numbers of DCs that ultimately end up in the T-cell zone have been shown to determine the magnitude of T-cell proliferation and effector response (5). High DC number increases the probability of DC–T-cell encounters, delivers a sustained stimulation through successive interactions, and reduces competition among T cells (6, 7). Conversely, low numbers of poorly stimulatory DCs induce abortive T-cell proliferation and tolerance (8–10). Therefore, effective migration of DCs to the secondary lymphoid organs remains an essential step for vaccine efficacy and efficient monitoring of DC migration by a noninvasive method will play a critical role in the development of successful cellular therapeutics (11).
Conventionally, DC imaging using magnetic resonance imaging (MRI) has relied upon ex vivo labeling of the cells of interest with an MRI visible contrast agent such as superparamagnetic iron oxide (SPIO; refs. 12–15). To monitor the trafficking of these cells by MRI, they require maturation and loading with antigens ex vivo as well as incubation with iron oxides. After these procedures, the cells must be reintroduced into a patient in a manner that provides sufficient delivery of the cells. Early clinical trials have shown this method can be effective, but there are still a number of variables that need to be evaluated and controlled such as DC generation, use of different DC subsets, route of administration, optimal conditioning and activation stimuli, antigen loading, and selection of tumor-derived antigens (16). Among these, the most critical parameter is the number of injected cells that successfully migrate from the injection site to the appropriate regions of the draining LNs.
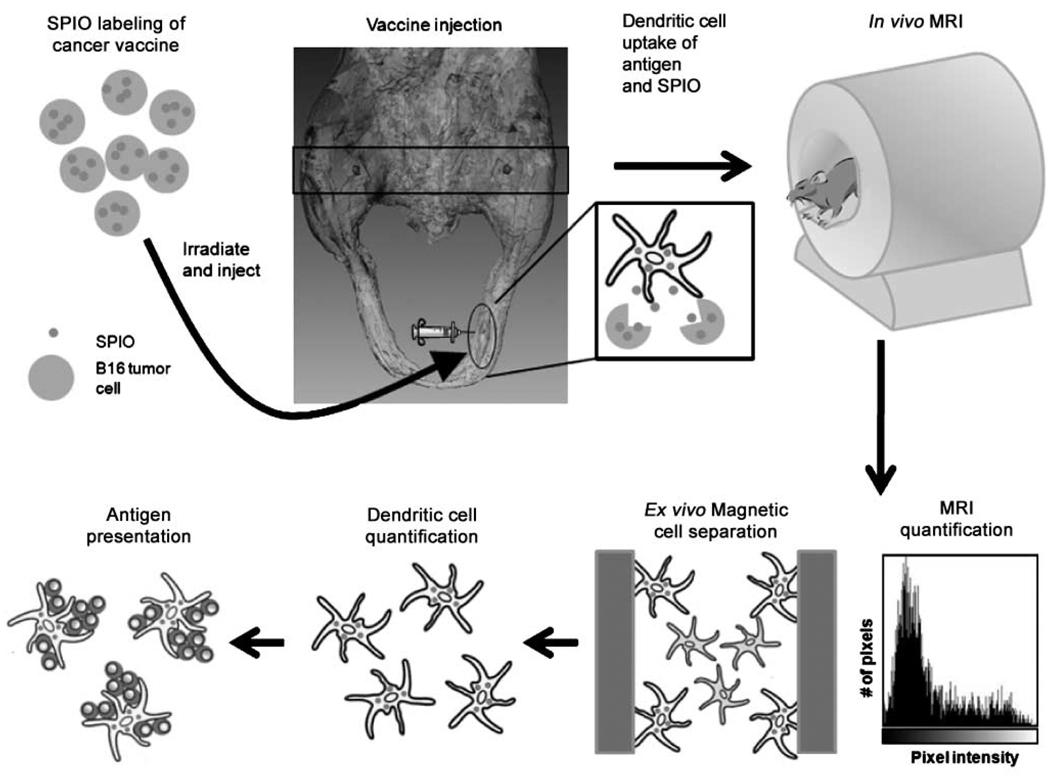
We describe a methodology for in vivo cell tracking that relies upon endogenously generated immunosurveillant DCs and uses irradiated whole tumor cells engineered to secrete granulocyte-macrophage colony stimulating factor (GM-CSF) as an antigen source for vaccination (17, 18). Paracrine GM-CSF produced by the injected cells induces the differentiation and recruitment of DCs to the immunotherapy injection sites and has been shown to induce humoral as well as T-cell–mediated antitumor immunity (19). Taking advantage of the fact that immature DCs naturally sample their surroundings and are specifically equipped with receptors that mediate the capture of apoptotic material and soluble antigens (20), dying tumor cells were loaded with SPIO to produce a system capable of monitoring endogenous DC trafficking after vaccination (Fig. 1). DC capture of antigen/SPIO allowed the imaging and quantification of DC trafficking in vivo as well as the magnetic isolation of the DC populations that have processed the relevant immunogens and initiated the immune response. We show that MRI, because of its high resolution and excellent soft tissue contrast, is ideally suited to monitor antigen uptake and delivery by DCs.
Figure 1.
Schematic outline of study protocol. Clockwise from top left, magnetovaccine is injected into the footpads of C57BL/6 mice. DCs survey the site of the vaccination, are labeled in vivo by capture of SPIO associated with apoptotic material released from labeled tumor cells, and traffic to popliteal LNs where axial images (black rectangle) are later obtained by MRI (top right). After imaging, the MR signal is quantified, the LNs are resected, and single-cell suspensions are magnetically separated. FACS analysis and T-cell proliferation assays are then conducted with magnetically separated cells.
Materials and Methods
Mice
Female 6- to 8-wk-old C57BL/6 mice were obtained from Harlan. Transgenic mice expressing a T-cell receptor specific for Tyrosinase-Related Protein- 1 were a generous gift of the Restifo laboratory, Surgery Branch, NIH, and have recently been described (21). All experiments involving the use of mice were performed in accordance with protocols approved by the Animal Care and Use Committee of the Johns Hopkins University School of Medicine.
Tumor cells
MHC class I–negative, C57BL/6-derived murine melanoma cell lines B78H1-GM-CSF (22) and B16 were maintained in RPMI 1640 supplemented with 10% fetal bovine serum, penicillin-streptomycin (50 U/mL), l-glutamine (2 mmol/L), HEPES buffer (5 mmol/L), nonessential amino acids, and 2-mercaptoethanol (100 µmol/L; complete medium) and grown at 37°C in a humidified 5% CO2 atmosphere. Additionally, B78H1-GM-CSF cells were maintained in high dose hygromycin (1,200 µg/mL) to assure high levels of GM-CSF expression, which averaged 1 µg GM-CSF/106 cells/24 h.
Preparation of SPIO-labeled tumor cells
For magnetic-labeling of tumor cells, B16 melanoma cells were irradiated with 10,000 rads and incubated for 18 h in a culture medium containing a ferumoxides injectable solution (335 µg Fe per milliliter; Feridex; Berlex Laboratories). Initial studies comparing magnetoelectroporated cells were labeled as described previously (23). The tumor cells were washed thrice in PBS to remove any excess particles.
Iron labeling efficiency was verified by Prussian blue staining and antidextran staining (24). Total iron content of SPIO-labeled cells was assessed by a Ferrozin-based spectrophotometric assay after acid digestion of labeled cell samples (25). The iron content was ~ 8 pg of iron per cell. Cell viability was determined by trypan blue staining, showing comparable viability (>90%) for unlabeled tumor cells and SPIO-labeled tumor cells (data not shown).
Magnetovaccine
B78H1-GM-CSF cells were harvested, washed thrice in ice-cold HBSS and irradiated with 5,000 rads, counted, and combined with SPIO-labeled or nonlabeled irradiated B16 tumor cells. GM-CSF vaccines were formulated as a 10:1 mixture of B16 melanoma cells with B78H1-GM-CSF cells and consisted of 1 × 10⁶ mixed tumor cells in a total volume of 25 µL HBSS. This formulation results in the paracrine delivery of ~ 100 ng GM-CSF/106 B16 cells per 24 h. The vaccine was given intradermally into both hind footpads of anesthetized C57BL/6 mice (i.p. injection of ketamine/xylazine in PBS). For imiquimod treatment experiments, footpads were given 10 µL of a 5% imiquimod cream formulation or control (Aldara; 3M Pharmaceuticals, St) 30 min after vaccine injection.
MRI
MRI was performed on a 9.4 T Bruker Biospec horizontal bore spectrometer equipped with an actively RF-decoupled coil system. Mice were anesthetized by isoflurane inhalation (1–2%) and immobilized in a horizontal volume coil. In vivo magnetic resonance images were obtained with a two-dimensional T2*-weighted multigradient echo sequence [flip angle, 90°; repetition time, 1,000 ms; echo time, 4 ms, 4 echoes, 8 averages; total acquisition time, 38 min, 14 slices (0.35 mm thickness; resolution, 0.10 × 0.10 mm)]. In addition to T2*-weighted images, which are very sensitive to SPIO-induced magnetic susceptibility effects, RARE spin echo images at corresponding slice locations, with identical resolution, were also acquired (repetition time, 2.1 s; echo time, 60 ms, 4 averages; total acquisition time, 4 min, RARE factor, 8) as a reference control to ensure that the decreased signal intensity originated from the magnetic field inhomogeneities caused by SPIO.
MRI analysis
For each MR image, a region of interest was manually selected for each popliteal LN using the SE image. These region of interests were then copied into the MGE image of the corresponding slice, and a pixel intensity histogram was created using ImageJ software. Pixel intensity histograms were also created for adjacent muscle tissue and the darkest pixels were chosen to represent a low signal threshold for “black pixel” determination. This calibration was done slice by slice for each image containing a LN. LN pixels falling below this minimum pixel intensity were summated for all slices and we present these values as black pixels. For all calculations, black pixel status was defined on day 4 postvaccine.
In addition to black pixel calculations, color composite images were created for imiquimod-treated mice to visualize the extent of DC trafficking in blacked out nodes. Again, SE images were used to delineate the borders of LNs and these borders were then copied into MGE images. ImageJ software was used to create color composites of the LNs, and these composites were overlain on the same MGE image they were created from.
DC isolation
Single-cell suspensions were made from popliteal LNs of vaccinated mice on either day 3 or day 5 postvaccination by mechanical disruption and filtration through nylon mesh. Cells were pooled washed in PBS and then run over MACS MS columns (Miltenyi Biotec) for SPIO-positive cell selection. For optimal enrichment, this process was repeated to minimize the number of SPIO− cells. Of the SPIO-negative fraction, CD11c+ cells were isolated using CD11c-coated magnetic beads (Miltenyi Biotec) and MACS MS columns.
Antibodies and flow cytometry
Antibodies for immunostaining and flow cytometry were anti-dextran anti-CD11c (FITC), anti-CD11b (phycoerythrin), anti–I-Ab (biotin conjugated), anti-B220 (phycoerythrin), anti-NK1.1 (APC), and streptavidin (APC). Anti-dextran was obtained from Stem Cell Technologies. All other antibodies were purchased from BD Biosciences. Intracellular staining for dextran was performed using the Cytofix/Cytoperm kit (Pharmingen). All fluorescence-activated cell sorting (FACS) analysis was performed on a FACSCalibur (Becton Dickinson) and analyzed using CellQuest software (Becton Dickinson).
Proliferation assay
Single cell lymphocyte suspensions were made from spleens of tyrp-1−/−RAG −/− mice by mechanical disruption over nylon mesh. Tyrp-1 transgenic CD4+ T cells were enriched by removing CD8+ T cells and B220+/MHCII+ cells, as previously described (26). In brief, cells were incubated with biotinylated antibodies against CD8+, B220+, and MHCII+ cells. Cells were then removed by incubation with streptavidin-conjugated magnetic beads (Dynal) and magnetic separation. The CD4+ T-cell–enriched (5 × 10⁴ per well) lymphocytes from above were mixed with SPIO-positive cells and CD11c-positive cells from both nonvaccinated LNs and SPIO-negative cell fractions of vaccinated LNs at the indicated ratios. All APCs were irradiated with 2,000 rads before addition. Tyrp-1106–130 peptide was added to appropriate wells at 100 µg/mL. Seventy-hours hours after incubation, cells were pulsed with [3H] thymidine [1 µCi per well (0.037 MBq)] and cultured for 12 h before harvesting and measuring scintillation counts.
Results
Vaccine labeling properties
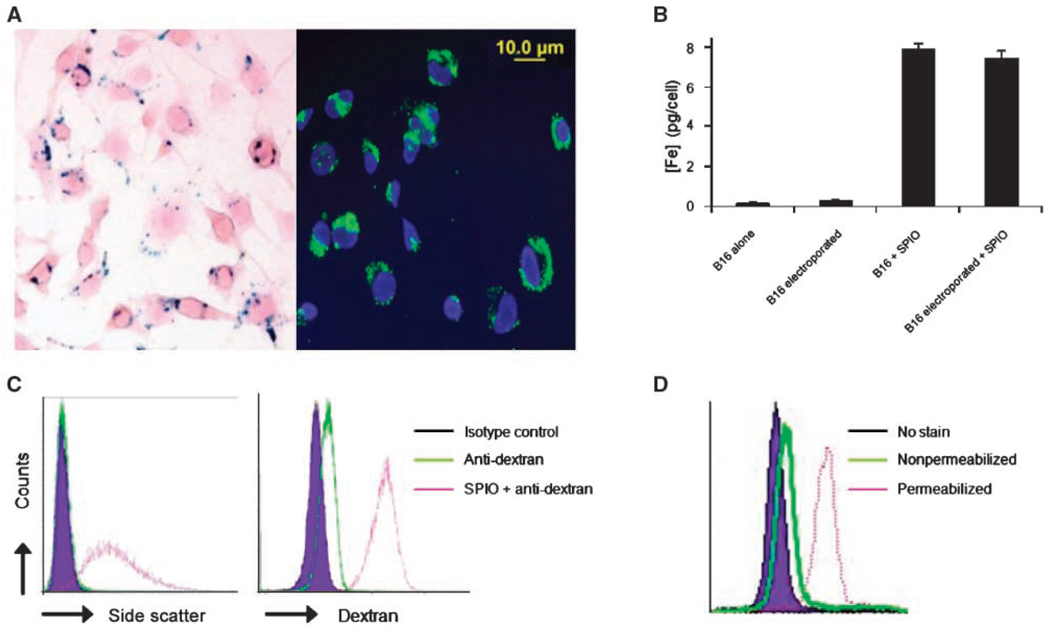
To evaluate the potential for SPIO particles to track antigen transfer by MR imaging, the ability of B16 melanoma tumor cells to efficiently endocytose the dextran-coated particles was first examined. Prussian Blue iron staining as well as FITC anti-dextran staining showed that these cells were capable of high levels of SPIO uptake and that a similar labeling efficiency was obtained with or without magnetoelectroporation (Fig. 2A–B; ref. 23). To confirm that tumor cells were homogeneously labeled and that SPIO particles predominantly resided within intracellular compartments, staining with anti-dextran antibody was performed with or without cellular permeabilization. A lack of anti-dextran staining in nonpermeabilized cells showed a primarily intracellular distribution of the SPIO particles that were readily detected in permeabilized cells as a clear shift in fluorescence and side scatter, indicating that all cells were labeled (Fig. 2C–D).
Figure 2.
SPIO labeling of B16 melanoma cells after overnight incubation. A, the amount of SPIO present in B16 cells was visualized with Prussian Blue and FITC-anti-dextran staining. B, a Ferrozin-based spectrophotometric iron assay was used to calculate the mean concentration of Fe per cell. Columns, mean of three independent experiments done in triplicate; bars, SD from the mean. C, FACS analysis of side scatter profile and FITC-anti-dextran intracellular staining of B16 melanoma cells indicate that nearly all cells are labeled with SPIO. D, FITC-anti-dextran staining of SPIO-labeled cells with or without permeabilization shows that SPIO labeling is predominantly localized to intracellular compartments.
MRI detection of DCs in draining LNs
With the aim of assessing whether DCs could be labeled and tracked in vivo, a SPIO-labeled vaccine mixture was injected into the hind footpads of C57BL/6 mice (Fig. 1). Mice were imaged with MRI immediately after and each day after the vaccine injections. The popliteal LNs were monitored for signs of APC migration from the vaccine site using a T2*-weighted multigradient echo MR sequence (Fig. 1). Additionally, a fat suppression pulse was added to eliminate any chemical shift artifacts caused by the position of the popliteal LN in a surrounding fat pad. With these imaging parameters in place, a generally bright appearance for the LNs surrounded by a dark region of fat was anticipated. Within the nodes, any decrease in signal intensity (i.e., darkening) would indicate the presence of SPIO-labeled cells.
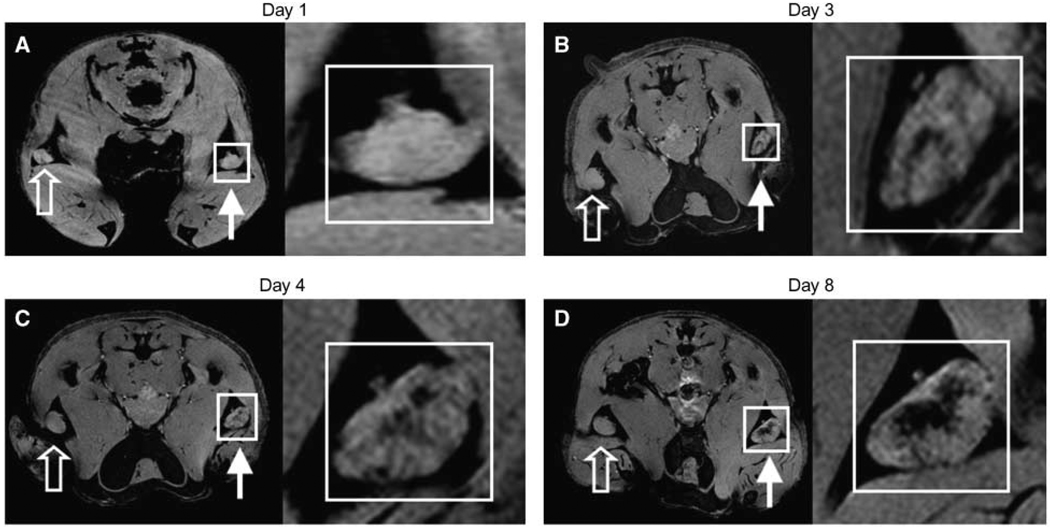
Approximately 3 days after the mice were injected with SPIO-labeled GM-CSF vaccine cells, localized hypointense regions within the LNs could be defined, indicating the presence of SPIO-labeled cells (Fig. 3B). This negative signal persisted and, in some cases, became more abundant, until day 8 (Fig. 3C and D). As expected, no signal dropout was seen in popliteal nodes corresponding to unlabeled vaccines. The presence of SPIO was never detected before the third day postvaccination, indicating that this SPIO content was likely transported actively by cells rather that arriving passively as free SPIO in lymphatic flow. In fact, the injection of free (noncell associated) SPIO resulted in the rapid appearance of signal that was localized to the subcapsular region of the LNs (Supplementary Fig. S1A–C), a distribution that is consistent with previous reports (13). In contrast, after injection of SPIO-labeled tumor cells, the signal appeared later and was centrally located within the node (Supplementary Fig. S1D–F and Supplementary Video S1), supporting the active cell transfer of SPIO in this model. This does not, however, rule out the possibility that SPIO and antigen could have been delivered partially by diffusion or by transmission from migrating DCs to “resident” DCs (27).
Figure 3.
In vivo MRI monitoring the trafficking of cells that have taken up SPIO in vivo after intradermal injection of GM-CSF tumor cell vaccine into footpads of mice. Right, for each day, magnifications of corresponding insets in A, B, C, and D, respectively. Open arrows, draining popliteal LNs from footpads receiving unlabeled GM-CSF vaccines. Closed arrows, draining popliteal LNs from footpads receiving SPIO-labeled GM-CSF vaccines. On multigradient echo images, SPIO-containing LNs have decreased signal intensity. A, neither popliteal LNs show any evidence of hypointensities (day 1). B, decreased signal intensity apparent in LN corresponding to popliteal LN of SPIO labeled vaccine (day 3). C and D, at day 4 and day 8, respectively, the signal decrease persists and actually increases in popliteal LN. Images representative of three independent experiments with five mice each.
SPIO+ cells in the LNs are functional APCs
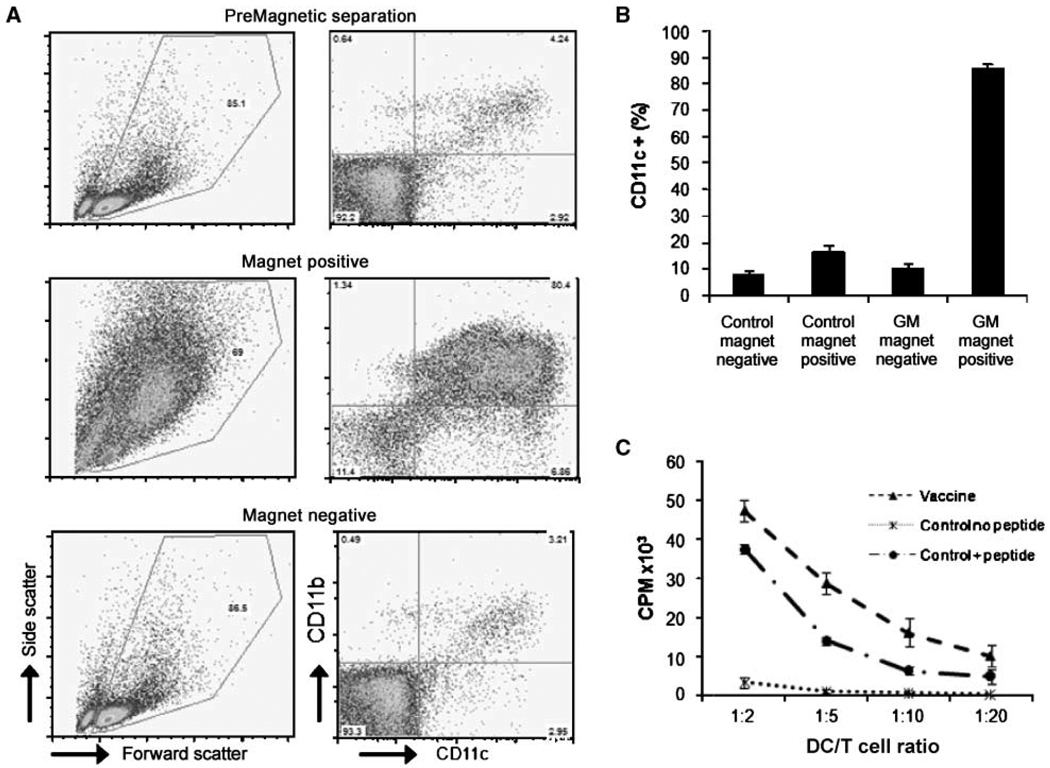
To determine whether SPIO detected in the draining LN was associated with functional APCs, 10 mice were immunized, and 3 days postvaccination, popliteal LNs were isolated and single-cell suspensions were obtained. A fraction of cells were stained for both CD11c and CD11b. The remaining unstained cells were applied to a magnetic cell sorting column, and cells from both magnet-positive and magnet-negative fractions were subsequently stained. Both premagnetic and postmagnetic cell separation fractions were then analyzed by flow cytometry. The magnetic cell separation process enriched the DC population by over 12-fold (Fig. 4A and B). This enrichment of CD11c+ and CD11b+ cells indicates that DCs constitute the major population of cells that take up SPIO (Supplementary Fig. S2) and that the MR images have a strong correlation with DC trafficking. Additionally, this simple magnetic cell separation illustrates a major utility of this system to isolate only those cells that have captured material initially contained by the vaccine.
Figure 4.
Phenotypic and functional characterization of popliteal LN single-cell suspensions. GM groups were given SPIO-labeled vaccines and control groups were from unvaccinated LNs. A, after LN resection, single-cell suspensions were magnetically separated. Both magnet-positive and magnet-negative fractions were analyzed by FACS for expression of DC markers CD11b and CD11c (GM group is shown). Cells containing SPIO (magnet positive) displayed high levels of DC markers as well as an increased forward versus side scatter profile. B, FACS analysis of DC markers CD11b and CD11c display a strong magnetic enrichment of DCs after foot pad injection of SPIO-labeled vaccines. Columns, mean of five experiments; bars, SD. C, proliferation assay using tyrp-1 transgenic CD4+ T cells cocultured with magnet-positive cells versus CD11c-sorted, nonvaccinated DCs with or without tyrp-1106–130 peptide. The graph shows the cpm after [3H]-thymidine incorporation and is representative of 3 experiments. Points, mean of triplicates; bars, SD.
To verify that the isolated cells were in fact responsible for stimulating the immune response, magnet-enriched (SPIO+) cells were tested for their ability to activate transgenic CD4 T-cells specific for an antigen expressed by B16 melanoma cells (tyrp-1). SPIO+ cells isolated from mice 3 days after magnetovaccination induced these tyrp-1–specific T cells to undergo robust proliferation ex vivo (Fig. 4C). Whereas these cells most likely represent the APCs that captured antigen at the vaccine site, the possibility of secondary presentation by resident DCs should not be discounted (27). The specificity of T-cell responses were verified by the observation that irradiated control DCs pulsed with the relevant peptide tyrp (106–130) stimulated the transgenic T cells. Tumor antigen-specific T-cell proliferation induced by SPIO+ cells indicates a colocalization between captured tumor antigen and SPIO by APCs in this system, confirming that the MR images are not simply demonstrating DC trafficking from the site of the vaccine but also reflecting the accumulation of cells that present antigen in the draining LN.
Imiquimod enhances DC trafficking into draining LNs
It has been previously shown that murine DCs injected into imiquimod-treated skin resulted in maturation and migration of these DCs (28). To evaluate the capacity of MR imaging to detect differences in DC trafficking, the properties of the Toll Like Receptor 7 agonist imiquimod were exploited to induce DC trafficking. Mice were given magnetovaccine in both footpads, and imiquimod was applied to the right footpad and a control lotion was applied to the left footpad of each mouse 30 minutes postvaccine. Mice were either followed serially for 9 days by MRI or sacrificed after 3 days for magnetic cell separation of LN cells and DC quantification.
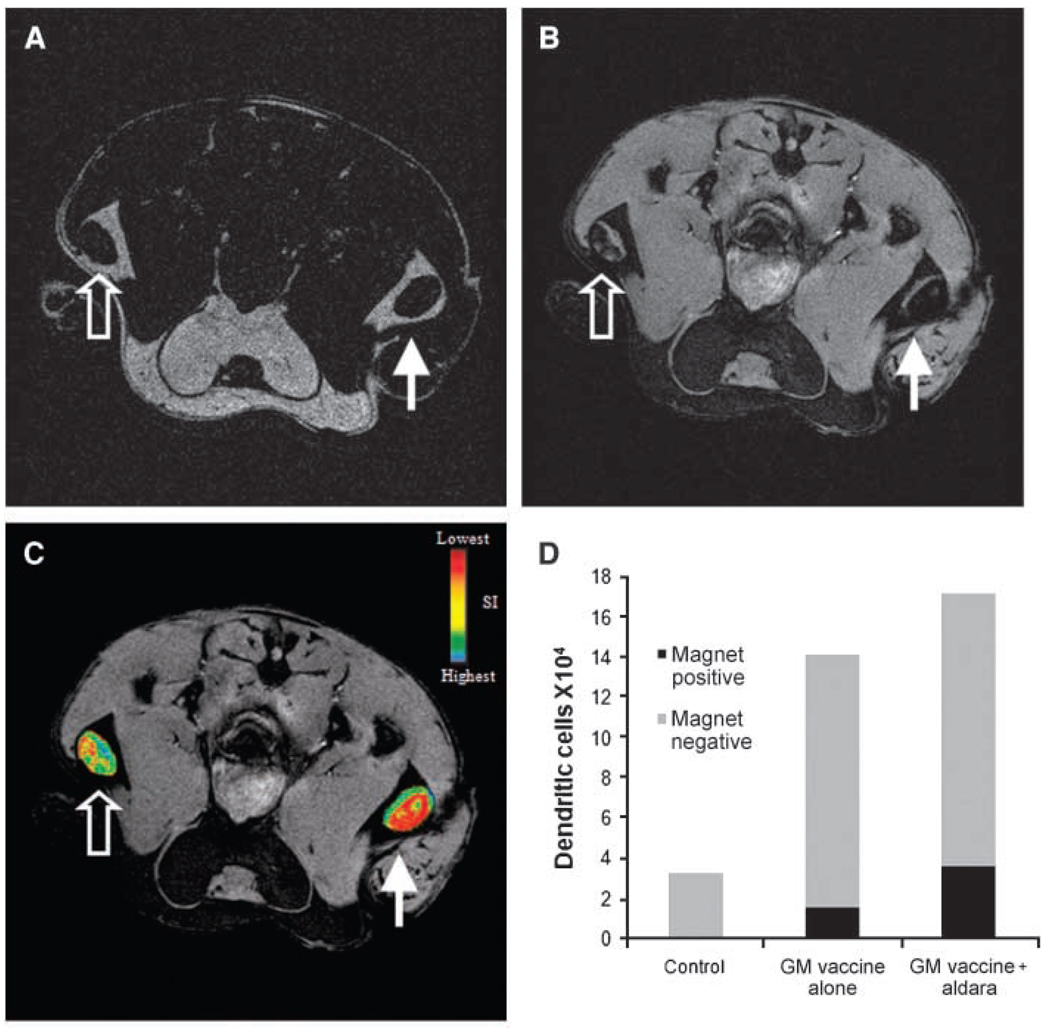
As depicted in Fig. 5, the application of imiquimod resulted in a modest enhancement in trafficking of DCs to the popliteal LN. In spite of this modest adjuvant effect, the sensitivity of MR imaging was such that many LNs draining the imiquimod-treated sites were nearly completely blacked out by the increased signal (Fig. 5B–C). MR detection of enhanced trafficking of these antigen bearing DCs into the draining popliteal LN was confirmed by magnetic cell separation (Fig. 5D). In some cases, the number of magnet+ DCs found in the imiquimod-treated group was double that of the control group; however, this response was highly variable. These results show that imiquimod enhances DC migration in the setting of GM-CSF tumor cell vaccination. More importantly, they establish that MRI detection of DC trafficking has sufficient resolution and sensitivity to evaluate a key attribute of an immune adjuvant.
Figure 5.
DC trafficking after addition of the adjuvant imiquimod. Magnetovaccination was administered into the hind footpads of mice with one footpad receiving imiquimod cream (closed arrows) and the other receiving a control (open arrows). A, RARE spin echo axial image of popliteal LNs 7 d postvaccination. RARE spin echo technique is much less sensitive to SPIO and allows the borders of each LN to be clearly visualized. B, MGE axial image of popliteal LNs after vaccination in same location as under A showing decreased signal intensity in each LN, with a greater decrease observed on the side of the imiquimod-treated footpad. C, spin echo image in A was used to create regions of interest for each LN. These regions of interest were used to create signal intensity maps for each LN, and the resulting maps were overlain on the MGE image shown in B to display the extent of DC trafficking. D, total SPIO-positive and SPIO-negative DC counts per LN from popliteal LNs after injection of PBS, GM-CSF vaccine, or GM-CSF vaccine plus addition of imiquimod cream. DC numbers were calculated by multiplying CD11c+ fraction by total cell population retrieved from each group. Twenty LNs were pooled per group and the average taken. Graph is representative of three experiments.
Black pixel count provides DC quantification in LNs
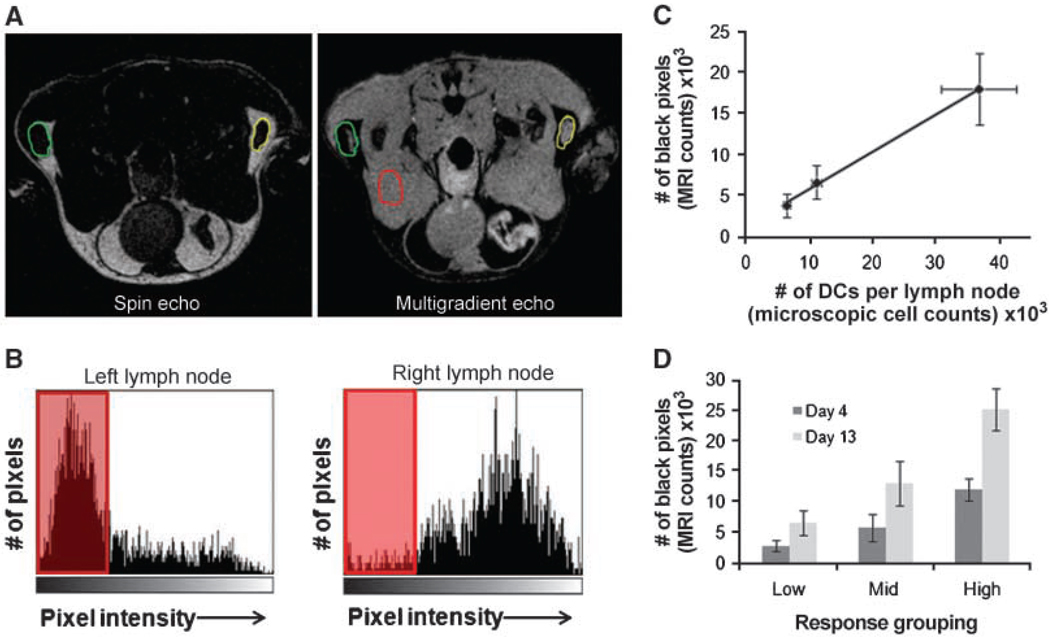
To assess the ability to monitor natural biological variability in this system, mice were given magnetovaccine, and 4 days postvaccination, all mice were imaged by MRI. Pixels with a signal intensity decreaseing below a defined threshold (black pixels; see Materials & Methods) were calculated for each popliteal LN. Figure 6A shows how the LN borders were delineated using a combination of SE and MGE images. Figure 6B displays histograms from the corresponding left and right LNs seen in Fig. 6A. These nodes serve as an example of high versus low levels of black pixels. Within 12 hours of the last scan, each popliteal LN was removed and pooled with LNs of similar black pixel counts. Pooling, rather than individual LN analysis, was performed due to the limitations of magnetic separation using small numbers of cells. Those nodes with counts above 10,000 black pixels were grouped as “High pixel nodes,” 5,000 to 10,000 black pixels were considered “Mid pixel nodes,” and any node containing <5,000 black pixels was placed in the “Low pixel” group. Single-cell suspensions were made from these pools, and cells were run over MACS columns to isolate the SPIO+ cells. After flow cytometric analysis, CD11c+CD11b+ DCs were enumerated for each group. As the number of black pixels increased between groups, the corresponding number of SPIO+ DCs present in each LN group sharply increased as well (Fig. 6C). These results show the strong correlation between black pixel count and the number of DCs that have presumably captured antigen and trafficked to the LN. Additionally, when these mice were followed past day 4 to investigate the possibility of delayed DC trafficking in our system, there was no significant change in response status as measured by black pixel counts (Fig. 6D). The absolute number of black pixels did increase in each group, but the general response trend remained the same. These results give a sobering depiction of the intrinsic biological variability found between subjects seemingly treated identically, and provide a tool with which to monitor this key parameter in the profoundly more variable setting of the clinic.
Figure 6.
Black pixel and DC number correlation. Identical GM-CSF tumor vaccines were injected into both right and left footpads of 15 C57BL/6 mice. After 4 d, each mouse was imaged and black pixels were quantified as discussed in Materials and Methods. A, SE image of mouse with both LNs highlighted (left) and a MGE image (right) with SE region of interest overlain on each LN. B, histograms showing left and right LN pixel distributions and those pixels decreasing below the threshold (shaded red). Note that very few pixels in the right LN fell below the threshold. C, correlation (R2 = 0.998) between the number of black pixels and number of DCs per LN showing a strong positive correlation between the two values. Points, mean of 2 independent experiments done with 15 mice each; bars, SD. D, black pixel values for mice followed serially after vaccination. Mice evaluated on day 13 postvaccination were placed in same response grouping as initially determined on day 4. A similar response trend was found even at the later time point. Columns, mean of 2 independent experiments done with 10 mice each; bars, SD.
Discussion
We are not alone in recognizing that the design of optimal vaccine therapies could be facilitated by technologies for monitoring cell trafficking. Techniques have been developed to use many different imaging modalities for the purpose of in vivo cell tracking (29–31). In fact, DC tracking using MRI has been proposed by other groups in the past (12, 13, 15). However, previous MRI-based approaches used an in vitro labeling method that relied upon the reintroduction of DCs to the subject. The efficacy of this approach is highly dependent on the administered route and is strictly limited to DC immunization (15). In contrast, we have concluded that accurate detection of DCs in vivo can be achieved after in vivo SPIO labeling of the endogenous DC pool generated in response to the injected vaccine. More specifically, our method relies on cell-to-cell transfer of SPIO from SPIO-labeled tumor cells to those DCs responsible for initiating the antitumor immune response. Although the current technique is particularly applicable to the many forms of immunotherapy under development that use cells as the source of antigen, in principle, SPIO labeling of other forms of antigen formulated into vaccines is certainly conceivable. In the current system, SPIO capture by DCs is akin to tumor antigen capture and, therefore, is the first example of what might be thought of as “antigen tracking” using MRI.
In this study, we have shown that the number of antigen-bearing DCs in the draining LNs, although quite high compared with other studies (32, 33), still comprises only a small proportion of the total DCs found in the draining LN. Even with imiquimod, where the highest number of antigen-bearing DCs was observed, only ~ 15% of all the DCs in the LN were composed of those that had taken up SPIO and antigen, further underscoring the potential bottle-neck imposed by antigen delivery to LN in many vaccine systems. Even more striking is the variability found within the same vaccination group when pooled based on black pixel counts. The range of DCs traveling to the draining LNs ranged from ~ 5,000 DCs to as many as 40,000, representing a range of biological variation that approaches 8-fold. This biological variation in antigen delivery almost certainly manifests itself as variability in individuals’ response to the therapy, and it represents a parameter that is ripe for optimization with newer vaccine formulations and adjuvants. The current methodology should provide an invaluable tool to prospectively monitor this variability in preclinical as well as clinical studies and provide a real-time readout of the effect of new approaches to improve antigen delivery. In theory, this technique could even be combined with nuclear imaging agents to increase the quantitative capabilities or with optical imaging reporters to show DC viability over time.
The methodologies described here represent one of many steps needed to exploit noninvasive imaging techniques to aid in the challenge of systematically evaluating the many variables pertinent to active forms of immunotherapy. This study provides evidence that it is possible to accurately monitor the frequency of antigen-bearing DCs that migrate from vaccine sites to the draining LNs. We have shown that cells need not be ex vivo labeled to be imaged noninvasively by MRI. Our labeling method is not only capable of quantifying the DC response to tumor vaccines but has also proven to be sensitive enough to evaluate immune adjuvant potency as well. Additionally, the magnetic label permits experimental sorting of cells involved in initiating the immune response in vivo. Magnetovaccination should open many new avenues for monitoring the immune response to exogenously added cells and adjuvants by way of magnetic sorting and viewing, noninvasively, the dynamics of DC migration in vivo.
Footnotes
Note: Supplementary data for this article are available at Cancer Research Online (http://cancerres.aacrjournals.org/).
Disclosure of Potential Conflicts of Interest
No potential conflicts of interest were disclosed.
References
- 1.Gattinoni L, Powell DJ, Jr, Rosenberg SA, Restifo NP. Adoptive immunotherapy for cancer: building on success. Nat Rev Immunol. 2006;6:383–393. doi: 10.1038/nri1842. [DOI] [PMC free article] [PubMed] [Google Scholar]
- 2.Ribas A, Butterfield LH, Glaspy JA, Economou JS. Current developments in cancer vaccines and cellular immunotherapy. J Clin Oncol. 2003;21:2415–2432. doi: 10.1200/JCO.2003.06.041. [DOI] [PubMed] [Google Scholar]
- 3.Ridgway D. The first 1000 dendritic cell vaccinees. Cancer Invest. 2003;21:873–886. doi: 10.1081/cnv-120025091. [DOI] [PubMed] [Google Scholar]
- 4.Rosenberg SA, Yang JC, Restifo NP. Cancer immunotherapy: moving beyond current vaccines. Nat Med. 2004;10:909–915. doi: 10.1038/nm1100. [DOI] [PMC free article] [PubMed] [Google Scholar]
- 5.MartIn-Fontecha A, Sebastiani S, Hopken UE, et al. Regulation of dendritic cell migration to the draining lymph node: impact on T lymphocyte traffic and priming. J Exp Med. 2003;198:615–621. doi: 10.1084/jem.20030448. [DOI] [PMC free article] [PubMed] [Google Scholar]
- 6.Kedl RM, Kappler JW, Marrack P. Epitope dominance, competition and T cell affinity maturation. Curr Opin Immunol. 2003;15:120–127. doi: 10.1016/s0952-7915(02)00009-2. [DOI] [PubMed] [Google Scholar]
- 7.Smith AL, Wikstrom ME, Fazekas de St Groth B. Visualizing T cell competition for peptide/MHC complexes: a specific mechanism to minimize the effect of precursor frequency. Immunity. 2000;13:783–794. doi: 10.1016/s1074-7613(00)00076-5. [DOI] [PubMed] [Google Scholar]
- 8.Bonifaz L, Bonnyay D, Mahnke K, Rivera M, Nussenzweig MC, Steinman RM. Efficient targeting of protein antigen to the dendritic cell receptor DEC-205 in the steady state leads to antigen presentation on major histocompatibility complex class I products and peripheral CD8+ T cell tolerance. J Exp Med. 2002;196:1627–1638. doi: 10.1084/jem.20021598. [DOI] [PMC free article] [PubMed] [Google Scholar]
- 9.Hernandez J, Aung S, Redmond WL, Sherman LA. Phenotypic and functional analysis of CD8(+) T cells undergoing peripheral deletion in response to cross-presentation of self-antigen. J Exp Med. 2001;194:707–717. doi: 10.1084/jem.194.6.707. [DOI] [PMC free article] [PubMed] [Google Scholar]
- 10.Kurts C, Kosaka H, Carbone FR, Miller JF, Heath WR. Class I-restricted cross-presentation of exogenous self-antigens leads to deletion of autoreactive CD8(+) T cells. J Exp Med. 1997;186:239–245. doi: 10.1084/jem.186.2.239. [DOI] [PMC free article] [PubMed] [Google Scholar]
- 11.Adema GJ, de Vries IJ, Punt CJ, Figdor CG. Migration of dendritic cell based cancer vaccines: in vivo veritas? Curr Opin Immunol. 2005;17:170–174. doi: 10.1016/j.coi.2005.01.004. [DOI] [PubMed] [Google Scholar]
- 12.Ahrens ET, Flores R, Xu H, Morel PA. In vivo imaging platform for tracking immunotherapeutic cells. Nat Biotechnol. 2005;23:983–987. doi: 10.1038/nbt1121. [DOI] [PubMed] [Google Scholar]
- 13.Baumjohann D, Hess A, Budinsky L, Brune K, Schuler G, Lutz MB. In vivo magnetic resonance imaging of dendritic cell migration into the draining lymph nodes of mice. Eur J Immunol. 2006;36:2544–2555. doi: 10.1002/eji.200535742. [DOI] [PubMed] [Google Scholar]
- 14.Bulte JW, Kraitchman DL. Iron oxide MR contrast agents for molecular and cellular imaging. NMR Biomed. 2004;17:484–499. doi: 10.1002/nbm.924. [DOI] [PubMed] [Google Scholar]
- 15.de Vries IJ, Lesterhuis WJ, Barentsz JO, et al. Magnetic resonance tracking of dendritic cells in melanoma patients for monitoring of cellular therapy. Nat Biotechnol. 2005;23:1407–1413. doi: 10.1038/nbt1154. [DOI] [PubMed] [Google Scholar]
- 16.Figdor CG, de Vries IJ, Lesterhuis WJ, Melief CJ. Dendritic cell immunotherapy: mapping the way. Nat Med. 2004;10:475–480. doi: 10.1038/nm1039. [DOI] [PubMed] [Google Scholar]
- 17.Huang AY, Bruce AT, Pardoll DM, Levitsky HI. In vivo cross-priming of MHC class I-restricted antigens requires the TAP transporter. Immunity. 1996;4:349–355. doi: 10.1016/s1074-7613(00)80248-4. [DOI] [PubMed] [Google Scholar]
- 18.Huang AY, Golumbek P, Ahmadzadeh M, Jaffee E, Pardoll D, Levitsky H. Role of bone marrow-derived cells in presenting MHC class I-restricted tumor antigens. Science. 1994;264:961–965. doi: 10.1126/science.7513904. [DOI] [PubMed] [Google Scholar]
- 19.Dranoff G, Jaffee E, Lazenby A, et al. Vaccination with irradiated tumor cells engineered to secrete murine granulocyte-macrophage colony-stimulating factor stimulates potent, specific, and long-lasting anti-tumor immunity. Proc Natl Acad Sci U S A. 1993;90:3539–3543. doi: 10.1073/pnas.90.8.3539. [DOI] [PMC free article] [PubMed] [Google Scholar]
- 20.Itano AA, McSorley SJ, Reinhardt RL, et al. Distinct dendritic cell populations sequentially present antigen to CD4 T cells and stimulate different aspects of cell-mediated immunity. Immunity. 2003;19:47–57. doi: 10.1016/s1074-7613(03)00175-4. [DOI] [PubMed] [Google Scholar]
- 21.Muranski P, Boni A, Antony PA, et al. Tumor-specific Th17-polarized cells eradicate large established melanoma. Blood. 2008;112:362–373. doi: 10.1182/blood-2007-11-120998. [DOI] [PMC free article] [PubMed] [Google Scholar]
- 22.Levitsky HI, Lazenby A, Hayashi RJ, Pardoll DM. In vivo priming of two distinct antitumor effector populations: the role of MHC class I expression. J Exp Med. 1994;179:1215–1224. doi: 10.1084/jem.179.4.1215. [DOI] [PMC free article] [PubMed] [Google Scholar]
- 23.Walczak P, Kedziorek DA, Gilad AA, Lin S, Bulte JW. Instant MR labeling of stem cells using magnetoelectroporation. Magn Reson Med. 2005;54:769–774. doi: 10.1002/mrm.20701. [DOI] [PubMed] [Google Scholar]
- 24.Bulte JW, Arbab AS, Douglas T, Frank JA. Preparation of magnetically labeled cells for cell tracking by magnetic resonance imaging. Methods Enzymol. 2004;386:275–299. doi: 10.1016/S0076-6879(04)86013-0. [DOI] [PubMed] [Google Scholar]
- 25.Bulte JW, Douglas T, Witwer B, et al. Magneto-dendrimers allow endosomal magnetic labeling and in vivo tracking of stem cells. Nat Biotechnol. 2001;19:1141–1147. doi: 10.1038/nbt1201-1141. [DOI] [PubMed] [Google Scholar]
- 26.Lu Z, Yuan L, Zhou X, Sotomayor E, Levitsky HI, Pardoll DM. CD40-independent pathways of T cell help for priming of CD8(+) cytotoxic T lymphocytes. J Exp Med. 2000;191:541–550. doi: 10.1084/jem.191.3.541. [DOI] [PMC free article] [PubMed] [Google Scholar]
- 27.Allan RS, Waithman J, Bedoui S, et al. Migratory dendritic cells transfer antigen to a lymph node-resident dendritic cell population for efficient CTL priming. Immunity. 2006;25:153–162. doi: 10.1016/j.immuni.2006.04.017. [DOI] [PubMed] [Google Scholar]
- 28.Nair S, McLaughlin C, Weizer A, et al. Injection of immature dendritic cells into adjuvant-treated skin obviates the need for ex vivo maturation. J Immunol. 2003;171:6275–6282. doi: 10.4049/jimmunol.171.11.6275. [DOI] [PubMed] [Google Scholar]
- 29.Baumjohann D, Lutz MB. Non-invasive imaging of dendritic cell migration in vivo. Immunobiology. 2006;211:587–597. doi: 10.1016/j.imbio.2006.05.011. [DOI] [PubMed] [Google Scholar]
- 30.Blocklet D, Toungouz M, Kiss R, et al. 111In-oxine and 99mTc-HMPAO labelling of antigen-loaded dendritic cells: in vivo imaging and influence on motility and actin content. Eur J Nucl Med Mol Imaging. 2003;30:440–447. doi: 10.1007/s00259-002-1001-4. [DOI] [PubMed] [Google Scholar]
- 31.De Vries IJ, Krooshoop DJ, Scharenborg NM, et al. Effective migration of antigen-pulsed dendritic cells to lymph nodes in melanoma patients is determined by their maturation state. Cancer Res. 2003;63:12–17. [PubMed] [Google Scholar]
- 32.Porgador A, Irvine KR, Iwasaki A, Barber BH, Restifo NP, Germain RN. Predominant role for directly transfected dendritic cells in antigen presentation to CD8+ T cells after gene gun immunization. J Exp Med. 1998;188:1075–1082. doi: 10.1084/jem.188.6.1075. [DOI] [PMC free article] [PubMed] [Google Scholar]
- 33.Garg S, Oran A, Wajchman J, et al. Genetic tagging shows increased frequency and longevity of antigen-presenting, skin-derived dendritic cells in vivo. Nat Immunol. 2003;4:907–912. doi: 10.1038/ni962. [DOI] [PubMed] [Google Scholar]


