

Abstract
We measured changes in gene expression, induced by aging and caloric restriction (CR), in three hippocampal subregions. When analysis included all regions, aging was associated with expression of genes linked to mitochondrial dysfunction, inflammation, and stress responses, and in some cases, expression was reversed by CR. An age-related increase in ubiquintination was observed, including increased expression of ubiquitin conjugating enzyme genes and cytosolic ubiquitin immunoreactivity. CR decreased cytosolic ubiquitin and upregulated deubiquitinating genes. Region specific analyses indicated that CA1 was more susceptible to aging stress, exhibiting a greater number of altered genes relative to CA3 and the dentate gyrus (DG), and an enrichment of genes related to the immune response and apoptosis. CA3 and the DG were more responsive to CR, exhibiting marked changes in the total number of genes across diet conditions, reversal of age-related changes in p53 signaling, glucocorticoid receptor signaling, and enrichment of genes related to cell survival and neurotrophic signaling. Finally, CR differentially influenced genes for synaptic plasticity in CA1 and CA3. It is concluded that regional disparity in response to aging and CR relates to differences in vulnerability to stressors, the availability of neurotrophic, and cell survival mechanisms, and differences in cell function.
Keywords: aging, diet, hippocampus, transcription, proteosome, ubiquitin
1. Introduction
Brain aging processes are enormously complex affecting multiple systems, cell types, and cellular pathways. Gene expression studies attempt to estimate the status of critical parameters for multiple cellular processes that change with age. Examination of gene expression in brain tissue over the lifespan indicates alterations in general aging processes including inflammation, oxidative stress, Ca2+ regulation, and cell growth/structural organization (Aenlle et al., 2009; Blalock et al., 2003; Erraji-Benchekroun et al., 2005; Prolla, 2002; Terao et al., 2002).
Caloric restriction (CR) is the most accepted approach to slow the aging process and delay or prevent many age-related diseases (Mattson and Wan, 2005; Weindruch et al., 1988). A review of transcription changes associated with CR indicates that there are no common genes or groups of genes which are influenced by CR across different species (Han and Hickey, 2005). Indeed, for studies that examine gene changes across tissues, even in the same animal, only a handful of genes may emerge as sensitive to treatment (Fu et al., 2006; Selman et al., 2006; Swindell, 2008). Differences may be related to whether the cells in the tissue are post-mitotic (Spindler and Dhahbi, 2007), the function of the tissues examined, and the effects of aging on the tissue (Weindruch et al., 2002).
While much work has focused on peripheral organs and lifespan, little is known concerning the effects of CR on the nervous system. There are some indications that CR improves motor and cognitive function in aged animals (Carter et al., 2009; Fontan-Lozano et al., 2007; Ingram et al., 1987; Pitsikas and Algeri, 1992) and in models of neurodegeneration (Bruce-Keller et al., 1999; Halagappa et al., 2007). The hippocampus is a region that is particularly sensitive to aging, resulting in impaired synaptic plasticity and memory deficits (Foster, 1999; Foster, 2007). The three main regions of the hippocampus include the CA1, CA3, and dentate gyrus (DG). These regions differ in terms of efferents, afferents and major cell types (Knowles, 1992), neurogenesis (Ormerod et al., 2008; Pawluski et al., 2009), vulnerability to stressors (Jackson and Foster, 2009; Jackson et al., 2009; McEwen, 2001), and synaptic plasticity mechanisms (Hussain and Carpenter, 2005; McBain, 2008; Zalutsky and Nicoll, 1990). In addition, differences have been noted concerning biological markers of aging within these regions, including altered synaptic function and response to stress (Foster, 2002; Jackson et al., 2009; McEwen, 2001; Patrylo and Williamson, 2007; Rosenzweig and Barnes, 2003). The current study was designed to determine whether CR had a similar effect in these three closely-linked regions and whether CR would act on genes related to biological markers of aging in the hippocampus such as inflammation, stress, and mitochondrial dysfunction.
2. Materials and methods
2.1 Animals
All procedures involving animals were approved by the Institutional Animal Care and Use Committee of the University of Florida. Ad libitum (AL) fed and calorie restricted (CR) male F344xBN rats were obtained from the National Institute on Aging (NIA) rodent colony. Reduction of calorie intake began at 14 weeks of age starting with 10%, 25%, and finally 40% restriction at 17 weeks until the end of the experiment. Animals were maintained in our facility for approximately one month prior to tissue collection. All animals had free access to water and AL fed rats had free access to NIH-31 pellets. For CR animals, the dietary regimen of 40% restriction was maintained, with food delivered at 1700 hours each evening. Animals were assessed on a weekly basis for signs of overt health problems including marked weight loss. For gene arrays, middle aged (MA) and old (O) animals (18 and 28 months (mo) of age, respectively) were employed. In general, biological variability increases with advanced age (Busuttil et al., 2007; Foster and Kumar, 2007); therefore, the number of animals in the older groups was increased in order to increase the power of the study. The groups consisted of AL-MA (n = 3), AL-O (n = 6), and CR-O (n = 6). Due to the limited supply of CR rats at specific ages, western blots were performed for 8 mo AL, 38 mo AL and 38 mo CR animals (n = 3 per group). Ubiquitin-like immunofluorescence was examined in the brains of an 18 mo AL, 38 mo AL, and 38 mo CR rat.
2.2 RNA isolation and gene chips
On the day of tissue collection, animals were killed using a guillotine. Brains were quickly removed and placed on an ice-cold Petri dish. Brains were then bisected, making a dorsal to ventral incision along the midline such that the two hemispheres were separated. The neocortex of each hemisphere was then resected in order to expose and remove the hippocampus using forceps and a spatula and 2–3 tissue blocks of the dorsal hippocampus were cut parallel to the alvear fibers (~1 mm thick) using a razor blade. The blocks were laid flat and the subiculum was removed. An incision was made from the CA3-CA1 border to the end of the upper and lower blades of the dentate gyrus (DG) in order to isolate the CA3 region, and an incision through the hippocampal fissure was used to separate the DG and CA1 regions. Tissue from each region was placed into separate tubes and immediately snap-frozen in liquid nitrogen. Tissue samples from three regions of the hippocampus (CA1, CA3, DG) were removed from storage at −80° C and homogenized for 30 seconds in 600μL of RLT buffer using a Rotor-stator homogenizer. Following centrifugation for 3 minutes at maximum speed the supernatant was transferred to a new tube and an equal volume of 70% ethanol was added, the solution was then applied to a Qiagen RNeasy mini column and isolated according to the manufacturer’s protocol. Purified RNA was labeled and hybridized to RAE 230 V2.0 gene chips by the NIH core facility. The chips were scanned with an Affymtrix GeneChip Scanner 3000, and the raw data, publicly available through the NIH neuroscience microarray consortium (http://arrayconsortium.tgen.org/np2/viewProject.do?action=viewProject&projectId=522821) and the NCBI gene expression omnibus Accession No. GSE21681, were processed with Affymetrix GCOS software.
2.3 Data analysis
For the 15 animals (AL-MA = 3, AL-O = 6, and CR-O = 6), one chip was hybridized per region (CA1, CA3, DG) per animal, resulting in 45 arrays. Array outliers were identified by dChip and performance in leave-one-out-cross validation studies; two arrays (one CR-O for CA1 and one CR-O for CA3) were removed from the study due to poor hybridization. Probe set filtering was performed according to our previously published work (Aenlle and Foster, 2009; Aenlle et al., 2009; Blalock et al., 2003). Microarray Suite (Affymetrix) was used to determine whether a particular probe was reliably detectable (presence/absence calls). The number of present calls for each probe set was determined across all chips and the probe set was removed if fewer than 80% of the chips exhibited a present call for the probe. Normalization and computation of gene expression values were performed using the perfect-match-only method by inputting data (.cel files) into dChip (Li and Wong, 2001). Unsupervised hierarchical cluster analyses were performed with probe sets that exhibited hybridization signal intensities with a coefficient of variation of greater than 0.5 identified using algorithms implemented in dChip. Statistical algorithms implemented in BRB array tools (version 3.5.0-beta 1, developed by Richard Simon, Amy Peng Lam, Supriya Menezes, NCI and EMMES Corp.) were used to identify probe sets whose hybridization signal intensity values differed between experimental groups (alpha level set at p < 0.001) and calculate the false discovery rate (FDR). The ability of significant genes to distinguish between treatment groups was assessed by leave-one-out-cross-validation studies. The ability of gene expression classifiers to correctly predict the class label of the array left out of the analysis was estimated using Monte Carlo simulations. Functional pathways associated with pools of significantly altered probe sets were identified using Ingenuity Pathway Analysis (IPA, Ingenuity Systems, Redwood City, CA). Fischer’s exact test was used to calculate a p-value determining the probability that each pathway assigned to that data set is due to chance alone. In addition, BRB array tools was used to calculate the largest observed/expected ratios in specific gene ontology (GO) categories for cellular component, molecular function, and biological process that were associated with the significantly altered probe sets.
2.4 Western blot analyses
For total protein analyses, the CA1, CA3, or DG regions were dissected from hippocampi. Samples were homogenized with an ultrasonic cell disrupter (Misonix Incorporated; Farmingdale, NY) in SDS sample buffer (62.5 mM Tris, pH6.8, 10% glycerol, 3% SDS) supplemented with complete protease inhibitor (Roche, Indianapolis, IN). A BCA kit (Pierce, Rockford, IL) was used to determine the protein concentration of the supernatant. Samples were fractionated by SDS-gel electrophoresis using Ready Precast Gradient 8–16% SDS-polyacrylamide gels with 20 μg protein loaded per well. Following fractionation, proteins were transferred to a nitrocellulose (0.45 μm pore size) or a PVDF (for pUbi) (Bio-Rad, Hercules, CA) membrane overnight at 4°C and a constant voltage of 35 V. Blots were blocked for one hour with Tris-buffered saline containing 0.05% Tween (TBST) and 5% nonfat dry milk. After blocking, the blots were incubated overnight at 4°C with the following primary antibodies: Ubiquitin (rabbit polyclonal; Dako, Carpinteria, CA); UBE2J1 (mouse monoclonal; Santa Cruz Biotechnology Inc, Santa Cruz, CA); HSP90 (rabbit polyclonal; Cell signaling, Danvers, MA); HSP70 (rabbit polyclonal; Stressgen, Ann Arbor, MI); HSP40 (rabbit polyclonal; Stressgen); HSP27 (goat polyclonal; Santa Cruz); Glyceraldehyde-3-phosphate dehydrogenase (GAPDH) (mouse monoclonal; EnCor Biotechnology, Alachua, FL). After incubation with anti-rabbit, anti-mouse (Cell signaling), or anti-goat horseradish peroxidase conjugated secondary antibodies (Sigma-Aldrich, St. Louis, MO), membranes were reacted with an enhanced chemiluminescent substrate (Perkin Elmer Life Sciences; Boston, MA). A GS-710 densitometer (Bio-Rad Laboratories) was then used to digitally image the films. Densitometric analyses were made using the ImageJ 1.42q computer program (Wayne Rasband, National Institutes of Health, USA). Since many endogenous control markers are affected by aging and caloric restriction, fold change values for these experimental variables were calculated by normalizing to the 8 mo AL control signal, however, GAPDH staining is provided in order to illustrate consistency of gel-loading. Films were formatted for printing using Adobe Photoshop. Significant changes in western blot densitometry between groups were determined by two-tailed student’s t-tests.
2.5 Immunolabeling
For examination of ubiquitin-like immunofluorescence, the brains were bisected through the central sulcus and half of each brain was immediately frozen in liquid nitrogen. Coronal cryosections (5 μm thickness) were collected on Superfrost Plus glass slides (Fisher), and allowed to air dry for 1 h. Slides were then fixed in 4% paraformaldehyde in PBS for 15 min., permeabilized in ice-cold methanol for 5 min. at −20° C, rinsed with PBS and blocked in 20 % goat serum in PBS plus 0.05% Triton X-100 for 1 hour at room temperature. Sections were incubated with the indicated primary antibodies overnight at 4°C. Bound anti-ubiquitin antibodies were detected with Alexa Fluor 594 (Molecular Probes, Eugene, OR). Hoechst dye (Molecular Probes) was included in the secondary antibody solution to visualize nuclei. Slides were mounted with cover slips using Antifade Kit (Molecular Probes). Samples were imaged with a Spot camera attached to a Nikon Eclipse E800 microscope (Melville, NY) and were formatted for printing by using Adobe Photoshop software.
3. Results
3.1 Gene expression changes induced by aging and CR indicate region-specific sensitivity
Filtering the data resulted in 24,244 probes sets in which at least 80% of the arrays exhibited a present call. To examine generalized gene expression changes throughout the hippocampus with age, we included arrays across all three regions from AL-MA and AL-O animals. This regionally-combined analysis revealed 4,821 probe sets (FDR = 0.005) that were altered by aging. In addition, we determine the number of probes that exhibited altered expression within each region of the hippocampus,. The number of probe sets that change with age (p<0.001) more than double between the DG (898, FDR = 0.027) and CA1 regions (2,141, FDR = 0.01) (Figure 1), suggesting that region CA1 may be more susceptible to the effects of age. The effect of age on region CA3 (1,461, FDR = 0.016) was intermediate as compared with the other two.
Figure 1.

Number of probe sets altered by CR in the hippocampus of rats aged 28 mo (AL-O versus CR-O) and across age (18 and 28 mo) in ad libitum fed rats (AL-MA versus AL-O). Numbers in the main panels (red) indicate the total probe sets altered by aging and CR in regions CA1 (upper left) and CA3 (upper right), the DG (lower left), and across all regions (Hipp, lower right). Numbers in the overlapping areas (green) indicate the number of probe sets altered by both treatments (i.e. overlapping probe sets). Arrows indicate the number of overlapping probe sets whose expression level was oppositely affected by age and CR. Above each circle is an indication of the number of arrays in each group involved in the analysis.
To determine gene expression changes due to lifelong CR, arrays were analyzed for probe sets that differed between CR-O and AL-O groups. When all regions were combined, 4,183 probe sets (FDR = 0.006) were significantly (p<0.001) altered by CR in the older animals (Figure 1). Interestingly, while the number of probe sets that changed with age increased between the DG and CA1, CR effects were in the opposite direction. Specifically, CR induced a > 6-fold increase in the number of altered probe sets in the DG (2,388, FDR = 0.01) relative to CA1 (349, FDR = 0.07) (Figure 1). The number of probes altered across the diet conditions for CA3 was 1,596 (FDR = 0.015). Thus, age differences, as determined by the number of altered genes, appear to be more pronounced in region CA1, whereas CR effects are magnified in the DG.
3.2 Pathway regulation during aging and CR
Table 1 illustrates the top GO categories for cellular component (CC), molecular function (MF), and biological process (BP), that exhibited gene enrichment in the hippocampus. In general, aging was associated with enrichment of genes in categories linked to energy homeostasis (glucose homeostasis, creatine kinase activity), oxidative stress (superoxide activity, heme oxidation, aconitate hydratase activity), and response to stress (DNA damage, MHC class II protein complex). CR was associated with an enrichment of genes for several metabolic pathways.
Table 1.
Results of GO analysis for age and CR
| Effect of Age | Effect of CR | ||||||
|---|---|---|---|---|---|---|---|
| CA1 | |||||||
| GO category | GO ID | GO Term | Ratio | GO category | GO ID | GO Term | Ratio |
| CC | 42613 | MHC class II protein complex | 4.46 | CC | 5891 | voltage-gated calcium channel complex | 6.76 |
| MF | 16527 | brain-specific angiogenesis inhibitor activity | 7.14 | MF | 8191 | metalloendopeptidase inhibitor activity | 19.67 |
| BP | 45582 | positive regulation of T cell differentiation | 4.45 | BP | 19233 | sensory perception of pain | 7.07 |
| BP | 30330 | DNA damage response, signal transduction by p53 class mediator | 4.45 | ||||
| CA3 | |||||||
| CC | 30864 | cortical actin cytoskeleton | 3.24 | CC | 35253 | ciliary rootlet | 6.99 |
| MF | 16527 | brain-specific angiogenesis inhibitor activity | 10.35 | MF | 5093 | Rab GDP-dissociation inhibitor activity | 9.9 |
| MF | 4757 | sepiapterin reductase activity | 10.35 | MF | 4740 | [pyruvate dehydrogenase (lipoamide)] kinase activity | 9.9 |
| BP | 48145 | regulation of fibroblast proliferation | 4.96 | BP | 6613 | cotranslational protein targeting to membrane | 4.96 |
| DG | |||||||
| CC | 5802 | trans-Golgi network | 3.88 | CC | 35253 | ciliary rootlet | 4.03 |
| MF | 4757 | sepiapterin reductase activity | 15.99 | MF | 4965 | GABA-B receptor activity | 7.23 |
| BP | 15802 | basic amino acid transport | 8.22 | MF | 4740 | [pyruvate dehydrogenase (lipoamide)] kinase activity | 7.23 |
| BP | 6596 | polyamine biosynthetic process | 4.95 | ||||
| Hippocampus | |||||||
| CC | 42613 | MHC class II protein complex | 3.34 | CC | 35253 | ciliary rootlet | 3.07 |
| CC | 30669 | clathrin-coated endocytic vesicle membrane | 3.34 | MF | 4965 | GABA-B receptor activity | 4.32 |
| CC | 30666 | endocytic vesicle membrane | 3.34 | MF | 4658 | propionyl-CoA carboxylase activity | 4.32 |
| CC | 30128 | clathrin coat of endocytic vesicle | 3.34 | MF | 4133 | glycogen debranching enzyme activity | 4.32 |
| CC | 30122 | AP-2 adaptor complex | 3.34 | MF | 4069 | aspartate transaminase activity | 4.32 |
| CC | 5666 | DNA-directed RNA polymerase III complex | 3.34 | BP | 6573 | valine metabolic process | 4.51 |
| MF | 16783 | sulfurtransferase activity | 3.35 | ||||
| MF | 16527 | brain-specific angiogenesis inhibitor activity | 3.35 | ||||
| MF | 8526 | phosphatidylinositol transporter activity | 3.35 | ||||
| MF | 4965 | GABA-B receptor activity | 3.35 | ||||
| MF | 4757 | sepiapterin reductase activity | 3.35 | ||||
| MF | 4558 | alpha-glucosidase activity | 3.35 | ||||
| MF | 4430 | 1-phosphatidylinositol 4-kinase activity | 3.35 | ||||
| MF | 4392 | heme oxygenase (decyclizing) activity | 3.35 | ||||
| MF | 4111 | creatine kinase activity | 3.35 | ||||
| MF | 3994 | aconitate hydratase activity | 3.35 | ||||
| BP | 19430 | removal of superoxide radicals | 3.53 | ||||
| BP | 6788 | heme oxidation | 3.53 | ||||
| BP | 1678 | cell glucose homeostasis | 3.53 | ||||
| BP | 389 | nuclear mRNA 3′-splice site recognition | 3.53 | ||||
For each category; cellular component (CC), molecular function (MF), and biological process (BP), the gene ontology groups with the largest observed/expected ratio (Ratio) are identified according to the GO ID and term.
In order to examine age and CR influences on signaling pathways, significantly altered gene expression within each region and for the regionally-combined analysis was submitted to IPA (Table 2). The results from the regionally-combined analysis confirmed previous work indicating that, throughout the hippocampus, aging was associated with altered expression of genes related to inflammation, mitochondrial dysfunction, stress, and neurodegenerative diseases (Aenlle et al., 2009; Blalock et al., 2003; Prolla, 2002; Weindruch et al., 2002). CR was associated with a downregulation of inflammatory marker genes (such as antigen presentation genes) (Morgan et al., 2007; Wu et al., 2008). In addition, aging was associated with an upregulation of genes involved with the protein ubiquitination pathway, while CR resulted in a mixture of up and down regulated genes for this protein quality control mechanism.
Table 2.
Pathways Altered by Caloric Restriction or Aging in the Hippocampus
| Aging |
Caloric Restriction |
||||||
|---|---|---|---|---|---|---|---|
| Pathway | P | Ratio | FC | Pathway | P | Ratio | FC |
|
CA1 | |||||||
| Estrogen Receptor Signaling | 0.000567 | 0.178 | +18,−3 | Synaptic Long Term Potentiation | 0.00635 | 0.054 | +5, −1 |
| NRF2-mediated Oxidative Stress Response | 0.000586 | 0.167 | +24, −6 | Neuregulin Signaling | 0.00927 | 0.055 | +2, −3 |
| Huntington’s Disease Signaling | 0.000994 | 0.147 | +29, −5 | Hepatic Fibrosis/Hepatic Stellate Cell Activation | 0.0105 | 0.046 | +4, −2 |
| IL-4 Signaling | 0.00322 | 0.191 | +11, −2 | Hypoxia Signaling in the Cardiovascular System | 0.0157 | 0.056 | +0, −4 |
| Apoptosis Signaling | 0.00359 | 0.184 | +13, −3 | Notch Signaling | 0.018 | 0.073 | +1, −2 |
| Insositol Phosphate Metabolism | 0.0137 | 0.121 | +6, −5 | ||||
| Antigen presentation | 0.0169 | 0.154 | +6, −0 | ||||
| IGF-1 Signaling | 0.0204 | 0.163 | +12, −3 | ||||
| p53 Signaling | 0.022 | 0.149 | +12, −1 | ||||
|
CA3 | |||||||
| p53 Signaling | 0.00446 | 0.138 | +11, −1 | Protein Ubiquitination Pathway | 0.00108 | 0.119 | +16, −8 |
| Hypoxia Signaling in the Cardiovascular System | 0.0048 | 0.155 | +10, −1 | IGF-1 Signaling | 0.00116 | 0.163 | +12, −3 |
| Parkinson’s signaling | 0.0115 | 0.235 | +4, −0 | ERK/MAPK Signaling | 0.00402 | 0.122 | +16, −6 |
| PI3K/AKT signaling | 0.0168 | 0.113 | +10, −4 | Hypoxia Signaling in the Cardiovascular System | 0.00494 | 0.155 | +8, −3 |
| Biosynthesis of Steroids | 0.0309 | 0.039 | +2, −3 | Synaptic Long Term Potentiation | 0.0109 | 0.135 | +12, −3 |
| Protein Ubiquitinatioin | 0.0326 | 0.094 | +17, −2 | Cardiac β2-adrenergic Signaling | 0.012 | 0.115 | +13, −2 |
| Amyotrophic Lateral Sclerosis Signaling | 0.0389 | 0.107 | +8, − 3 | Insulin Receptor Signaling | 0.0138 | 0.12 | +14, −2 |
| Oxidative Phosphorylation | 0.0155 | 0.095 | +9, −6 | ||||
| Chemokine Signaling | 0.0166 | 0.147 | +9, −2 | ||||
| Glucocorticoid Receptor Signaling | 0.017 | 0.095 | +14, −2 | ||||
| PI3K/AKT Signaling | 0.0186 | 0.113 | +12, −2 | ||||
|
DG | |||||||
| PI3K/AKT signaling | 0.000293 | 0.113 | +10, −4 | Oxidative Phosphorylation | 0.00389 | 0.133 | +14, −7 |
| Oxidative Phosphorylation | 0.0019 | 0.082 | +12, −1 | IL-2 Signaling | 0.0108 | 0.208 | +8, −3 |
| Mitochondrial Dysfunction | 0.00251 | 0.073 | +10, −2 | PTEN Signaling | 0.0154 | 0.163 | +7, −8 |
| Ubiquinone Biosynthesis | 0.00416 | 0.067 | +7, −3 | Estrogen Receptor Signaling | 0.0203 | 0.144 | +8, −9 |
| Ceramide Signaling | 0.0115 | 0.101 | +4, −4 | EGF Signaling | 0.0214 | 0.191 | +6, −3 |
| P53 Signaling | 0.0165 | 0.092 | +7, −1 | Nucleotide Excision Repair Pathway | 0.0254 | 0.2 | +1, −6 |
| GM-CSF Signaling | 0.0339 | 0.177 | +6, −5 | ||||
|
Hippocampus | |||||||
| Antigen Presentation Pathway | 0.0000729 | 0.308 | +12,-0 | Protein Ubiquitination Pathway | 0.0018 | 0.218 | +18, −26 |
| Mitochondrial Dysfunction | 0.000192 | 0.2 | +26, −7 | GM-CSF Signaling | 0.008 | 0.29 | +11, −7 |
| NRF2-mediated Oxidative Stress Response | 0.00157 | 0.244 | +38, −6 | Nucleotide Excision Repair Pathway | 0.0205 | 0.286 | +2, −8 |
| Amyloid Processing | 0.002 | 0.346 | +15, −3 | Synaptic Long Term Potentiation | 0.021 | 0.243 | +19, −8 |
| Integrin Signaling | 0.00499 | 0.24 | +34, −12 | Antigen Presentation Pathway | 0.066 | 0.179 | +1, −6 |
| Huntington’s Disease Signaling | 0.0063 | 0.211 | +42, −7 | ||||
| Ubiquinone Biosynthesis | 0.00755 | 0.144 | +13, −2 | ||||
| Protein Ubiquitination Pathway | 0.00937 | 0.208 | +32, −10 | ||||
Pathways significantly altered (p) by caloric restriction or aging, the ratio of significantly altered pathway genes to total pathway genes members, and the number of genes in the corresponding pathway that were upregulated (+FC) or downregulated (−FC).
Due to the large number of significant genes for age or CR when examined across all regions, these data sets were separated according to genes that were up or down regulated and these selective data sets were submitted to IPA. In order to limit the number of pathways examined, we selected a cut off of p < 0.001 for gene enrichment in the signaling pathways. The analysis indicated no significant gene clustering in pathways for down regulated genes associated with age or CR; although nucleotide excision repair and protein ubiquitination pathways for CR approached the cut off (p = 0.0025). An examination of up regulated genes during aging confirmed involvement of signaling for Huntington’s disease, amyloid processing, mitochondrial dysfunction, NRF2-mediated oxidative stress, and protein ubiquitination. In addition, the analysis indicated gene enrichment in a number of pathways, which was likely due to the common elements in Gβγ signaling rather that increased activity in the specific signaling processes. In this case, the signaling pathways for α-adrenergic receptor, androgen receptor, tubby, FAK, and breast cancer regulation by stathmin1 exhibited an enrichment of up regulated genes. However, notably absent from these pathways was a change in the expression of the adrenergic or androgen receptor, tubby, FAK, or stathmin1. Similarly, an enrichment of up regulated genes was observed for pathways linked to the antigen presentation pathway. Gene enrichment was observed for NFAT in regulation of the immune response, IL-8, and chemokine receptor 5 (CCR5) signaling in macrophages, although, NFAT, the IL-8 receptor and CCR5 were not altered. For CR, selective analysis limited to up regulated genes confirmed an enrichment of long-term potentiation (LTP) signaling. Other pathways with gene enrichment contained elements of LTP signaling including Rac, breast cancer regulation by stathmin1, IL-3, and formyl-Met-Leu-Phe (fMLP) signaling in neutrophils. Again, while many of the elements were increased major determinants of the pathway (rac, stathmin1, IL-3 and fMLP receptors) were not increased. Finally, enrichment was observed for clathrin-mediated endocytosis.
Regional differences associated with aging were observed in the regulation of genes for pathways related to neuroinflammation, cell survival, oxidative phosphorylation, mitochondrial dysfunction, and protein ubiquitination pathways. An age-related increase in genes for antigen presentation and IL-4 signaling was evident only in region CA1 suggesting that CA1 may be more sensitive to the effects of age, at least with regard to processes that increase the expression of genes related to immune responses (Wang et al., 2009).
Similarly, regional specificity was observed for CR influences, such that regions CA1 and CA3 exhibited altered LTP signaling; however, no gene changes were found to be common between the two regions. Several kinases were upregulated in CR animals including calcium/calmodulin-dependent protein kinase IV (CAMK4) in the CA1 region and cAMP dependent protein kinase (PKA) and mitogen-activated protein kinase kinase 1 (MAP2K1) in CA3; protein kinase C gamma and protein kinase C beta increased in CA3 and CA1, respectively. Similarly, calcium/calmodulin dependent protein kinase II (CaMKII) alpha was upregulated in CA3 and CaMKII gamma was upregulated in CA1. In region CA3, the catalytic and regulatory subunits for the phosphatase calcineurin (PPP3CA, PPP3CB), were down and upregulated, respectively. In the CA1 region, alpha-amino-3-hydroxy-5-methyl-4-isoxazole propionate selective glutamate receptor (GRIA2) receptor was upregulated and the NMDA receptor associated protein 1 (GRINA) increased in CA3. The results are consistent with research indicating that CR can improve synaptic plasticity in the hippocampus and suggest the mechanism varies between regions.
Table 3 illustrates the directional changes in genes that were altered in at least two of the three regions for the IGF-1, PI3K/AKT, P53, apoptosis, oxidative phosphorylation, mitochondrial dysfunction, and protein ubiquitination pathways. Several pathways share common molecular members. In some cases, these molecules were similarly influenced across regions during aging; however, notable differences were observed for CR influences.
Table 3.
Regionally distinct treatment effects.
| Age Effect | Diet Effect | Pathways | ||||||||
|---|---|---|---|---|---|---|---|---|---|---|
| Molecule | CA1 | CA3 | DG | CA1 | CA3 | DG | ||||
| IGF1-PI3K/AKT and P53-Apoptosis | IGF | AKT | P53 | Apoptosis | ||||||
| ACIN1 | 1.62 | 1.53 | 1.54 | NS | NS | NS | x | |||
| AKT1 | 1.61 | 1.53 | 1.46 | NS | 1.32 | 1.33 | x | x | x | |
| BAI1 | 1.39 | 1.61 | NS | NS | 1.33 | 1.4 | x | |||
| BAX | 1.71 | 1.81 | 1.93 | NS | −1.47 | −144 | x | x | ||
| BIRC2 | −1.36 | NS | NS | NS | 1.29 | 1.26 | x | |||
| CAPNS1 | 1.42 | NS | 1.41 | NS | NS | NS | x | |||
| CASP9 | 1.24 | 1.22 | NS | NS | NS | NS | x | x | ||
| CTNNB1 | NS | 1.27 | 1.24 | NS | −1.28 | −1.28 | x | x | ||
| GRB2 | −3.17 | −3.45 | −2.09 | NS | NS | NS | x | x | ||
| IGF1R | NS | NS | NS | 1.73 | 1.68 | 1.39 | x | |||
| IHPK2 | 1.87 | 1.61 | NS | NS | 1.35 | 1.5 | x | |||
| JUN | 1.77 | 1.7 | NS | NS | NS | NS | x | x | ||
| NFKBIB | 1.55 | 1.38 | 1.45 | NS | NS | NS | x | x | ||
| P53 | 2.11 | 2.02 | 1.89 | NS | NS | NS | x | x | x | |
| PIK3CA | NS | NS | NS | NS | 1.17 | −1.55 | x | x | x | |
| PIK3R2 | 1.98 | −3.13 | −3.16 | NS | 2.75 | 3.88 | x | x | x | |
| PPKAR1B | NS | NS | NS | NS | 1.14 | 1.23 | x | |||
| PRKACB | −4.41 | −3.35 | −2.65 | NS | 2.66 | 2.89 | x | |||
| SFN | 1.65 | 1.75 | NS | NS | NS | 1.32 | x | x | x | |
| YWHAB | 1.47 | 1.46 | 1.43 | NS | NS | NS | x | x | ||
| Oxidative Phosphorylation and Mitochondrial Dysfunction | OX-Phos | Myto-Dys | ||||||||
| ATP5D | 1.26 | 1.23 | 1.21 | NS | NS | NS | x | |||
| ATP6V0A1 | 1.59 | 1.49 | NS | NS | 1.37 | 1.5 | x | |||
| ATP6V0A2 | 1.37 | NS | 1.36 | NS | NS | NS | x | |||
| ATP6V0B | NS | NS | NS | NS | 6.38 | 1.24 | x | |||
| ATP6V0D1 | NS | NS | NS | NS | 1.15 | 1.23 | x | |||
| ATP6V1B2 | NS | NS | NS | NS | 1.17 | 1.22 | x | |||
| ATP6V1G2 | NS | NS | NS | NS | 1.12 | 1.18 | x | |||
| CASP9 | 1.24 | 1.22 | NS | NS | NS | NS | x | |||
| COX5B | NS | 1.16 | 1.14 | NS | NS | NS | x | x | ||
| COX7B | NS | 1.25 | 1.31 | NS | −1.38 | −1.36 | x | x | ||
| GPX4 | 1.21 | NS | 1.23 | NS | NS | NS | x | |||
| HCG25731 | NS | NS | NS | NS | −1.09 | 1.12 | x | |||
| IHPK2 | 1.87 | 1.61 | NS | NS | 1.35 | 1.5 | x | |||
| MAP2K4 | −1.24 | NS | −1.27 | NS | NS | NS | x | |||
| NDUFA7 | −2.3 | −1.78 | NS | NS | 1.9 | 2.87 | x | x | ||
| NDUFS8 | 1.38 | 1.35 | 1.39 | NS | NS | NS | x | x | ||
| NDUFV3 | 1.53 | 1.58 | 1.44 | NS | −1.26 | −1.59 | x | x | ||
| UGCRQ | 1.32 | 1.28 | NS | NS | NS | NS | x | |||
| UQCRC1 | NS | 1.15 | 1.17 | NS | NS | 1.14 | x | x | ||
| Protein Ubiquitination | ||||||||||
| ANAPC2 | 1.36 | 1.38 | 1.44 | NS | NS | NS | ||||
| ANAPC5 | NS | 1.15 | 1.13 | NS | NS | NS | ||||
| BAG1 | NS | 1.38 | 1.27 | NS | −1.34 | −1.23 | ||||
| BIRC2 | −1.36 | NS | NS | NS | 1.29 | 1.26 | ||||
| BTRC | 1.67 | 1.72 | 1.75 | NS | NS | NS | ||||
| FZR1 | 1.54 | 1.42 | 1.53 | NS | NS | 1.33 | ||||
| PSMA3 | NS | NS | NS | NS | −1.19 | −1.26 | ||||
| PSMB5 | NS | 1.17 | 1.21 | NS | NS | NS | ||||
| PSMD14 | NS | NS | NS | NS | 1.64 | −1.34 | ||||
| STUB1 | NS | NS | 1.17 | NS | 1.14 | 1.24 | ||||
| TAP2 | 5.51 | 4.83 | NS | NS | NS | −3.11 | ||||
| THOP1 | 1.93 | 1.88 | 1.68 | NS | NS | NS | ||||
| UBA1 | 1.37 | 1.26 | NS | NS | 1.2 | 1.4 | ||||
| UBE2D2 | NS | 1.38 | 1.57 | NS | 2.2 | 1.4 | ||||
| UBE2J1 | 1.31 | 1.32 | NS | NS | NS | NS | ||||
| UBE2Q1 | NS | 1.17 | NS | −1.37 | −1.22 | NS | ||||
| UBE2S | 1.67 | 1.94 | 1.95 | NS | NS | NS | ||||
| UBE2V1 | NS | NS | NS | NS | 1.1 | 1.18 | ||||
| UCHL3 | NS | NS | NS | NS | −1.16 | −1.15 | ||||
| USO1 | −1.35 | NS | −1.25 | NS | NS | NS | ||||
| USP11 | NS | NS | NS | NS | 1.17 | 1.29 | ||||
| USP22 | NS | NS | NS | NS | 1.73 | 1.53 | ||||
| USP5 | 1.27 | 1.21 | NS | NS | 1.28 | 1.33 | ||||
Numbers represent significant fold change values; those that were not significant (NS) are indicated. Functional categories with multiple pathways indicate molecular inclusion (x).
3.3 Apoptosis and cell survival pathways
Pathways pertinent to apoptosis and viability or cell survival, which share several common molecular members, were found to be altered by aging including IGF-1, PI3K/AKT, P53, and apoptosis signaling (Table 3). In general, aging increased signaling molecules for apoptosis. Gene enrichment was observed for the P53 pathway in each region (Table 2) and several apoptosis promoting molecules exhibited increased expression in all three regions including p53, BAX, and ACIN1 (Table 3). Differences in expression, particularly between CA1 and the DG were also observed (Table 3), with CA1 exhibiting increased expression of additional p53/apoptosis signaling regulators (BAI1, CASP9, IHPK2, JUN, SFN). In the case of cell survival pathways, aging was associated with gene enrichment for the PI3K/AKT signaling pathway in CA3 and the DG and for IGF-1 signaling in CA1 (Table 2). In addition, AKT, which has anti-apoptotic actions, was increased in all regions (Table 3).
CR influenced cell survival pathways, particularly in region CA3 and the DG. As such, gene enrichment reached significance in region CA3 for IGF-1, insulin, PI3K/AKT, and ERK/MAPK signaling (Table 2). CR reversed an age-related increased expression of the gene encoding the pro-apoptotic molecule, BAX, and increased expression of anti-apoptosis molecule BIRC2, in area CA3 and the DG (Table 3). Interestingly, the expression of genes in these apoptotic and cell survival pathways exhibited minimal CR effects in region CA1 (Table 3). Thus, CR appears to promote cell survival signaling, particularly in regions CA3, while cell survival pathways in region CA1 may be less responsive to CR.
3.4 Mitochondria and oxidative phosphorylation
Aging was associated with an enrichment of genes related to mitochondrial dysfunction across the hippocampus when all regions were combined and specifically in the DG when individual regions were considered (Table 2). The mitochondrial dysfunction pathway shares common molecules with oxidative phosphorylation, and oxidative phosphorylation was influenced by CR in region CA3 and the DG (Table 2). In examining genes that were common across regions, it is clear that the three regions were influenced in the same direction during aging, and that the CA1 region was less responsive to CR (Table 3).
3.5 Protein ubiquitination
Table 2 indicates that the enrichment of genes for protein ubiquitination associated with aging and CR, which was observed for analysis across all regions, was also observed for region CA3. Furthermore, both conditions were mainly associated with an increase in expression, with 17 genes increased during aging and 16 genes increased in CA3 of older CR animals relative to age matched AL animals. Closer examination of the genes that were altered in at least two of the three regions (Table 3) indicates that aging is associated with an increase in the expression of genes involved in the degradation of antigens (PSMB5, TAP2, THOP1), and genes for proteins that mediate the covalent attachment of ubiquitin to other proteins (UBE2J1, UBE2Q1, UBE2S, BTRC), including those for the E3 ubiquitin ligase of the anaphase promoting complex (ANAPC2, ANAPC5, FZR1). In contrast, CR was associated with increased expression of deubiquitinating enzymes (PSMD14, USP11, USP22, USP5). Finally, age and CR effects were observed for proteins that mediate the interaction between chaperone activity and ubiquitination of misfolded proteins (BAG1, STUB1). Importantly, very few genes exhibited a shift in the opposite direction due to aging and CR, rather it appears that there is an increase in expression for ubiquitinating and deubiquitinating molecules, respectively.
To assess the function of the ubiquitin-proteosome pathway, we analyzed the degree of polyubiquitinated substrates, as well as the expression level of an ubiquitin-conjugating enzyme (UBE2J1) (n=3 per group). In general, the level of polyubiquitinated proteins was increased with age and decreased in CR animals for each hippocampal region (Figure 2). Densitometric quantification of western blots (Table 4) indicated that, across all regions of the hippocampus, there was a tendency for an increase in the expression of polyubiquitinated proteins (1.31 fold change, p=0.066). In addition, the expression level of UBE2J1 was reduced in CR animals in all regions of the hippocampus (−1.83-fold change, p < 0.005) and this decrease was significant for region CA3 (38 mo AL vs 38 mo CR: −2.94-fold change, p < 0.01).
Figure 2.
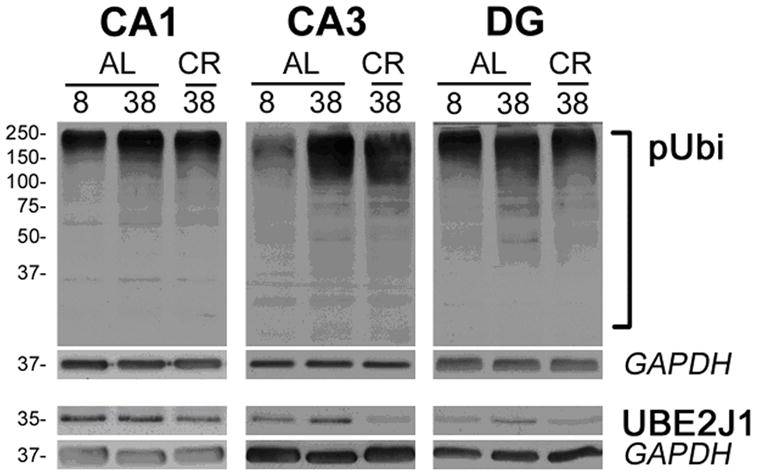
Polyubiquitination of proteins in the hippocampus. A) Western blot analysis of total protein (20ug/lane) from CA1, CA3, and DG regions of the hippocampi of 8 and 38 mo old rats fed AL and 38 mo old rats on 40% CR diet (n=3 per group) probed with an anti-ubiquitin antibody. Slow migrating poly-ubiquitinated (pUbi) protein substrates are marked by a square bracket. B) Staining against the ubiquitin ligase family member (UBE2J1). GAPDH is shown as a protein loading control. Molecular mass is kDA, on the left.
Table 4.
Western blot analysis of stress response and ubiquitination.
| CA1 | CA3 | DG | All | ||||||||||||||||
|---|---|---|---|---|---|---|---|---|---|---|---|---|---|---|---|---|---|---|---|
| AGE | CR | AGE | CR | AGE | CR | AGE | CR | ||||||||||||
| Antigen | FC | P | FC | P | FC | P | FC | P | FC | P | FC | P | FC | P | FC | P | |||
| HSP90 | 1.21 | NS | −1.95 | 0.089 | 1.23 | NS | −1.64 | 0.098 | 1.21 | NS | −1.76 | 0.066 | 1.22 | NS | −1.77 | 0.001 | |||
| HSP70 | 1.19 | NS | −1.21 | NS | −1.05 | NS | −1.50 | NS | −1.06 | NS | −1.44 | NS | 1.03 | NS | −1.35 | NS | |||
| HSP40 | 1.15 | NS | −1.15 | NS | −1.04 | NS | −1.42 | NS | 1.04 | NS | −1.15 | NS | 1.05 | NS | −1.22 | NS | |||
| HSP27 | 27.03 | 0.003 | 1.15 | NS | 48.12 | 0.001 | 1.07 | NS | 12.66 | 0.036 | −1.38 | NS | 29.28 | 0.001 | 1.05 | NS | |||
| pUbi | 1.24 | NS | −1.13 | NS | 1.47 | 0.081 | −1.01 | NS | 1.24 | NS | 1.04 | NS | 1.31 | 0.066 | −1.03 | NS | |||
| UBE2J | −1.04 | NS | −1.55 | NS | 1.09 | NS | −2.94 | 0.009 | 1.02 | NS | −1.49 | NS | 1.02 | NS | −1.83 | 0.005 | |||
The fold change for age represents comparisons between 8 mo-AL and 38 mo-AL rats. The fold change for CR represents comparisons between 38 mo-AL and 38 mo-CR rats. NS = not significant.
Consistent with an age-related increase in polyubiquitinated proteins, immunolabeling of hippocampal sections exhibited strong ubiquitin-like reactivity (red) in the hippocampus from a 38 mo AL relative to 18 mo AL animal (Figure 3). In samples from the AL animal, the ubiquitin was diffuse and distributed throughout the cell body, likely reflecting cytosolic localization. In comparison, it appears that overall ubiquitin-like immunoreactivity was reduced by CR and was more focal, often limited to inclusions adjacent to nuclei (blue).
Figure 3.
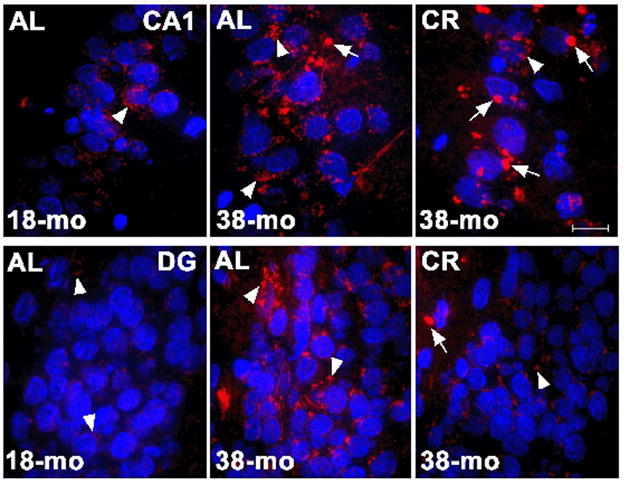
Immunofluorescence showing ubiquitinated inclusions (red) in CA1 (top row, 60X) and DG (bottom row, 60X) regions for 18 mo AL (left column), 38 mo AL (center column) and 38 mo CR (right column). Nuclei were stained with a Hoechst (blue). There appears to be more ubiquitin staining in 38 AL compared to 18 AL and the ubiquitin was diffuse (arrow heads) and distributed throughout the cell body. In comparison, overall ubiquitin-like immunoreactivity appears reduced by CR and more focal, often limited to inclusions (arrows) adjacent to nuclei. The calibration bar is 10 μM.
3.6 CR effects that directly oppose aging effects are associated with stress responses
In addition to compensatory effects of CR, we sought to determine whether CR can directly counteract age effects on specific genes and biological processes, therefore, we examined the genes that were significantly altered during aging and CR, and whose expression was oppositely affected by the two treatments. In the CA1, CA3, and DG regions of the hippocampus there were 95, 330, and 247 probe sets sensitive to both aging and CR, respectively (Figure 1). A large majority of these overlapping probe sets were oppositely affected by aging and CR. Across all regions of the hippocampus, 1,191 probe sets were significantly, and oppositely affected by aging and CR (Figure 1). The probe sets that were oppositely affected by aging and CR, were submitted to IPA to determine enrichment in functional pathways. Table 5 provides the pathways and genes that exhibited significant and opposite alterations in each region. When all regions were considered together, pathways linked to immune responses were revealed including antigen presentation, signaling in B lymphocytes, and dendritic cell maturation. In addition, a significant enrichment of genes was observed for mitochondrial dysfunction and the metabolic pathway for oxidative phosphorylation. IPA analysis within individual regions indicated significant functional enrichment of genes for oxidative phosphorylation in region CA3 and the DG. In addition, we observed regional differences in several pathways involved in responding to stress, including hypoxia signaling in region CA1, p53, and glucocorticoid receptor signaling in CA3 and the DG, and nucleotide excision repair in the DG.
Table 5.
Pathways associated with genes oppositely affected by aging and CR
| Pathways | P-value | Molecules |
|---|---|---|
|
CA1 | ||
| Hypoxia Signaling in the Cardiovascular System | 0.027 | NFKBIE (1.4, −1.2), UBE2L6 (1.7, −1.4) |
|
CA3 | ||
| p53 Signaling | 0.001 | PRKDC (1.4, −1.3), PIK3R2 (−3.1, 2.8), BAX (1.8, −1.4), CTNNB1 (1.3, −1.3) |
| RAR Activation | 0.010 | PRKACB (−3.4, 2.7), NSD1 (1.5, −1.4), RDH10 (−1.2, 1.2), RDH11 (1.3, −1.2), PIK3R2 (−3.1, 2.8) |
| Oxidative Phosphorylation | 0.016 | COX7B (−1.3, 1.4), ATP5E (1.2, −1.2), NDUFV3 (1.6, −1.3), NDUFA7 (−1.8, 1.9), UQCRQ (1.3, −1.3) |
| Glucocorticoid Receptor Signaling | 0.020 | PRKACB (−3.4, 2.7), HSP90AB1 (−15.7, 2.5), BAG1 (1.4, −1.3), TAF5L (1.2, −1.2), PIK3R2 (−3.1, 2.8), POLR2I (1.4, −1.3) |
| N-Glycan Biosynthesis | 0.023 | MAN2A2 (1.5, −1.5), DPM2 (1.2, 1.2) |
| Mitochondrial Dysfunction | 0.044 | COX7B (−1.3, 1.4), NDUFV3 (1.6, −1.3), NDUFA7 (−1.8, 1.9) |
|
DG | ||
| p53 Signaling | 0.002 | PIK3R2 (−3.2, 3.9), BAX (1.9, −1.5), CTNNB1 (1.2, −1.3) |
| Glucocorticoid Receptor Signaling | 0.010 | PRKACB (−2.6, 2.9), HSP90AB1 (−10.7, 9.5), BAG1 (1.3, −1.2), POLR2J (1.3, −1.2), PIK3R2 (−3.2, 3.9) |
| Oxidative Phosphorylation | 0.017 | ATP7B (−2.1, 1.7), COX7B (1.3, −1.4), NDUFV3 (1.4, −1.3) |
| Nucleotide Excision Repair Pathway | 0.024 | XPC (−1.7, 2.5), POLR2J (1.3, −1.2) |
|
Hippocampus | ||
| Oxidative Phosphorylation | 0.004 | ATP5E (1.2, −1.1), ATP6V1B2 (−1.1, 1.1), COX15 (1.5, −1.4), COX5B (1.2, −1.2), COX6C (−1.5, 1.9), COX7B (1.3, −1.3), FAM63B (−3.4, 2.7), IP6K2 (−1.2, 1.1), NDUFA1 (1.1, −1.1), NDUFA12 (1.1, −1.1), NDUFA7 (−2.0, 1.9), NDUFB10 (1.3, −1.1), NDUFB4 (1.1, −1.1), NDUFS5 (1.2, −1.1), NDUFV3 (1.5, −1.4), UQCRQ (1.3, −1.2) |
| FcgRIIB Signaling in B Lymphocytes | 0.007 | BTK (2.1, −1.8), FCGR2B (1.9, −1.6), MAPK8 (−1.1, 1.2), MRAS (1.3, − 1.3), PIK3CA (1.4, −1.4), PIK3R2 (−3.3, 2.4), SOS1 (−1.2, 1.3) |
| Antigen Presentation Pathway | 0.010 | B2M (1.3, −1.2), CANX (1.1, −1.1), HLA-DQA1 (4.2, −2.6), HLA-DRB1 (4.9, −3.1), TAP2 (4.7, −2.3) |
| Ubiquinone Biosynthesis | 0.012 | NDUFA1 (1.1, −1.1), NDUFA12 (1.1, −1.1), NDUFA7 (−2.0, 1.9), NDUFB10 (1.3, −1.1), NDUFB4 (1.1, −1.1), NDUFS5 (1.2, −1.1), NDUFV3 (1.5, −1.4), EDF1 (1.4, −1.1) |
| Mitochondrial Dysfunction | 0.020 | NDUFA1 (1.1, −1.1), NDUFA12 (1.1, −1.1), NDUFA7 (−2.0, 1.9), NDUFB10 (1.3, −1.1), NDUFB4 (1.1, −1.1), NDUFS5 (1.2, −1.1), NDUFV3 (1.5, −1.4), COX15 (1.5, −1.4), COX5B (1.2, −1.2), COX6C (−1.5, 1.9), COX7B (1.3, −1.3), MAPK8 (−1.1, 1.2), GPX7 (1.2, −1.2), PSEN1 (1.3, −1.3) |
| Dendritic Cell Maturation | 0.022 | B2M (1.3, −1.2), CANX (1.1, −1.1), FCGR2A (1.2, −1.2), FCGR2B (1.9, −1.6), HLA-DQA1 (4.2, −2.6), HLA-DRB1 (4.9, −3.1), IFNAR1 (1.5, − 1.3), IRF8 (1.6, −1.6), MAPK8 (−1.1, 1.2), PIK3CA (1.4, −1.4), PIK3R2 (−3.3, 2.4), STAT2 (1.6, −1.2), TREM2 (1.9, −1.5), TYROBP (2.3, −1.4) |
| Lipid Antigen Presentation by CD1 | 0.023 | B2M (1.3, −1.2), PDIA3 (1.3, −1.2) |
| Pyrimidine Metabolism | 0.034 | APOBEC1 (1.6, −1.6), DTYMK (−2.1, 2.1), NME3 (−1.1, 1.1), NME4 (1.3, −1.4), NME6 (1.4, −1.4), POLD4 (1.4, −1.5), POLR2F (1.3, −1.2), POLR2J (1.3, −1.2), POLR3D (1.2, −1.2), POLR3F (−1.5, 1.6), POLR3H (1.2, −1.2), POLRMT (−1.3, 1.5), RPUSD4 (1.2, −1.2), TRUB2 (1.3, −1.2) |
| NRF2-mediated Oxidative Stress Response | 0.047 | ACTA1 (1.3, −1.2), DNAJC17 (1.3, −1.3), DNAJC4 (1.4, −1.1), EIF2AK3 (1.2, −1.2), ERP29 (1.3, −1.2), FTL (1.3, −1.1), GSTA1 (1.2, − 1.1), HMOX1 (1.4, −1.4), MAPK8 (−1.1, 1.2), MGST1 (1.3, −1.2), MRAS (1.3, −1.3), PIK3CA (1.4, −1.4), PIK3R2 (−3.3, 2.4), PPIB (1.2, − 1.1), SCARB1 (1.3, −1.2), SLC35A2 (1.4, −1.2) |
The fold change values for aging followed by CR are indicated in the brackets. Some molecules are associated with multiple pathways.
For assessment of the stress response, we measured the expression levels of several heat shock proteins (HSP) including HSP90, HSP70, HSP40, and HSP27 using western blots (Figure 4). HSPs are induced in response to environmental and pathophysiological stressors, including aging (Kalmar and Greensmith, 2009; Morimoto, 1998). Previous work indicates that the level of HSP expression increases in the hippocampus during aging (Calabrese et al., 2004; Di Domenico et al.,; Ghi et al., 2009), and caloric restriction is associated with reduced constitutive HSP expression (for review see Kalmar and Greensmith, 2009). There was a tendency (p < 0.1) for age or CR effects within specific regions, which reached significance when examined across all regions, such that aging was associated with upregulation of HSP27 and HSP90 expression was decreased by CR (Table 4, Figure 4).
Figure 4.
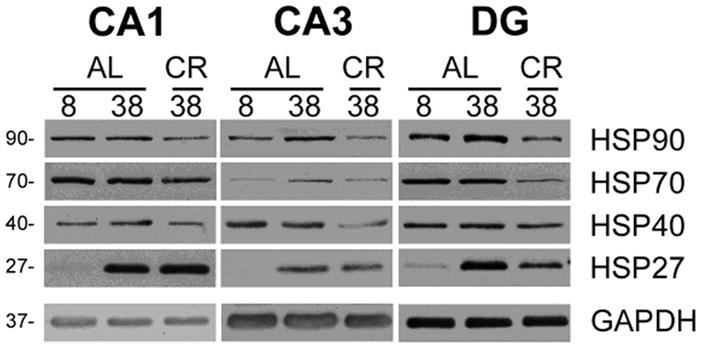
Expression of heat shock proteins (HSP90, HSP70, HSP40, HSP27) in three regions of the hippocampus from 8 or 38 mo rats fed AL or CR diet (n=3 per group). Note the increased expression of the small heat shock protein HSP27 in samples from the older animals. GAPDH is shown as a protein loading control. Molecular mass is kDa, on the left.
4. Discussion
In the present study, we have investigated gene expression in the hippocampus, a brain region that is critical for learning and memory and highly sensitive to aging. Our study was designed to determine whether CR had similar effects in three closely linked regions of the hippocampus and whether CR would act on genes related to biological markers of aging in the hippocampus. Our data revealed several aspects of aging and CR which were common across regions and others that were unique to the CA1, CA3, and DG regions.
Before, considering the interpretation of the results, it is important to recognize the limitations of the study. First, age-related gene changes were examined between 18 to 28 mo and not all gene changes are monotonic with age (Blalock et al., 2003; Xu et al., 2007). It has been suggested that changes in expression from young to middle-age might reflect processes for compensation of increasing stress (Aenlle et al., 2009; Blalock et al., 2003). For example, increased transcription associated with oxidative stress begins in middle-age; however, expression of antioxidant defenses may decline with advanced age (Aenlle et al., 2009; Blalock et al., 2003; Colombrita et al., 2003; Rao et al., 1990; Tsay et al., 2000). Second, due to the limited availability of CR animals at specific ages, the protein assays involved different ages; 8 to 38 mo for western blots and 18 to 38 mo for immunocytochemistry. Despite the use of different ages, the results from the protein assays support the findings of the gene arrays, indicating aging is associated with increased cellular stress and CR altered protein ubiquitination.
While the western blots indicated changes in HSP expression, the specific HSP genes were not necessarily detected in our array studies. Other researchers have noted that the correlation of mRNA and protein is weak at best (Greenbaum et al., 2003; Gygi et al., 1999; Maier et al., 2009). For the current study, the difference is likely due to the strictness of the statistical filtering, which will limit the number of genes to be examined. Further, the polyclonal antibodies used in the protein expression analysis detect total protein and are not isoform or subunit specific. Finally, the transcription of HSP genes is negatively regulated by expression of heat shock proteins, such that gene expression will be balanced by the level of stress and the level of HSP expression (Morimoto, 1998). Thus, gene changes are likely to provide makers indicating which pathways are important to consider; however, protein expression and the function of the pathway will be determined by several factors including protein translation and degradation processes.
Consistent with previous microarray research on neural tissue, we observed that aging was associated with expression of markers for mitochondrial dysfunction, oxidative phosphorylation, inflammation and oxidative stress (Aenlle et al., 2009; Blalock et al., 2003; Erraji-Benchekroun et al., 2005; Prolla, 2002; Weindruch et al., 2002). While relatively few genes were influenced in the opposite direction by age and CR, the results indicate that CR can reduce some of the markers of aging. Across the three regions, CR had opposing effects for genes related to oxidative phosphorylation, mitochondrial dysfunction, antigen presentation, and the response to oxidative stress. In particular, across the hippocampus, upregulation and down regulation was observed for antigen presentation due to aging and CR, respectively. The gene expression changes for the regionally-combined analysis likely reflect the well described increase in microglia activation during aging, which can be reversed by CR (Morgan et al., 2007; Wu et al., 2008). However, it should be pointed out that changes in the immune response may reflect downstream responses to aging mechanisms and compensatory processes mediated by CR.
Other pathways exhibited effects of age and CR which were not necessarily opposite; rather CR induced offsetting or compensatory changes to counterbalance aging. When all regions were combined, effects of age and CR were prominent for the protein ubiquitination pathway (Table 2); however, the two conditions did not have the opposite effect on gene expression (Tables 2&3). Rather, the microarray data indicated that, aging was associated an upregulation of genes in this pathway, particularly for ubiquitin conjugating enzymes. The increase in expression of genes for ubiquitin conjugating enzymes and diffuse ubiquitin-like immunoreactivity within hippocampal cells is consistent with the age-related increase in ubiquinated proteins observed in a number of tissues, and is thought to result from proteasome inhibition (Ding et al., 2006; Grune, 2000; Szweda et al., 2003; Yang et al., 2008). CR was marked by an overall downregulation of gene expression in the protein ubiquitination pathway, but an upregulation of deubiquitinating component genes, suggesting processes for reducing the level ubiquitinated proteins. This idea is further supported by the observation that the CR-mediated increase in deubiquitinating component genes is associated with a reduction in the expression of the ubiquitin conjugating enzyme UBE2J and a decrease in diffuse ubiquitin-like immunoreactivity. The focal, often perinuclear ubiquitin-like immunoreactivity in CR samples likely indicates the sequestration and rerouting of undegraded proteasome substrates to an alternative pathway, namely autophagic-mediated lysosomal degradation (Fortun et al., 2007; Rangaraju et al., 2009).
There are several ways in which a change in protein ubiquitination might influence hippocampal function. For example, a decline in the ubiquitin/proteosome pathway could lead to ubiquitin positive inclusions that manifest in aged or neurodegenerative CNS tissue (Farout and Friguet, 2006; Fortun et al., 2005; Gray et al., 2003; Tydlacka et al., 2008). In turn, these inclusions may precede mitochondrial dysfunction, increased oxidative stress, and the activation of apoptotic pathways (Ding et al., 2006; Paz Gavilan et al., 2006). Finally, protein ubiquitination/proteasome activity has been linked to synaptic plasticity, which is central to learning and memory (Bingol and Schuman, 2006; Li et al., 2008; Patrick, 2006). Thus, aging and CR influences on ubiquitination/proteasome activity could modify the extent of hippocampal-dependent learning and impaired hippocampal LTP (Adams et al., 2008; Carter et al., 2009; Eckles-Smith et al., 2000; Hori et al., 1992). It will be important in future studies to examine the idea that disruption of the ubiquitin/proteosome pathway is a precursor for other markers of aging.
The strategy of combining array samples across regions increased the statistical power and facilitated the detection of genes that were commonly influenced across regions. Not surprising, this strategy accentuates the identification of gene changes that occur in a common cell type among these regions, namely glia. In contrast, analysis within each region can unmask region specific differences in the response or sensitivity to age or CR, which could have been obscured by potentially opposing changes in different regions of the hippocampus. Analysis within each region provided evidence that CA1 was more susceptible to the deleterious effects of aging and region CA3 and the DG were inclined to exhibit enhancement of cell survival signaling pathways associated with age and CR. An examination of the total number of genes influenced by age and CR indicated that more genes were influenced by age in CA1 and the DG exhibited a greater number of genes influenced by CR. Similarly, pathway analysis indicated that region CA1 was particularly sensitive to enhancement of the antigen presentation pathway, oxidative stress, and apoptosis with age (Table 2). In contrast, regions CA3 and the DG exhibited differential expression of genes for PI3/AKT signaling during aging (Table 2). Furthermore, CR was able to reverse aging effects on glucocorticoid signaling in the DG and CA3 (Table 5). The results are consistent with the idea that markers of aging include activation of stress responses and suggest that regional differences in gene expression relate to susceptibility to different stressors. Thus, aging may interact with processes that increase the vulnerability of region CA1 to hypoxia/oxidative stress and mediate glucocorticoid effects specific to region CA3, as well as regional differences in survival pathways including enhanced activity of PI3K/AKT signaling in region CA3 and the DG (Abe et al., 2004; Jackson et al., 2009; Wang et al., 2009).
Cell survival and neurotrophic pathways contribute to CR mediated cell protection in young animals (Katare et al., 2009; Mattson et al., 2004). In the current study, regional differences in gene expression for neurotrophic and cell survival pathways associated with age and CR were noted. In region CA1, aging was associated with gene enrichment for estrogen receptor and IGF-1 signaling and CR was without apparent effect on neurotrophic signaling pathways in this region (Table 2). In contrast, CA3 exhibited CR induced gene expression changes in IGF-1, insulin receptor, PI3K/AKT and ERK/MAPK neurotrophic signaling pathways (Table 2). Again, regional differences in stress may underlie differences in the activation of neurotrophic signaling during aging. For example, expression of AKT was increased across all three regions during aging, with the largest increase in CA1. CR induced an additional, though smaller, increase in AKT expression in CA3 and the DG suggesting that AKT expression may reflect a response to stress associated with aging which overshadows CR effects. CR increased the expression of the IGF receptor (IGF1R) gene in all three regions; however, the CR-mediated reversals of age-related changes in PIK3R2 and PRKACB, which contribute to the IGF-1 signaling cascade, were observed for region CA3 and the DG. The results are consistent with regional differences related to the availability of neurotrophic/cell survival signaling mechanisms (Abe et al., 2004; Jackson et al., 2009) or differential responses to neurotrophic signals (Glasper et al., 2009; Lynch et al., 2001).
Finally, regional differences in CR effects may relate to functional differences between regions. The CA1 and CA3 regions exhibited CR effects on genes within the pathway for LTP. Synaptic plasticity impairments during aging are a common finding in the hippocampus (Foster, 1999; Foster, 2002; Foster, 2007) and CR is associated with improvements in LTP, although the mechanism for CR effects on LTP is unclear (Adams et al., 2008; Eckles-Smith et al., 2000; Hori et al., 1992). CR resulted in a generalized upregulation of protein kinases; however, no single gene was regulated in the same direction across the two regions. The lack of correspondence between specific genes may result from differences intrinsic to the two regions including the connections, forms of synaptic plasticity, and activity of signaling cascades (Jackson and Foster, 2009). PKC isoforms beta and gamma were differentially expressed in CA1 and CA3 in CR animals. These isoforms contribute to the induction of synaptic plasticity and the regional expression appears to correlate with different forms of synaptic plasticity (Hussain and Carpenter, 2005; Naik et al., 2000). CR resulted in an increase in CAMK4 and PKA in region CA1 and CA3, respectively. CAMK4 is required to initiate transcription for the maintenance of LTP in CA1 (Alzoubi and Alkadhi, 2007; Ho et al., 2000; Kasahara et al., 2001) and PKA in CA3 pyramidal cells contributes to LTP at mossy fiber-CA3 and CA3-CA1 synapses (Nie et al., 2007; Sivakumaran et al., 2009). Similarly, CAMKII alpha, which was increased in region CA3, contributes to synaptic function between CA3 afferent and efferent synapses (Hinds et al., 2003; Lu and Hawkins, 2006). The results indicate that CR enhanced expression of molecules for signaling cascades involved in the specific form of synaptic plasticity observed in each region.
Together the results signify that, across all hippocampal regions, aging is associated with accumulation of ubiquitinated proteins, mitochondrial dysfunction, oxidative stress, and neuroinflammation. Furthermore, these processes are reduced by CR. Gene array studies in younger animals have demonstrated differential gene expression in hippocampal subregions linked to differences in metabolic activity and functional differences in signal transduction, and synaptic plasticity (Greene et al., 2009; Lein et al., 2004). The current study adds to this idea by demonstrating region differences in response to aging and CR. Importantly, the regional response to age-related stressors or CR diverge across hippocampal subregions according to differences in vulnerability of each region to stressors associated with aging, and the availability of neurotrophic or cell survival signaling mechanisms. The results may help to explain regional differences in susceptibility to age-related neurodegenerative disease (Bao et al., 2009; Mattson et al., 1989). Finally, CR is associated with amelioration of age-related deficits in synaptic plasticity and improved memory. The current study indicates that CR, possibly in combination with a reduction in age-related stressors, permits the expression of genes in signaling pathways which are critical to cellular function, including different forms of synaptic plasticity between hippocampal subregions.
Supplementary Material
Acknowledgments
This work was supported by NIH grants AG14979 and MH059891 and the Evelyn F. McKnight Brain Research Foundation.
Footnotes
Authors’ contributions: Zane Zeier was involved in the conceptual input, planning of the studies, data acquisition, all data analysis, and preparation of the first draft and final editing of the manuscript.
Irina Madorsky was involved in the data acquisition, and data analysis for the protein studies and final editing of the manuscript.
Ying Xu was involved in the acquisition, and preparation of RNA, and final editing of the manuscript.
William O. Ogle was involved in the planning of the studies, acquisition and preparation of RNA and final editing of the manuscript.
Lucia Notterpek was involved in the conceptual input, data analysis related to protein studies and final editing of the manuscript.
Thomas C. Foster was involved in the conceptual input, planning of the studies, all data analysis, and preparation of the first draft and final editing of the manuscript.
Publisher's Disclaimer: This is a PDF file of an unedited manuscript that has been accepted for publication. As a service to our customers we are providing this early version of the manuscript. The manuscript will undergo copyediting, typesetting, and review of the resulting proof before it is published in its final citable form. Please note that during the production process errors may be discovered which could affect the content, and all legal disclaimers that apply to the journal pertain.
References
- Abe T, Takagi N, Nakano M, Furuya M, Takeo S. Altered Bad localization and interaction between Bad and Bcl-xL in the hippocampus after transient global ischemia. Brain Res. 2004;1009:159–168. doi: 10.1016/j.brainres.2004.03.003. [DOI] [PubMed] [Google Scholar]
- Adams MM, Shi L, Linville MC, Forbes ME, Long AB, Bennett C, Newton IG, Carter CS, Sonntag WE, Riddle DR, Brunso-Bechtold JK. Caloric restriction and age affect synaptic proteins in hippocampal CA3 and spatial learning ability. Exp Neurol. 2008;211:141–149. doi: 10.1016/j.expneurol.2008.01.016. [DOI] [PMC free article] [PubMed] [Google Scholar]
- Aenlle KK, Foster TC. Aging alters the expression of genes for neuroprotection and synaptic function following acute estradiol treatment. Hippocampus. 2009 doi: 10.1002/hipo.20703. [DOI] [PMC free article] [PubMed] [Google Scholar]
- Aenlle KK, Kumar A, Cui L, Jackson TC, Foster TC. Estrogen effects on cognition and hippocampal transcription in middle-aged mice. Neurobiol Aging. 2009;30:932–945. doi: 10.1016/j.neurobiolaging.2007.09.004. [DOI] [PMC free article] [PubMed] [Google Scholar]
- Alzoubi KH, Alkadhi KA. A critical role of CREB in the impairment of late-phase LTP by adult onset hypothyroidism. Exp Neurol. 2007;203:63–71. doi: 10.1016/j.expneurol.2006.07.019. [DOI] [PubMed] [Google Scholar]
- Bao X, Pal R, Hascup KN, Wang Y, Wang WT, Xu W, Hui D, Agbas A, Wang X, Michaelis ML, Choi IY, Belousov AB, Gerhardt GA, Michaelis EK. Transgenic expression of Glud1 (glutamate dehydrogenase 1) in neurons: in vivo model of enhanced glutamate release, altered synaptic plasticity, and selective neuronal vulnerability. J Neurosci. 2009;29:13929–13944. doi: 10.1523/JNEUROSCI.4413-09.2009. [DOI] [PMC free article] [PubMed] [Google Scholar]
- Bingol B, Schuman EM. Activity-dependent dynamics and sequestration of proteasomes in dendritic spines. Nature. 2006;441:1144–1148. doi: 10.1038/nature04769. [DOI] [PubMed] [Google Scholar]
- Blalock EM, Chen KC, Sharrow K, Herman JP, Porter NM, Foster TC, Landfield PW. Gene microarrays in hippocampal aging: statistical profiling identifies novel processes correlated with cognitive impairment. J Neurosci. 2003;23:3807–3819. doi: 10.1523/JNEUROSCI.23-09-03807.2003. [DOI] [PMC free article] [PubMed] [Google Scholar]
- Bruce-Keller AJ, Umberger G, McFall R, Mattson MP. Food restriction reduces brain damage and improves behavioral outcome following excitotoxic and metabolic insults. Ann Neurol. 1999;45:8–15. [PubMed] [Google Scholar]
- Busuttil R, Bahar R, Vijg J. Genome dynamics and transcriptional deregulation in aging. Neuroscience. 2007;145:1341–1347. doi: 10.1016/j.neuroscience.2006.09.060. [DOI] [PMC free article] [PubMed] [Google Scholar]
- Calabrese V, Scapagnini G, Ravagna A, Colombrita C, Spadaro F, Butterfield DA, Giuffrida Stella AM. Increased expression of heat shock proteins in rat brain during aging: relationship with mitochondrial function and glutathione redox state. Mech Ageing Dev. 2004;125:325–335. doi: 10.1016/j.mad.2004.01.003. [DOI] [PubMed] [Google Scholar]
- Carter CS, Leeuwenburgh C, Daniels M, Foster TC. Influence of calorie restriction on measures of age-related cognitive decline: role of increased physical activity. J Gerontol A Biol Sci Med Sci. 2009;64:850–859. doi: 10.1093/gerona/glp060. [DOI] [PMC free article] [PubMed] [Google Scholar]
- Colombrita C, Calabrese V, Stella AM, Mattei F, Alkon DL, Scapagnini G. Regional rat brain distribution of heme oxygenase-1 and manganese superoxide dismutase mRNA: relevance of redox homeostasis in the aging processes. Exp Biol Med (Maywood) 2003;228:517–524. doi: 10.1177/15353702-0322805-16. [DOI] [PubMed] [Google Scholar]
- Di Domenico F, Sultana R, Tiu GF, Scheff NN, Perluigi M, Cini C, Butterfield DA. Protein levels of heat shock proteins 27, 32, 60, 70, 90 and thioredoxin-1 in amnestic mild cognitive impairment: An investigation on the role of cellular stress response in the progression of Alzheimer disease. Brain Res. doi: 10.1016/j.brainres.2010.03.085. [DOI] [PMC free article] [PubMed] [Google Scholar]
- Ding Q, Dimayuga E, Keller JN. Proteasome regulation of oxidative stress in aging and age-related diseases of the CNS. Antioxid Redox Signal. 2006;8:163–172. doi: 10.1089/ars.2006.8.163. [DOI] [PubMed] [Google Scholar]
- Eckles-Smith K, Clayton D, Bickford P, Browning MD. Caloric restriction prevents age-related deficits in LTP and in NMDA receptor expression. Brain Res Mol Brain Res. 2000;78:154–162. doi: 10.1016/s0169-328x(00)00088-7. [DOI] [PubMed] [Google Scholar]
- Erraji-Benchekroun L, Underwood MD, Arango V, Galfalvy H, Pavlidis P, Smyrniotopoulos P, Mann JJ, Sibille E. Molecular aging in human prefrontal cortex is selective and continuous throughout adult life. Biol Psychiatry. 2005;57:549–558. doi: 10.1016/j.biopsych.2004.10.034. [DOI] [PubMed] [Google Scholar]
- Farout L, Friguet B. Proteasome function in aging and oxidative stress: implications in protein maintenance failure. Antioxid Redox Signal. 2006;8:205–216. doi: 10.1089/ars.2006.8.205. [DOI] [PubMed] [Google Scholar]
- Fontan-Lozano A, Saez-Cassanelli JL, Inda MC, de los Santos-Arteaga M, Sierra-Dominguez SA, Lopez-Lluch G, Delgado-Garcia JM, Carrion AM. Caloric restriction increases learning consolidation and facilitates synaptic plasticity through mechanisms dependent on NR2B subunits of the NMDA receptor. J Neurosci. 2007;27:10185–10195. doi: 10.1523/JNEUROSCI.2757-07.2007. [DOI] [PMC free article] [PubMed] [Google Scholar]
- Fortun J, Li J, Go J, Fenstermaker A, Fletcher BS, Notterpek L. Impaired proteasome activity and accumulation of ubiquitinated substrates in a hereditary neuropathy model. J Neurochem. 2005;92:1531–1541. doi: 10.1111/j.1471-4159.2004.02987.x. [DOI] [PubMed] [Google Scholar]
- Fortun J, Verrier JD, Go JC, Madorsky I, Dunn WA, Notterpek L. The formation of peripheral myelin protein 22 aggregates is hindered by the enhancement of autophagy and expression of cytoplasmic chaperones. Neurobiol Dis. 2007;25:252–265. doi: 10.1016/j.nbd.2006.09.018. [DOI] [PMC free article] [PubMed] [Google Scholar]
- Foster TC. Involvement of hippocampal synaptic plasticity in age-related memory decline. Brain Res Brain Res Rev. 1999;30:236–249. doi: 10.1016/s0165-0173(99)00017-x. [DOI] [PubMed] [Google Scholar]
- Foster TC. Regulation of synaptic plasticity in memory and memory decline with aging. Prog Brain Res. 2002;138:283–303. doi: 10.1016/S0079-6123(02)38083-X. [DOI] [PubMed] [Google Scholar]
- Foster TC. Calcium homeostasis and modulation of synaptic plasticity in the aged brain. Aging Cell. 2007;6:319–325. doi: 10.1111/j.1474-9726.2007.00283.x. [DOI] [PubMed] [Google Scholar]
- Foster TC, Kumar A. Susceptibility to induction of long-term depression is associated with impaired memory in aged Fischer 344 rats. Neurobiol Learn Mem. 2007;87:522–535. doi: 10.1016/j.nlm.2006.12.009. [DOI] [PMC free article] [PubMed] [Google Scholar]
- Fu C, Hickey M, Morrison M, McCarter R, Han ES. Tissue specific and non-specific changes in gene expression by aging and by early stage CR. Mech Ageing Dev. 2006;127:905–916. doi: 10.1016/j.mad.2006.09.006. [DOI] [PMC free article] [PubMed] [Google Scholar]
- Ghi P, Di Brisco F, Dallorto D, Osella MC, Orsetti M. Age-related modifications of egr1 expression and ubiquitin-proteasome components in pet dog hippocampus. Mech Ageing Dev. 2009;130:320–327. doi: 10.1016/j.mad.2009.01.007. [DOI] [PubMed] [Google Scholar]
- Glasper ER, Llorens-Martin MV, Leuner B, Gould E, Trejo JL. Blockade of insulin-like growth factor-I has complex effects on structural plasticity in the hippocampus. Hippocampus. 2009 doi: 10.1002/hipo.20672. [DOI] [PubMed] [Google Scholar]
- Gray DA, Tsirigotis M, Woulfe J. Ubiquitin, proteasomes, and the aging brain. Sci Aging Knowledge Environ. 2003;2003:RE6. doi: 10.1126/sageke.2003.34.re6. [DOI] [PubMed] [Google Scholar]
- Greenbaum D, Colangelo C, Williams K, Gerstein M. Comparing protein abundance and mRNA expression levels on a genomic scale. Genome Biol. 2003;4:117. doi: 10.1186/gb-2003-4-9-117. [DOI] [PMC free article] [PubMed] [Google Scholar]
- Greene JG, Borges K, Dingledine R. Quantitative transcriptional neuroanatomy of the rat hippocampus: evidence for wide-ranging, pathway-specific heterogeneity among three principal cell layers. Hippocampus. 2009;19:253–264. doi: 10.1002/hipo.20502. [DOI] [PMC free article] [PubMed] [Google Scholar]
- Grune T. Oxidative stress, aging and the proteasomal system. Biogerontology. 2000;1:31–40. doi: 10.1023/a:1010037908060. [DOI] [PubMed] [Google Scholar]
- Gygi SP, Rochon Y, Franza BR, Aebersold R. Correlation between protein and mRNA abundance in yeast. Mol Cell Biol. 1999;19:1720–1730. doi: 10.1128/mcb.19.3.1720. [DOI] [PMC free article] [PubMed] [Google Scholar]
- Halagappa VK, Guo Z, Pearson M, Matsuoka Y, Cutler RG, Laferla FM, Mattson MP. Intermittent fasting and caloric restriction ameliorate age-related behavioral deficits in the triple-transgenic mouse model of Alzheimer’s disease. Neurobiol Dis. 2007;26:212–220. doi: 10.1016/j.nbd.2006.12.019. [DOI] [PubMed] [Google Scholar]
- Han ES, Hickey M. Microarray evaluation of dietary restriction. J Nutr. 2005;135:1343–1346. doi: 10.1093/jn/135.6.1343. [DOI] [PubMed] [Google Scholar]
- Hinds HL, Goussakov I, Nakazawa K, Tonegawa S, Bolshakov VY. Essential function of alpha-calcium/calmodulin-dependent protein kinase II in neurotransmitter release at a glutamatergic central synapse. Proc Natl Acad Sci U S A. 2003;100:4275–4280. doi: 10.1073/pnas.0530202100. [DOI] [PMC free article] [PubMed] [Google Scholar]
- Ho N, Liauw JA, Blaeser F, Wei F, Hanissian S, Muglia LM, Wozniak DF, Nardi A, Arvin KL, Holtzman DM, Linden DJ, Zhuo M, Muglia LJ, Chatila TA. Impaired synaptic plasticity and cAMP response element-binding protein activation in Ca2+/calmodulin-dependent protein kinase type IV/Gr-deficient mice. J Neurosci. 2000;20:6459–6472. doi: 10.1523/JNEUROSCI.20-17-06459.2000. [DOI] [PMC free article] [PubMed] [Google Scholar]
- Hori N, Hirotsu I, Davis PJ, Carpenter DO. Long-term potentiation is lost in aged rats but preserved by calorie restriction. Neuroreport. 1992;3:1085–1088. doi: 10.1097/00001756-199212000-00013. [DOI] [PubMed] [Google Scholar]
- Hussain RJ, Carpenter DO. A comparison of the roles of protein kinase C in long-term potentiation in rat hippocampal areas CA1 and CA3. Cell Mol Neurobiol. 2005;25:649–661. doi: 10.1007/s10571-005-4045-8. [DOI] [PMC free article] [PubMed] [Google Scholar]
- Ingram DK, Weindruch R, Spangler EL, Freeman JR, Walford RL. Dietary restriction benefits learning and motor performance of aged mice. J Gerontol. 1987;42:78–81. doi: 10.1093/geronj/42.1.78. [DOI] [PubMed] [Google Scholar]
- Jackson TC, Foster TC. Regional health and function in the hippocampus: Evolutionary compromises for a critical brain region. Bioscience Hypotheses. 2009;2:245–251. doi: 10.1016/j.bihy.2009.02.013. [DOI] [PMC free article] [PubMed] [Google Scholar]
- Jackson TC, Rani A, Kumar A, Foster TC. Regional hippocampal differences in AKT survival signaling across the lifespan: implications for CA1 vulnerability with aging. Cell Death Differ. 2009;16:439–448. doi: 10.1038/cdd.2008.171. [DOI] [PMC free article] [PubMed] [Google Scholar]
- Kalmar B, Greensmith L. Induction of heat shock proteins for protection against oxidative stress. Adv Drug Deliv Rev. 2009;61:310–318. doi: 10.1016/j.addr.2009.02.003. [DOI] [PubMed] [Google Scholar]
- Kasahara J, Fukunaga K, Miyamoto E. Activation of calcium/calmodulin-dependent protein kinase IV in long term potentiation in the rat hippocampal CA1 region. J Biol Chem. 2001;276:24044–24050. doi: 10.1074/jbc.M100247200. [DOI] [PubMed] [Google Scholar]
- Katare RG, Kakinuma Y, Arikawa M, Yamasaki F, Sato T. Chronic intermittent fasting improves the survival following large myocardial ischemia by activation of BDNF/VEGF/PI3K signaling pathway. J Mol Cell Cardiol. 2009;46:405–412. doi: 10.1016/j.yjmcc.2008.10.027. [DOI] [PubMed] [Google Scholar]
- Knowles WD. Normal anatomy and neurophysiology of the hippocampal formation. J Clin Neurophysiol. 1992;9:252–263. [PubMed] [Google Scholar]
- Lein ES, Zhao X, Gage FH. Defining a molecular atlas of the hippocampus using DNA microarrays and high-throughput in situ hybridization. J Neurosci. 2004;24:3879–3889. doi: 10.1523/JNEUROSCI.4710-03.2004. [DOI] [PMC free article] [PubMed] [Google Scholar]
- Li C, Wong WH. Model-based analysis of oligonucleotide arrays: expression index computation and outlier detection. Proc Natl Acad Sci U S A. 2001;98:31–36. doi: 10.1073/pnas.011404098. [DOI] [PMC free article] [PubMed] [Google Scholar]
- Li M, Shin YH, Hou L, Huang X, Wei Z, Klann E, Zhang P. The adaptor protein of the anaphase promoting complex Cdh1 is essential in maintaining replicative lifespan and in learning and memory. Nat Cell Biol. 2008;10:1083–1089. doi: 10.1038/ncb1768. [DOI] [PMC free article] [PubMed] [Google Scholar]
- Lu FM, Hawkins RD. Presynaptic and postsynaptic Ca(2+) and CamKII contribute to long-term potentiation at synapses between individual CA3 neurons. Proc Natl Acad Sci U S A. 2006;103:4264–4269. doi: 10.1073/pnas.0508162103. [DOI] [PMC free article] [PubMed] [Google Scholar]
- Lynch CD, Lyons D, Khan A, Bennett SA, Sonntag WE. Insulin-like growth factor-1 selectively increases glucose utilization in brains of aged animals. Endocrinology. 2001;142:506–509. doi: 10.1210/endo.142.1.8053. [DOI] [PubMed] [Google Scholar]
- Maier T, Guell M, Serrano L. Correlation of mRNA and protein in complex biological samples. FEBS Lett. 2009;583:3966–3973. doi: 10.1016/j.febslet.2009.10.036. [DOI] [PubMed] [Google Scholar]
- Mattson MP, Duan W, Wan R, Guo Z. Prophylactic activation of neuroprotective stress response pathways by dietary and behavioral manipulations. NeuroRx. 2004;1:111–116. doi: 10.1602/neurorx.1.1.111. [DOI] [PMC free article] [PubMed] [Google Scholar]
- Mattson MP, Guthrie PB, Kater SB. Intrinsic factors in the selective vulnerability of hippocampal pyramidal neurons. Prog Clin Biol Res. 1989;317:333–351. [PubMed] [Google Scholar]
- Mattson MP, Wan R. Beneficial effects of intermittent fasting and caloric restriction on the cardiovascular and cerebrovascular systems. J Nutr Biochem. 2005;16:129–137. doi: 10.1016/j.jnutbio.2004.12.007. [DOI] [PubMed] [Google Scholar]
- McBain CJ. Differential mechanisms of transmission and plasticity at mossy fiber synapses. Prog Brain Res. 2008;169:225–240. doi: 10.1016/S0079-6123(07)00013-1. [DOI] [PMC free article] [PubMed] [Google Scholar]
- McEwen BS. Plasticity of the hippocampus: adaptation to chronic stress and allostatic load. Ann N Y Acad Sci. 2001;933:265–277. doi: 10.1111/j.1749-6632.2001.tb05830.x. [DOI] [PubMed] [Google Scholar]
- Morgan TE, Wong AM, Finch CE. Anti-inflammatory mechanisms of dietary restriction in slowing aging processes. Interdiscip Top Gerontol. 2007;35:83–97. doi: 10.1159/000096557. [DOI] [PubMed] [Google Scholar]
- Morimoto RI. Regulation of the heat shock transcriptional response: cross talk between a family of heat shock factors, molecular chaperones, and negative regulators. Genes Dev. 1998;12:3788–3796. doi: 10.1101/gad.12.24.3788. [DOI] [PubMed] [Google Scholar]
- Naik MU, Benedikz E, Hernandez I, Libien J, Hrabe J, Valsamis M, Dow-Edwards D, Osman M, Sacktor TC. Distribution of protein kinase Mzeta and the complete protein kinase C isoform family in rat brain. J Comp Neurol. 2000;426:243–258. doi: 10.1002/1096-9861(20001016)426:2<243::aid-cne6>3.0.co;2-8. [DOI] [PubMed] [Google Scholar]
- Nie T, McDonough CB, Huang T, Nguyen PV, Abel T. Genetic disruption of protein kinase A anchoring reveals a role for compartmentalized kinase signaling in theta-burst long-term potentiation and spatial memory. J Neurosci. 2007;27:10278–10288. doi: 10.1523/JNEUROSCI.1602-07.2007. [DOI] [PMC free article] [PubMed] [Google Scholar]
- Ormerod BK, Palmer TD, Caldwell MA. Neurodegeneration and cell replacement. Philos Trans R Soc Lond B Biol Sci. 2008;363:153–170. doi: 10.1098/rstb.2006.2018. [DOI] [PMC free article] [PubMed] [Google Scholar]
- Patrick GN. Synapse formation and plasticity: recent insights from the perspective of the ubiquitin proteasome system. Curr Opin Neurobiol. 2006;16:90–94. doi: 10.1016/j.conb.2006.01.007. [DOI] [PubMed] [Google Scholar]
- Patrylo PR, Williamson A. The effects of aging on dentate circuitry and function. Prog Brain Res. 2007;163:679–696. doi: 10.1016/S0079-6123(07)63037-4. [DOI] [PubMed] [Google Scholar]
- Pawluski JL, Brummelte S, Barha CK, Crozier TM, Galea LA. Effects of steroid hormones on neurogenesis in the hippocampus of the adult female rodent during the estrous cycle, pregnancy, lactation and aging. Front Neuroendocrinol. 2009;30:343–357. doi: 10.1016/j.yfrne.2009.03.007. [DOI] [PubMed] [Google Scholar]
- Paz Gavilan M, Vela J, Castano A, Ramos B, del Rio JC, Vitorica J, Ruano D. Cellular environment facilitates protein accumulation in aged rat hippocampus. Neurobiol Aging. 2006;27:973–982. doi: 10.1016/j.neurobiolaging.2005.05.010. [DOI] [PubMed] [Google Scholar]
- Pitsikas N, Algeri S. Deterioration of spatial and nonspatial reference and working memory in aged rats: protective effect of life-long calorie restriction. Neurobiol Aging. 1992;13:369–373. doi: 10.1016/0197-4580(92)90110-j. [DOI] [PubMed] [Google Scholar]
- Prolla TA. DNA microarray analysis of the aging brain. Chem Senses. 2002;27:299–306. doi: 10.1093/chemse/27.3.299. [DOI] [PubMed] [Google Scholar]
- Rangaraju S, Hankins D, Madorsky I, Madorsky E, Lee WH, Carter CS, Leeuwenburgh C, Notterpek L. Molecular architecture of myelinated peripheral nerves is supported by calorie restriction with aging. Aging Cell. 2009;8:178–191. doi: 10.1111/j.1474-9726.2009.00460.x. [DOI] [PMC free article] [PubMed] [Google Scholar]
- Rao G, Xia E, Richardson A. Effect of age on the expression of antioxidant enzymes in male Fischer F344 rats. Mech Ageing Dev. 1990;53:49–60. doi: 10.1016/0047-6374(90)90033-c. [DOI] [PubMed] [Google Scholar]
- Rosenzweig ES, Barnes CA. Impact of aging on hippocampal function: plasticity, network dynamics, and cognition. Prog Neurobiol. 2003;69:143–179. doi: 10.1016/s0301-0082(02)00126-0. [DOI] [PubMed] [Google Scholar]
- Selman C, Kerrison ND, Cooray A, Piper MD, Lingard SJ, Barton RH, Schuster EF, Blanc E, Gems D, Nicholson JK, Thornton JM, Partridge L, Withers DJ. Coordinated multitissue transcriptional and plasma metabonomic profiles following acute caloric restriction in mice. Physiol Genomics. 2006;27:187–200. doi: 10.1152/physiolgenomics.00084.2006. [DOI] [PubMed] [Google Scholar]
- Sivakumaran S, Mohajerani MH, Cherubini E. At immature mossy-fiber-CA3 synapses, correlated presynaptic and postsynaptic activity persistently enhances GABA release and network excitability via BDNF and cAMP-dependent PKA. J Neurosci. 2009;29:2637–2647. doi: 10.1523/JNEUROSCI.5019-08.2009. [DOI] [PMC free article] [PubMed] [Google Scholar]
- Spindler SR, Dhahbi JM. Conserved and tissue-specific genic and physiologic responses to caloric restriction and altered IGFI signaling in mitotic and postmitotic tissues. Annu Rev Nutr. 2007;27:193–217. doi: 10.1146/annurev.nutr.27.061406.093743. [DOI] [PubMed] [Google Scholar]
- Swindell WR. Comparative analysis of microarray data identifies common responses to caloric restriction among mouse tissues. Mech Ageing Dev. 2008;129:138–153. doi: 10.1016/j.mad.2007.11.003. [DOI] [PMC free article] [PubMed] [Google Scholar]
- Szweda PA, Camouse M, Lundberg KC, Oberley TD, Szweda LI. Aging, lipofuscin formation, and free radical-mediated inhibition of cellular proteolytic systems. Ageing Res Rev. 2003;2:383–405. doi: 10.1016/s1568-1637(03)00028-x. [DOI] [PubMed] [Google Scholar]
- Terao A, Apte-Deshpande A, Dousman L, Morairty S, Eynon BP, Kilduff TS, Freund YR. Immune response gene expression increases in the aging murine hippocampus. J Neuroimmunol. 2002;132:99–112. doi: 10.1016/s0165-5728(02)00317-x. [DOI] [PubMed] [Google Scholar]
- Tsay HJ, Wang P, Wang SL, Ku HH. Age-associated changes of superoxide dismutase and catalase activities in the rat brain. J Biomed Sci. 2000;7:466–474. doi: 10.1007/BF02253362. [DOI] [PubMed] [Google Scholar]
- Tydlacka S, Wang CE, Wang X, Li S, Li XJ. Differential activities of the ubiquitin-proteasome system in neurons versus glia may account for the preferential accumulation of misfolded proteins in neurons. J Neurosci. 2008;28:13285–13295. doi: 10.1523/JNEUROSCI.4393-08.2008. [DOI] [PMC free article] [PubMed] [Google Scholar]
- Wang X, Zaidi A, Pal R, Garrett AS, Braceras R, Chen XW, Michaelis ML, Michaelis EK. Genomic and biochemical approaches in the discovery of mechanisms for selective neuronal vulnerability to oxidative stress. BMC Neurosci. 2009;10:12. doi: 10.1186/1471-2202-10-12. [DOI] [PMC free article] [PubMed] [Google Scholar]
- Weindruch R, Kayo T, Lee CK, Prolla TA. Gene expression profiling of aging using DNA microarrays. Mech Ageing Dev. 2002;123:177–193. doi: 10.1016/s0047-6374(01)00344-x. [DOI] [PubMed] [Google Scholar]
- Weindruch R, Naylor PH, Goldstein AL, Walford RL. Influences of aging and dietary restriction on serum thymosin alpha 1 levels in mice. J Gerontol. 1988;43:B40–42. doi: 10.1093/geronj/43.2.b40. [DOI] [PubMed] [Google Scholar]
- Wu P, Shen Q, Dong S, Xu Z, Tsien JZ, Hu Y. Calorie restriction ameliorates neurodegenerative phenotypes in forebrain-specific presenilin-1 and presenilin-2 double knockout mice. Neurobiol Aging. 2008;29:1502–1511. doi: 10.1016/j.neurobiolaging.2007.03.028. [DOI] [PubMed] [Google Scholar]
- Xu X, Zhan M, Duan W, Prabhu V, Brenneman R, Wood W, Firman J, Li H, Zhang P, Ibe C, Zonderman AB, Longo DL, Poosala S, Becker KG, Mattson MP. Gene expression atlas of the mouse central nervous system: impact and interactions of age, energy intake and gender. Genome Biol. 2007;8:R234. doi: 10.1186/gb-2007-8-11-r234. [DOI] [PMC free article] [PubMed] [Google Scholar]
- Yang S, Liu T, Li S, Zhang X, Ding Q, Que H, Yan X, Wei K, Liu S. Comparative proteomic analysis of brains of naturally aging mice. Neuroscience. 2008;154:1107–1120. doi: 10.1016/j.neuroscience.2008.04.012. [DOI] [PubMed] [Google Scholar]
- Zalutsky RA, Nicoll RA. Comparison of two forms of long-term potentiation in single hippocampal neurons. Science. 1990;248:1619–1624. doi: 10.1126/science.2114039. [DOI] [PubMed] [Google Scholar]
Associated Data
This section collects any data citations, data availability statements, or supplementary materials included in this article.