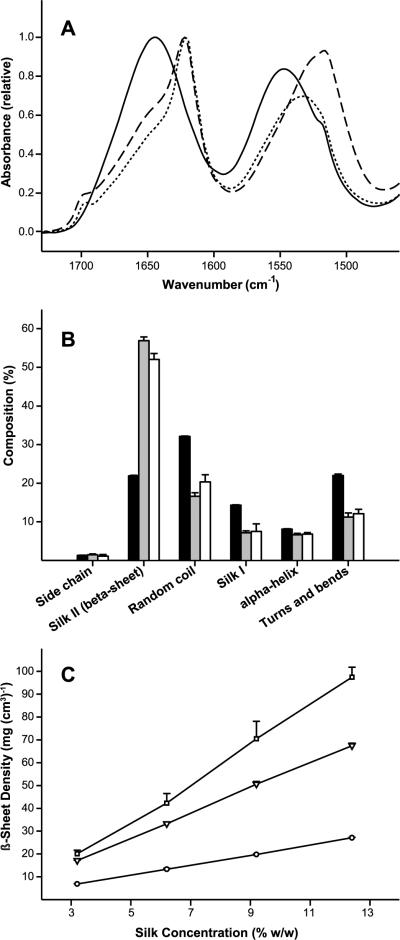
Figure 4.
Structural characterization of silk lyogel constructs. (A) Normalized FTIR absorbance spectra (amide I and amide II bands) after buffer and water vapor subtraction comparing 12.4% (w/v) silk solution (solid line), sonication induced hydrogel (dotted line), and lyogel (dashed line). (B) Secondary structure composition determined by deconvolution of the FTIR amide I absorbance band for 12.4% (w/v) silk solution (black bars), sonication induced hydrogels (gray bars), and lyogels (white bars). (C) Calculated β-sheet density as a function of silk concentration for solution (circles, solid line), sonication induced hydrogels (triangles, long dashed line), and lyogels (squares, short dashed line). Where error bars are not visible, they fall within the background. Lines were added as a visual aid.

