

Abstract
Spectroscopic studies of the biologically active compound 2-(4-fluorophenylamino)-5-(2,4-dihydroxybenzeno)-1,3,4-thiadiazole (FABT), have been performed. Absorption studies in the UV-Vis region for FABT in polar solvents, like water or ethanol, exhibit the domination of the enol form over its keto counterpart, with a broad absorption band centered around 340 nm. In non-polar solvents such as n-heptane or heavier alkanes the 340 nm absorption band disappears and an increase of the band related to the keto form (approximately 270 nm) is observed. Fluorescence spectra (with 270 nm and 340 nm excitation energies used) show a similar dependence: for FABT in 2-propanol a peak at about 400 nm dominates over that at 330 nm while in n-heptane this relation is reversed. The solvent dependent equilibrium between the keto and enol forms is further confirmed by FTIR and Raman spectroscopies. As can be expected, this equilibrium also shows some temperature dependences. We note that the changes between the two tautomeric forms of FABT are not related to the permanent dipole moment of the solvent but rather to its dipole polarizability.
Keywords: Thiadiazoles, Intramolecular proton transfer, Keto-enol tautomers, Molecular spectroscopy
Introduction
The keto/enol equilibrium as a function of different solvents and temperature has been the subject of many theoretical and experimental studies [1–4]. Molecules displaying intramolecular hydrogen bonding between proton donor groups such as −OH or −NH and proton acceptor groups such as =N- or C=O are of a growing interest [5, 6]. They are used as chelating agents, polymer UV stabilizers [7], laser dyes [8], biological and medical agents [9, 10], and potentially as molecular switches and molecular memories [11]. The keto-enol equilibrium is a characteristic property of such heterocyclic systems [12] and is known to be sensitive to solvent effects and temperature [3, 4, 13, 14]. For these kinds of molecules with possible intramolecular hydrogen bonding it is accepted that the more polarized keto form dominates in polar solvents while the less polarized enol form dominates in non-polar or slightly polar solvents [3, 15]. In some Schiff bases this effect is different, with the more polarized keto form dominating in non-polar solvents [16, 17]. Such keto/enol equilibrium was observed by means of fluorescence spectroscopy also in 9-anthrole [18] and similar compounds.
In this study we present experimental work on the 2-(4-fluorophenylamino)-5-(2,4-dihydroxybenzeno)-1,3,4-thiadiazole (FABT), see Fig. 1 [19]. This molecule is able to form an intramolecular hydrogen bond between the −OH and =N-N= groups [17], see Fig. 1. Electronic absorption and fluorescence, FTIR and Raman spectra were recorded in several solvents, both polar and non-polar, from water and alcohols up to heavier alkanes. The presence of solvents modifies the electronic spectra both in absorption and fluorescence. For non-polar solvents with high polarizability such as n-heptane, the electronic absorption spectra display a clear band at 273 nm, related to the keto form. The band centered at 340 nm, related to the enol form, is too weak to be observed in absorption spectra but is clearly visible in fluorescence spectra.
Fig. 1.
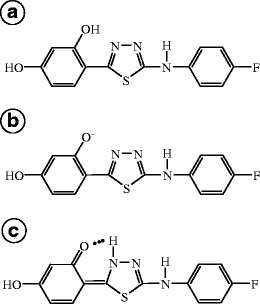
Chemical structures of FABT (a enol, b ionized c keto)
The spectral effects are usually correlated to the static (zero-frequency) dielectric constant ε and/or to the index of refraction n at optical frequencies [20, 21]. Presently, we show that the spectral changes in the absorption spectra depend more on the average electric dipole polarizability of the solvent than on the Kirkwood ratio of the dielectric constant (ε−1)/(2ε+1) or the Lorenz–Lorentz electronic polarizability (n 2−1)/(n 2+2) of the solvent [13, 22].
Materials and methods
Materials
The 2-(4-fluorophenylamino)-5-(2,4-dihydroxybenzeno)-1,3,4-thiadiazole (FABT) [10] with molecular weight of 303,31 g/mol used in this study (see Fig. 1a) was synthesized in the Department of Chemistry of the University of Life Sciences in Lublin; details of the procedure are described elsewhere [19]. The structure of the FABT is presented in the Cambridge Crystallographic Data Centre with entries: CCDC 768785–768787.
The compounds were purified by means of HPLC (YMC C-30 column with a length of 250 mm and an internal diameter of 4.6 mm). The solvent mixture of acetonitrile:CH3OH:H2O (72:8:3 by volume) was applied as a moving phase. The FABT was recrystallised from 96% methanol directly before use. In order to remove residuals of solvents (after evaporation in an N2 atmosphere), the samples were placed in a vacuum for 1.5 h. All solvents were purchased from Sigma-Aldrich Co.
Methods
Electronic absorption spectra of FABT were recorded with a double-beam UV-Vis spectrophotometer Cary 300 Bio from Varian equipped with a thermostated cuvette holder with a 6 × 6 multicell Peltier block. Temperature was controlled with a thermocouple probe (Cary Series II from Varian) placed directly into the sample.
Fluorescence excitation and emission spectra were recorded with a Cary Eclipse spectrofluorometer from Varian. Fluorescence spectra were recorded with 0.5 nm resolution and corrected for the lamp and photomultiplier spectral characteristics. The excitation and emission slits were set to 2 nm.
Measurements of ATR-FTIR background corrected spectra were carried out on the solvents using a HATR Ge trough (45° cut, yielding ten internal reflections element) crystal plate for liquids, and were recorded with a 670-IR spectrometer from Varian. Typically, 25 scans were collected, Fourier-transformed and averaged for each measurement. Absorption spectra at a resolution of one data point per 1 cm−1 were obtained in the region between 4,000 cm−1 and 400 cm−1. The instrument was continuously purged with an argon for 40 min before and during measurements. The Ge crystal was cleaned with ultra pure organic solvents from Sigma-Aldrich Co. All experiments were carried out at 20 °C. Spectral analysis was performed with Grams/AI 8.0 software from Thermo Electron Corporation.
Raman scattering spectra from the liquid samples placed onto a quartz plate (the same conditions as in FTIR experiments) were recorded with the in Via Reflex Raman Microscope from Renishaw (UK), equipped with two holographic ultrahigh precision diffraction grating stages and a high sensitivity ultralow noise CCD detector. A 514.5 nm Ar+ ion laser was used to record Raman scattering. The spectra were accumulated within a 10 s integration time. Spectral analysis was performed with Grams/AI 8.0 software from the Thermo Electron Corporation.
Results and discussion
Figure 2 presents electronic absorption spectra in the range between 240–450 nm for the FABT compound in 2-propanol and n-heptane. The absorption spectrum in 2-propanol is dominated by a peak extending from 310 nm to 370 nm and a shoulder at lower wavelengths. In n-heptane the 310–370 nm band is absent and a peak appears at 273 nm. The molar extinction coefficient is lower in n-heptane than in 2-propanol by a factor of 200. Detailed molar extinction coefficients for selected solvents used in the present research are shown in Table 1.
Fig. 2.
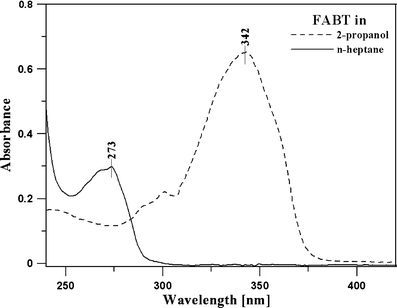
Electronic absorption spectra of FABT dissolved in 2-propanol (dotted line) and n-heptane (solid line). The molar concentration of the compounds was: c = 3.2 × 10⁻³ M in n-heptane and c = 2.2 × 10⁻⁵ M in 2-propanol. The values of the molar extinction coefficient for FABT in several organic solvents are presented in Table 1
Table 1.
Values of the molar extinction coefficients for FABT in selected solvents of the present study
| Solvents | λ [nm] | ε(ν) [cm−1 M−1] |
|---|---|---|
| DMSO | 340 | 58181 |
| 2-propanol | 342 | 19081 |
| methanol | 338 | 25078 |
| ethanol | 339 | 23548 |
| acetonitrile | 339 | 27433 |
| acetone | 340 | 22812 |
| 1-butanol | 342 | 33128 |
| n-heptane | 273 | 96 |
| undecane | 273 | 61 |
| pentane | 273 | 149 |
| cyclohexane | 273 | 95 |
Figure 3 shows normalized spectra for selected solvents—three polar (water, ethanol and 2-propanol) and two non-polar (n-heptane and CCl4). Two distinct effects can be observed. First, in the series of polar solvents we observe a broad band centered around 340 nm with the same (normalized) intensity and the same shape. The 340 nm maximum shows a slight (by a few nm) red-shift with lowering of the dipole moment (or rising dipole polarizability, see Table 2) of the solvent.
Fig. 3.
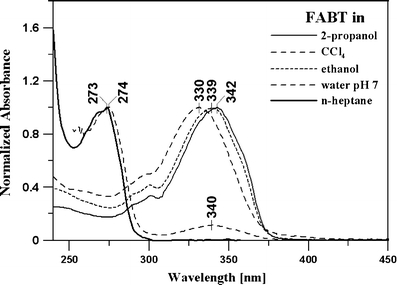
Normalized electronic absorption spectra of FABT dissolved in different solvents
Table 2.
Position of maxima in absorption spectra compared to the average dipole molecular polarizability [22], dielectric constant ε, index of refraction n, dipole moment μ [22] of the solvents. The solvents are ordered following the rising value of the polarizability
| FABT | Solvents | λ [nm] | Polarizability | ε | n | μ | ||
|---|---|---|---|---|---|---|---|---|
| enol | keto | [in Units of 10−24 cm3] | [Debye] | |||||
| Polar | 1 | H2O | 330 | – | 1.45 | 80.1 | 1.3333 | 1.855 |
| 2 | Methanol | 338 | – | 3.29 | 33 | 1.3265 | 1.700 | |
| 3 | Acetonitrile | 339 | – | 4.40 | 36.64 | 1.3416 | 3.925 | |
| 4 | Ethanol | 339 | – | 5.41 | 25.3 | 1.3594 | 1.690 | |
| 5 | Aceton | 341 | – | 6.33 | 21 | 1.3587 | 2.880 | |
| 6 | DMSO | 340 | – | 7.30 | 47.24 | 1.4773 | 3.960 | |
| 7 | 2-propanol | 342 | – | 7.61 | 20.18 | 1.3772 | 1.580 | |
| 8 | Chloroform | 339 | – | 9.50 | 4.81 | 1.4429 | 1.040 | |
| Non-polar | 9 | Pentane | – | 273 | 9.99 | 1.84 | 1.3575 | 0.130 |
| 10 | Benzene | 342 | – | 10.00 | 2.28 | 1.5011 | 0 | |
| 11 | Cyclohexane | 340 | 273 | 11.00 | 2.02 | 1.4262 | 0 | |
| 12 | Tetrachlorometane | 340 | 274 | 11.30 | 2.24 | 1.4631 | 0 | |
| 13 | n-hexane | – | 273 | 11.90 | 1.89 | 1.3723 | 0 | |
| 14 | n-heptane | – | 273 | 13.60 | 1.92 | 1.3876 | 0 | |
| 15 | Octane | – | 281 | 15.90 | 1.948 | 1.3947 | 0 | |
| 16 | Undekane | – | 280 | 21.03 | 1.997 | 1.4147 | 0 | |
| 17 | Dodekane | – | 282 | 22.75 | 2.012 | 1.4186 | 0 | |
Second, for non-polar (and high polarizability) solvents a new band centered around 273 nm appears. The 340 nm band is still present in tetrachloromethane indicating a changing equilibrium between the two forms of FABT. The 340 nm band in absorption spectra disappears in solvents with high polarizability. A similar effect was observed by Yan et al. in 3-hydroxy-2-mercaptopiridine: on changing the solvent from ethanol to n-hexane the absorption band flips from 340 nm to 273 nm. However, the authors did not discuss the effects of the solvent in detail [23].
The location of the absorption band at 273 nm and relatively low values of the molar extinction coefficient (∼100 cm−1 M−1), according to well established standards (see for ex. [24]), mark the n→π* electronic transition in the C=O group. This would indicate an internal proton transfer from the −OH group in the orto position to the nitrogen in the thiadiazole ring and the formation of the keto form of FABT, compare Fig. 1a and c. Similar, solvent-related effects were observed experimentally for numerous systems, see for ex. ref. [15–18].
The two competing enol and keto forms are also observed in fluorescence spectra of FABT in different solvents. Figure 4 shows the fluorescence emission spectra of FABT in 2-propanol (Panel a) and in n-heptane (Panel b). In 2-propanol, we observed a dual emission (Ex. 273 nm) related to the keto and the enol forms. Due to the small quantum yield of carbonyl group [21], the intensity of the band at 321 nm has to be a multiplied by factor of 20 in order to become visible. After excitation at 340 nm we observed an emission band centered at 402 nm, characteristic for the enol form. In n-heptane for the same excitations we observed an emission centered at 330 nm characteristic for the keto form and a fluorescence band characteristic for the enol form centered at 405 nm (intensity multiplies by a factor of 10). Strong relative differences in the proportions between bands in the two solvents must correspond to the changing equilibrium between the keto and enol FABT forms.
Fig. 4.
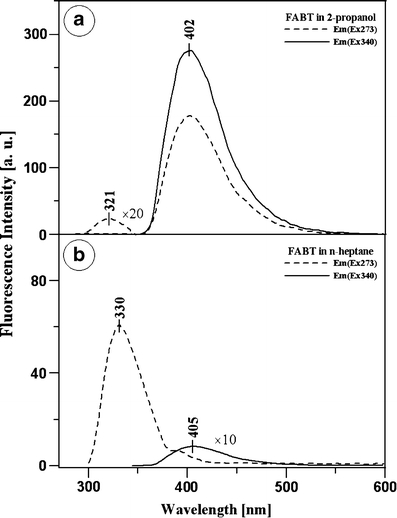
Fluorescence emission spectra of FABT in 2-propanol (Panel a) and in n-heptane (Panel b). The excitation of both samples was 273 nm and 340 nm. Double emission is observed in 2-propanol (Ex. 273 nm) related to the keto (band centered at 321 nm, intensity multiplies by a factor of 20) and enol (band centered at 402 nm, dotted line) forms. After excitation at 340 nm we observed an emission band centered at 402 nm characteristic for the enol form (solid line). In n-heptane for the same excitations we observed an emission band centered at 330 nm characteristic for the keto form and a fluorescence band characteristic for the enol form (band centered at 405 nm, intensity multiplies by a factor of 10)
To better understand the mechanism of the enol→keto transition we studied the absorption spectra for as many as 17 different solvents, both polar and non-polar (see detailed listing in Table 2 and Fig. 5 caption) and the temperature dependencies of the absorption bands, see Fig. 6.
Fig. 5.
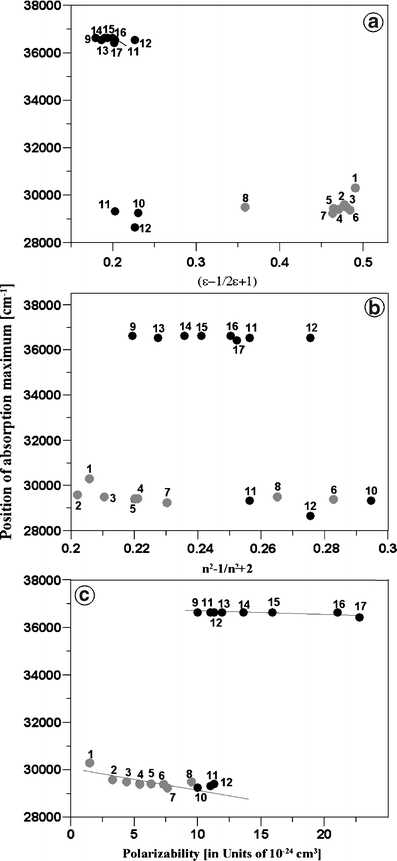
Position of the absorption maximum for the FABT (Panels a, c, e) dependent on the Kirkwood function (ε−1)/(2ε+1) of polarity (Panel a), the Lorenz–Lorentz electronic polarizability (n 2−1)/(n 2+2) of the solvents (Panel b) [13, 22] and the average electric dipole polarizabilities (in units of 10−24 cm3, Panel c). Numbers refer to the following solvents: 1—water, 2—methanol, 3—acetonitrile, 4—ethanol, 5—acetone, 6—DMSO, 7—2-propanol, 8—chloroform, 9—pentane, 10—benzene, 11—cyclohexane, 12—tetrachloromethane, 13—n-hexane, 14—n-heptane, 15—n-octane, 16—undecane, 17—dodecane. See text for further explanations. Experimental points were fitted with linear regression for the two electronic transitions, respectively (Panel c). Juxtaposition of all parameters is presented in Table 2. The gray circles indicate polar solvents
Fig. 6.
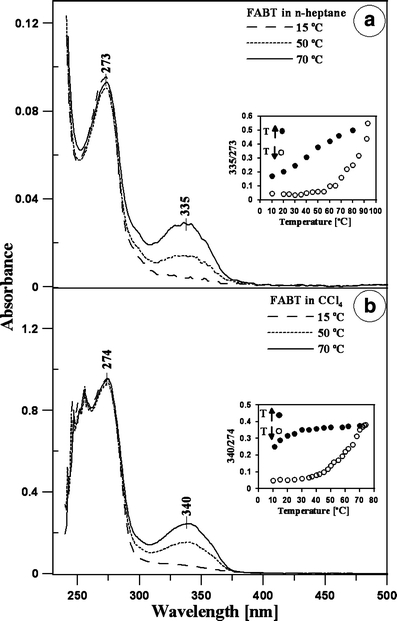
Electronic absorption spectra of FABT dissolved in n-heptane (Panel a) and CCl4 (Panel b) in the temperature range between 15–70 °C. The insets present the ratio between the enol (maximum at 335 nm in n-heptane and 340 nm in CCl4) and keto forms (maximum at 273 nm in both solvents) dependent on temperature
Regardless of chemical effects, shifts in absorption (and fluorescence) spectra are caused by relaxation of the ground and excited electronic levels of the optically active center due to the presence of the surrounding solvent molecules, see for ex. [21] for detailed discussion. The shifts in electronic absorption spectra are usually related to the most strongest, i.e. the electrostatic dipole, interaction with solvent molecules. As seen from Table 2, the positions of the two absorption bands in FABT poorly correlate to the solvent dipole moment. In Fig. 5 we show, instead, three alternative dependencies of the absorption maxima. In Fig. 5a we relate the position of the electronic absorption maxima to the Kirkwood function (ε−1)/(2ε+1) of the solvent dielectric constant ε. In Fig. 5b we relate the maxima to the Lorenz–Lorentz electronic polarizability (n 2−1)/(n 2+2) of the solvents (with n being the optical refraction constant) [13, 21, 22]. Neither Kirkwood nor Lorenz–Lorentz functions indicate any clear correlations. Therefore, in Fig. 5c we plot the position of the absorption maximum vs. the average electric dipole polarizability α of the solvent [22]. As seen from that figure, both the red-shift of the 340 nm absorption as well as the rapid transition to the 273 nm band correlate quite well with the average dipole polarizability.
As clearly seen from Fig. 5c, the enol→keto transition occurs above a certain, say threshold, value of the solvent polarizability α (about 10 × 10−24 cm3). In solvents with α at approximately this value we observed both 340 nm and 273 nm absorption peaks, see also the CCl4 spectrum in Fig. 3. To study in detail the enol-keto equilibrium we performed absorption measurements of FABT in both n-heptane and in CCl4 at different temperatures, up to 70 °C, see Fig. 6. At up to 15 °C the enol band is hardly visible either in n-heptane or in CCl4 but reappears at higher temperatures. Furthermore, this effect shows some hysteresis, see inserts in Fig. 6. Clearly, the equilibrium between the enol and keto forms of FABT depends on the temperature, as observed also for other similar systems [14, 25, 26]. In polar solvents such as ethanol and methanol, the equilibrium for FABT is strongly shifted to the enol form and the temperature effect was below our detection level as a result.
In order to more deeply understand the solvent effect on the keto enol transformation (particularly the formation of the carbonyl group, see Fig. 1c) FTIR spectroscopy was applied [15]. Figure 7 presents the ATR-FTIR spectra of the FABT samples dissolved in several solvents (for details see caption of the Fig. 8). Frequencies of FTIR and Raman (see Fig. 10) spectra assigned to specific vibration nodes are presented in Table 3. As can be seen in the spectral region between 1,680 cm−1 and 1,760 cm−1, the band increases with the peak centered at 1,739 cm−1. This band can be assigned to the valence vibrations of C=O in the keto form of the compound [27]. Because of the keto-enol equilibrium, small amounts of the keto form should also exist in polar solvents, see Figs. 7 and 9. Therefore stretching C=O vibrations are observed in all measured solvents but at different frequencies (corresponding to the solvent effect) and absorbance relative to the concentration of the keto form.
Fig. 7.
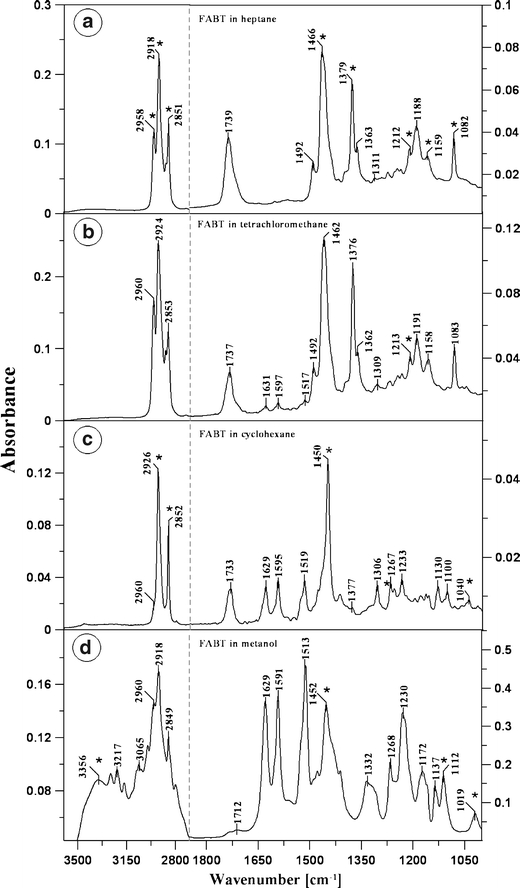
ATR-FTIR absorption spectra of FABT dissolved in n-heptane (Panel a), CCl4 (Panel b), cyclohexane (Panel c) and methanol (Panel d). Measurements were carried out on the solvents using a trough HATR Ge crystal plate for liquids
Fig. 8.
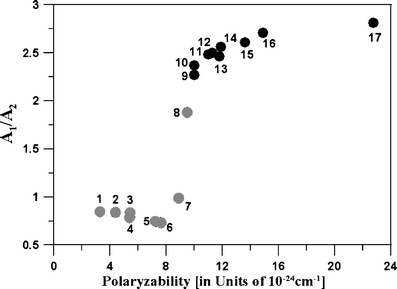
The ratio of absorbance A1/A2 (1—absorbance maximum from region between 1,710–1,716 cm−1, 2—absorbance maximum from region between 1,720–1,742 cm−1) of FABT dependent on the average electric dipole polarizabilities (in units of 10−24 cm3). Numbers refer to the following solvents: 1—methanol, 2—acetonitrile, 3—ethanol, 4—ethanol (pure from water) 5—DMSO, 6—2-propanol, 7—butanol, 8—chloroform, 9—pentane, 10—benzene, 11—cyclohexane, 12—tetrachloromethane, 13—toluene, 14—n-hexane, 15—n-heptane, 16—xylene, 17—dodecane. See text for further explanations. Grey circles indicates polar solvents
Fig. 10.
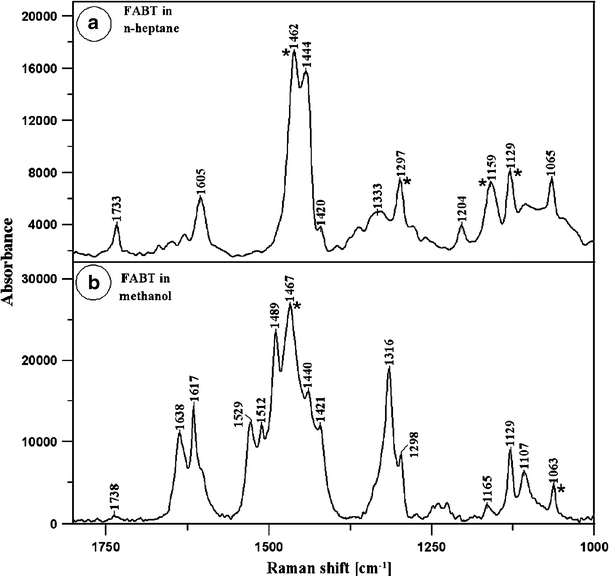
Pre-resonance Raman spectra (Ex. 514 nm) of FABT dissolved in n-heptane (Panel a) and methanol (Panel b)
Table 3.
The position of FTIR and Raman vibrations. The asterisk symbol denotes both the solvent and molecule band
| FTIR | Raman | Vibration | ||||
|---|---|---|---|---|---|---|
| Band position [cm−1] | ||||||
| n-heptane | tetrachloro–methane | Cyclohexane | methanol | n-heptane | methanol | |
| – | – | – | 3356* | – | – | ν (O-H) |
| – | – | – | 3217 | – | – | ν (N-H) |
| – | – | – | 3065 | – | – | νs+as (C-H) |
| 2958* | 2960 | 2952 | 2960 | – | – | |
| 2918* | 2924 | 2926* | 2918 | – | – | |
| 2851* | 2853 | 2852* | 2849 | – | – | |
| 1739 | 1737 | 1733 | 1712 | 1733 | 1738 | ν (C=O) |
| – | 1631 | 1629 | 1629 | 1605 | 1638 | ν (C=N) |
| – | 1597 | 1595 | 1591 | – | 1617 | |
| – | – | – | – | – | 1529 | |
| 1517 | 1519 | 1513 | – | 1512 | ν (C=C) | |
| 1492 | 1492 | 1489 | ||||
| 1466* | 1462 | 1450* | 1452* | 1462* | 1467* | δ (C-H) + ν (C=C) |
| – | – | – | – | 1420 | 1421 | |
| 1379* | 1376 | 1377 | – | – | – | ν (C-N) in C=N-C δ (C-H) |
| 1363 | 1362 | – | – | 1362 | – | |
| 1311 | 1309 | 1306 | 1332 | 1333 | 1316 | ν (C-O) |
| – | – | 1267* | 1268 | 1297* | 1298 | δ (N-H) + ν (C-N) |
| 1212* | 1213* | 1233 | 1230 | 1260 | 1227 | |
| 1188 | 1191 | 1130 | 1172 | 1204 | – | δ (C-C) in C-(C=O)-C |
| 1159* | 1158 | – | 1137 | 1159* | 1165 | |
| – | – | – | 1112* | 1107 | 1107 | ν (C-N) |
| 1082* | 1083 | 1100 | – | – | – | ν (C-F) |
| – | – | 1040* | 1019* | 1065 | 1063* | |
ν valence vibration, δ deformation, s symmetric, as asymmetric
Fig. 9.
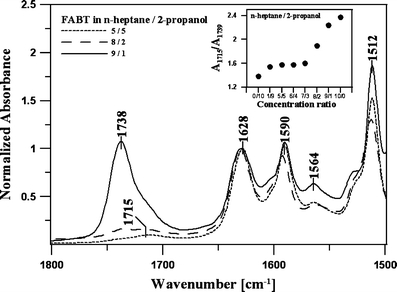
Normalized ATR-FTIR spectra performed for different ratios of n-heptane/2-propanol. The inset in this figure shows the ratio of 1,715/1,738 cm−1 related to the C=O group
Similar to the effect presented in Fig. 5, the position of the C=O vibration is shifted towards higher frequency values in solvents with growing polarizability. As can be seen in Fig. 8, the absorbance ratio 1,715/1,739 cm−1 characteristic for the position of the carbonyl group in different solvents strongly depends on the polarizability of the solvent. This effect is probably related to the hydrogen bond between C=O…H-N in polar solvents (lower band frequencies) while for solvents of high polarizability (and non-polar) the carbonyl group is free (not hydrogen bonded). This can be explained by the rotation of the resorcinol ring with respect to the thiadiazole ring as was observed in X-ray studies [28].
We do not exclude aggregation effects in the cases of the keto and enol forms either. A band corresponding to C=O vibrations (centered at 1,733 cm−1) was also observed in pre-resonance Raman spectroscopy (Ex. 514 nm), as can be seen in the spectrum shown in Fig. 10. For the samples dissolved in methanol, this band was not clearly observed. Figure 7d shows two sharp bands with maxima at 1,629 cm−1 and 1,591 cm−1, typical for stretching vibrations of the C=N groups (vibration is also present in the Raman spectrum at 1,605 cm−1, see Fig. 10). The band centered at 1,513 cm−1 is related to the skeletal stretching vibrations of the C=C group in the aromatic ring [12]. The spectrum with an absorption band at 1,230 cm−1 of FABT (Panel d) related to C-NH is due to the interaction between the N-H deformation and the C-N valence vibrations. The band centered around 1,450 cm−1 is characteristic for the bending vibrations of the C-H group.
Figure 9 presents the FTIR spectra performed for different ratios of n-heptane/2-propanol: the keto-enol equilibrium strongly depends on the solvents composition. The inset in this figure shows that for the ratio 7/3, domination of the band centered at 1,738 cm−1 related to the free carbonyl group is observed (as mentioned above).
We deduce from additional pH-metric measurements (not shown here) that in polar solvents (low polarizability) the FABT molecule is deprotonated (-OH group in the orto position, pK = 8.6, see Fig. 1b). In solvents with high polarizability (and zero or low dipole moment) the equilibrium is influenced only by the induced dipole moment of the solvent.
The very dependence of the enol→keto transition on the solvent polarizability remains somewhat surprising. The physical meaning of the polarizability is a deformation of the molecule’s electronic configuration which adjusts to a variable external electric field. Studies of electronic excitations by electron scattering are curently the most accurate way of determining molecular polarizabilities [29]. The possible importance of polarizability in the observed intramolecular proton transfer effects is probably related to the short range of this interaction. By a broad analogy, we note that polarization effects induce high cross sections in positron (i.e. positive-charge electron) collisions with organic molecules, in the limit of zero collision energies [30, 31].
Conclusions
Electronic absorption spectra of FABT exhibit a dual feature: in solvents with low polarizability (and independently of the polar or non-polar character of the solvent) they show a domination of the absorption band around 330–340 nm. In solvents with high polarizability such as n-heptane (dipole moment equal to zero), we observe a strong increase of the band in the range of 260–280 nm. FTIR and Raman spectra confirm that this change is due to the transformation from the enol to keto form in such solvents. In some way, the solvent intermediates in the keto/enol equilibrium and thus in the intramolecular proton transfer. We note that often, in discussions of solvent effects, polar and non-polar solvents are compared and the shifts in absorption spectra are related to the dipole moment of the solvent. In this case the shift was not related to the solvent polarity [17] but rather to its polarizability.
We additionally show that the equilibrium between the enol and keto forms of FABT depends on the temperature showing some hysteresis effects.
We emphasize that the formation of 1,3,4-thiadiazoles in the keto form may only be interesting not theoretically, but also be of a great practical importance related to the formation of more biologically active pharmaceutics, able to interact more efficiently with cell membranes [32]. From the analogy of the n-alkane solvents to the alkyl part of the lipids, one can expect that the transformation of the 1,3,4-thiadiazoles to the keto form may be possible in the hydrophobic zone of the lipid membrane. The analysis of the molecular organization in organic solvents may provide significant insights into the potential pharmacological application of the 1,3,4-thiadiazole compounds.
Acknowledgements
We dedicate this paper to the memory of Prof. Aleksander Jabłoński (1898–1980). His papers [33, 34] elucidated, for the first time, the shifts of absorption and fluorescence spectra throught interactions with solvents. One of us (MG) gives thanks to Małgosia for her patience and silent support; GK reiterates gratitude to NMP.
Open Access
This article is distributed under the terms of the Creative Commons Attribution Noncommercial License which permits any noncommercial use, distribution, and reproduction in any medium, provided the original author(s) and source are credited.
References
- 1.Wang J, Boyd R. Tautomeric equilibria of hydroxypyridines in different solvents:an ab initio study. Jn Phys Chem. 1996;100:16141–16146. doi: 10.1021/jp961295z. [DOI] [Google Scholar]
- 2.Rappaport Z (1990) The chemistry of enols. Wiley (ed) Wiley, Chichester
- 3.Lu J, Han B, Yan H. Thermodynamic studies of chemical equilibrium in supercritical carbon dioxide-cosolvent solutions using UV-Vis spectroscopy. Jn Supercritical Fluids. 1999;15(2):135–143. doi: 10.1016/S0896-8446(98)00132-6. [DOI] [Google Scholar]
- 4.Yonet N, Bicak N, Yurtsever M, Yagci Y (2007) Spectroscopic and theoretical investigation of capillary-induced keto-enol tautomerism of phenacyl benzoylpyridinium-type photoinitiators. Polym Int 56(4)
- 5.Douhal A, Angulo G, Gil M, Organero JA, Sanz M, Tormo L. Observation of three behaviors in confined liquid water within a nanopool hosting proton-transfer reactions. Jn Phys Chem B. 2007;111(19):5487–5493. doi: 10.1021/jp068764+. [DOI] [PubMed] [Google Scholar]
- 6.Douhal A, Sanz M, Tormo L, Organero JA. Femtochemistry of inter- and intramolecular hydrogen bonds. Chem Phys Chem. 2005;6(3):419–423. doi: 10.1002/cphc.200400375. [DOI] [PubMed] [Google Scholar]
- 7.Das K, Sarkar N, Ghosh AK, Majumdar D, Nath DN, Bhattacharyya K. Excited-state intramolecular proton transfer in 2- (2-hydroxyphenyl) benzimidazole and -benzoxazole: effect of rotamerism and hydrogen bonding. Jn Phys Chem. 1994;98:9126–9132. doi: 10.1021/j100088a006. [DOI] [Google Scholar]
- 8.Douhal A, Amat-Guerri F, Lillo P, Acuña AU. Proton-transfer Spectroscopy of 2-(2´-Hydroxyphenyl) Imidazole and 2-(2´-Hydroxyphenyl) benzimidazole dyes. J Photochem Photobiol Part A. 1994;78:127–138. doi: 10.1016/1010-6030(93)03724-U. [DOI] [Google Scholar]
- 9.Dieckmann H, Kreuzig R, Bahadir M. Significance of keto-enol-tautomery in the analysis of 1, 2, 4-triazinone metabolites. Jn Analytical Chem. 1994;348:749–753. [Google Scholar]
- 10.Rzeski W, Matysiak J, Kandefer-Szerszen M. Anticancer, neuroprotective activities and computational studies of 2-amino-1, 3, 4-thiadiazole based compound. Bioorg Med Chem. 2007;15(9):3201–3207. doi: 10.1016/j.bmc.2007.02.041. [DOI] [PubMed] [Google Scholar]
- 11.Nishiya T, Yamauchi S, Hirota N, Baba M, Hanazaki I. Fluorescence studies of intramolecularly hydrogen-bonded o-hydroxyacetophenone, salicylamide, and related molecules. Jn Phys Chem. 1986;90:5730. doi: 10.1021/j100280a053. [DOI] [Google Scholar]
- 12.Gagoś M, Menestrina G, Niewiadomy A, Gruszecki WI. Molecular organization of the antifungal and anticancer drug 2-(2, 4-dihydroxyphenylo)-5, 6-dichlorobenzothiazole in solution and in monolayers: an effect of pH. Jn Photochem Photobiol B. 2005;80(2):101–106. doi: 10.1016/j.jphotobiol.2005.03.004. [DOI] [PubMed] [Google Scholar]
- 13.Reichardt C. Solvents and solvent effects in organic chemistry. KGaA: WILEY-VCH Verlag GmbH & Co; 2003. [Google Scholar]
- 14.Kolehmainen E, Osmialowski B, Nissinen M, Kauppinen R, Gawinecki R. Substituent and temperature controlled tautomerism of 2-phenacylpyridine:the hydrogen bond as a configurational lock of (Z)-2-(2-hydroxy-2-phenylvinyl)pyridine. Jn Chem Soc Perkin Trans. 2000;2:2185–2191. doi: 10.1039/b006879i. [DOI] [Google Scholar]
- 15.Akama Y, Tong A. Spectroscopic studies of the keto-enol tautomers of 1-phenyl-3-methyl-4-benzoyl-5-pyrazolone. Microchemical Jn. 1996;53(1):34–41. doi: 10.1006/mchj.1996.0006. [DOI] [Google Scholar]
- 16.Koll A. Specific features of intramolecular proton transfer reaction in schiff bases. Int Jn Mol Sci. 2003;4:434–444. doi: 10.3390/i4070434. [DOI] [Google Scholar]
- 17.Rospenk M, Król-Starzomska I, Filarowski A, Koll A. Proton transfer and self-association of sterically modified Schiff bases. Chem Phys. 2003;287(1–2):113–124. doi: 10.1016/S0301-0104(02)00983-7. [DOI] [Google Scholar]
- 18.Fujii T, Kodaira K, Kawauchi O, Tanaka N. Photochromic behavior in the fluorescence spectra of 9-anthrol encapsulated in Si–Al glasses prepared by the sol–gel method. Jn Phys Chem B. 1997;101(50):10631–10637. doi: 10.1021/jp971540u. [DOI] [Google Scholar]
- 19.Niewiadomy A, Matysiak J (2003) The method of synthesis of 2-aryl(alkyl, alkenyl)amino-5-(2,4-dihydroxybenzene)-1,3,4-thiadiazoles. Patent pending, P362805
- 20.Mac M, Tokarczyk B, Uchacz T, Danel A. Charge transfer fluorescence of benzoxazol derivatives investigation of solvent effect on fluorescence of these dyes. Jn Photochem Photobiol A. 2007;191(1):32–41. doi: 10.1016/j.jphotochem.2007.04.001. [DOI] [Google Scholar]
- 21.Lakowicz J. Principles of fluorescence spectroscopy. 3. New York: Springer; 2006. [Google Scholar]
- 22.Lide DR. CRC handbook of chemistry and physics. 87. Boca Raton: Taylor and Francis; 2007. [Google Scholar]
- 23.Yan W, Xue Y, Zhu H, Zeng J, Xie D. A theoretical study of solvent effects on tautomerism and electronic absorption spectra of 3-hydroxy-2-mercaptopyridine and 2, 3-dihydroxypyridine. Jn Comput Chem. 2004;25(15):1833–1839. doi: 10.1002/jcc.20123. [DOI] [PubMed] [Google Scholar]
- 24.Murthy ASN, Balasubramanian A, Rao CNR. Spectroscopic study of keto-enol equilibria. Canadian Jn Chemistry. 1962;50:2267–2271. doi: 10.1139/v62-351. [DOI] [Google Scholar]
- 25.Zaleska B, Burgiel MM, Serda P. Spectroscopic study of the keto-enol equilibrium of N-aryldiacetylthioacetamides and their reactivity. Chem Heterocyc Comp. 2008;44(3):349–355. doi: 10.1007/s10593-008-0051-3. [DOI] [Google Scholar]
- 26.Novak P, Skare D, Sekusak S, Vikic-Topic D. Substituent, temperature and solvent effects on keto-enol equilibrium in symmetrical pentane-1, 3, 5-triones. Nuclear magnetic resonance and theoretical studies. Croatia Chemica Acta. 2000;73(4):1153–1170. [Google Scholar]
- 27.Inuzuka K, Ito M, Imanishi S. Effect of solvent on carbonyl stretching frequency of ketones. Bull Chem Soc Jpn. 1961;34(4):467–471. doi: 10.1246/bcsj.34.467. [DOI] [Google Scholar]
- 28.Kamiński D, Hoser A, Gagoś M, Matwijczuk A, Niewiadomy A, Arczewska M, Woźniak K (2010) Solvatomorphism of protonated 2-(4-fluorophenylamino)-5-(2,4-dihydroxybenzeno)-1,3,4-thiadiazole, an X-ray diffraction study. Jn Crystal Growth & Design submited
- 29.Renfei F, Brion CE. Quantitative photoabsorption of diethyl ether in the valence and carbon 1 s inner shell regions (5–360 eV) Chem Phys Lett. 2002;284:615–623. [Google Scholar]
- 30.Idziaszek Z, Karwasz G. Applicability of modified effective-range theory to positron-atom and positron-molecule scattering. Phys Rev A. 2006;73:64701. doi: 10.1103/PhysRevA.73.064701. [DOI] [Google Scholar]
- 31.Karwasz GP, Karbowski A, Idziaszek Z, Brusa RS. Total cross sections for positron scattering on benzene—angular resolution corrections. Nucl Instr Meth B. 2008;266:471. [Google Scholar]
- 32.Gagoś M, Niewiadomy A, Gruszecki WI. Molecular organization of the antifungal and anticancer drug 2-(2, 4-dihydroxyphenylo)-5, 6-dichlorobenzothiazole (dHBBT) in solution and in lipid membranes studied by means of electronic absorption spectroscopy. Jn Photochem Photobiol B. 2004;76(1–3):33–40. doi: 10.1016/j.jphotobiol.2004.07.002. [DOI] [PubMed] [Google Scholar]
- 33.Jablonski A. Efficiency of anti—stokes fluorescence in dyes. Nature. 1933;131:839. doi: 10.1038/131839b0. [DOI] [Google Scholar]
- 34.Jablonski A. Uber den Mechanismus der Photolumineszenz von Farbstoffphosphoren. Zeitschrift fur Physik. 1935;94:38–46. doi: 10.1007/BF01330795. [DOI] [Google Scholar]