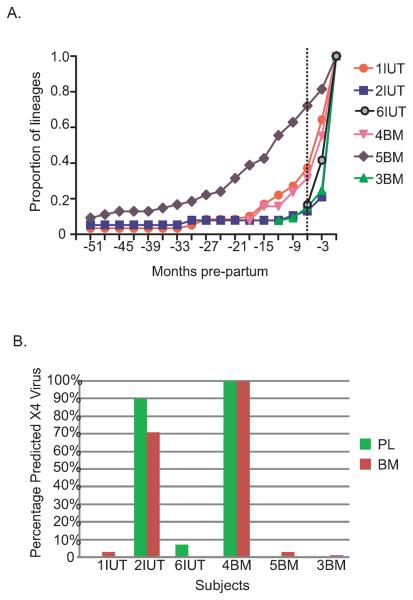
Figure 3. Exponential growth of viral lineages and predicted X4 usage.
A. The proportion of lineages (based on the total number of lineages present at delivery, on y-axis) inferred from the MCC trees (Fig. 1) is plotted for each three month period pre-partum (x-axis) for six subjects. The timescale is the same as for the MCC trees in Figure 1. The dotted line corresponds with the onset of Lactogenesis I at -6 months pre-partum. B. The percentages of the total number of sequences for either plasma or breast milk sequences predicted to use the CXCR4 co-receptor based on the subtype C specific PSSM algorithm are shown as bars. Green bars indicates plasma, red bars indicates breast milk.

