Abstract
The human intestinal di-/tripeptide transporter (hPEPT1) is a 12-transmembrane protein that facilitates transport of peptides from the intestine into the circulation. hPEPT1 is also an important target in oral delivery of drugs, but mechanistic and structural data for the protein are limited. In particular, there is little information on the function of the loops of the transporter. In this study, we show that mutation of several charged residues in the largest intracellular loop of hPEPT1 (loop 6–7, amino acids 224–278) significantly reduces hPEPT1 function. This loop has an asymmetric distribution of charged residues, with only positive charges in the N-terminal half and all five negative charges in the loop located in a small part of the C-terminal half. Point mutagenesis to alanine of three positive residues in the N-terminal half of loop 6–7 and four negative residues in the C-terminal half of the loop significantly reduced glycylsarcosine uptake. E267 was particularly sensitive to mutation, and kinetic analyses of E267A- and E267K-hPEPT1 gave Vmax values 10-fold lower than that for the wild-type protein. Secondary structure prediction suggested that loop 6–7 includes two amphipathic α-helices, with net positive and negative charges, respectively. We interpret the mutagenesis data in terms of interactions of the charged residues in loop 6–7 that may influence conformational changes of hPEPT1 during and after substrate transport.
Keywords: Protein structure–function, Site-directed mutagenesis, Kinetic analysis, Uptake assessment, Computer modeling
Introduction
The human dipeptide transporter (hPEPT1) is primarily expressed on the apical membrane of small intestinal epithelial cells (Liang et al. 1995). hPEPT1 has an important physiological role in uptake into the circulation of di- and tripeptides originating from digestion of dietary proteins (Rubio-Aliaga and Daniel 2008). In addition to its natural substrates, hPEPT1 transports many pharmacologically active peptidomimetics, including β-lactam antibiotics and angiotensin-converting enzyme (ACE) inhibitors and antiviral and anticancer agents such as valacyclovir (Rubio-Aliaga and Daniel 2008; Brandsch et al. 2008). The broad substrate specificity and high capacity of hPEPT1 make it an attractive target for oral drug delivery.
hPEPT1 is a proton-coupled symporter with 12 α-helical transmembrane domains (TMDs) (Covitz et al. 1998), of which TMDs 3, 5, 7 and 10 have been proposed to form part of the substrate translocation pathway (Links et al. 2007; Kulkarni et al. 2003a, b; Xu et al. 2009). As might be expected, charged residues in the TMDs play crucial roles in substrate transport. E595 in TMD 10 is essential for function and R282 in TMD 7 also has a key role (Xu et al. 2009). In rabbit PEPT1, R282 links transport of the substrate and proton (Meredith 2004), and findings in the human and rabbit proteins suggest that a salt bridge forms between R282 and D341 in TMD 8 (Kulkarni et al. 2007; Meredith 2009).
Compared to the TMDs, there is little information on the loops of hPEPT1. The longest loop (about 200 amino acids) connects TMDs 9 and 10 extracellularly but may not be essential for function (Daniel 2004; Meredith and Price 2006). YdgR, a related Escherichia coli oligopeptide transport protein, is not as large as hPEPT1 due to the absence of this loop (Daniel 2004); and rPEPT1 is functional after truncation of the loop (Meredith and Price 2006). The largest intracellular loop (55 amino acids, K224–K278) in hPEPT1 connects TMDs 6 and 7 (loop 6–7). This loop contains a high number of charged amino acids (16 K and R, 5 D and E), but there is no information on the structure. A secondary structure prediction (see below) suggests that each half of loop 6–7 contains an amphipathic α-helix, with the helix in the N-terminal half containing five positive charges and that in the C-terminal half containing all five negative charges in the loop. These properties prompted us to investigate a possible functional role of loop 6–7. We found that mutagenesis to alanine of three positive and four negative residues in loop 6–7 reduced glycylsarcosine (Gly-Sar) uptake, with a particularly large effect for the E267A mutation. We interpret these data using secondary structure predictions and comparison with the structure of the E. coli lac permease (LacY) (Abramson et al. 2003) since PEPT1 and LacY are both members of the major facilitator superfamily and may have structural similarities (Saier et al. 2006).
Materials and Methods
Materials
[3H]Gly-Sar (250 mCi/mmol) was purchased from Moravek Biochemicals (Brea, CA). Cell culture media and supplies were obtained from Invitrogen (Carlsbad, CA). Sulfo-NHS-LC-Biotin and streptavidin agarose resin were purchased from Pierce (Rockford, IL). All other reagents were of the highest purity available commercially. Rabbit polyclonal anti-hPEPT1 (sc-20653) and rabbit monoclonal anti-β1-integrin antibody were purchased from Santa Cruz Biotechnology (Santa Cruz, CA) and Abcam (Cambridge, MA), respectively.
DNA Preparation and Transfection in HEK293 Cells
The site-directed mutagenesis protocol and transient transfection of cDNAs into HEK293 cells were performed as previously described (Xu et al. 2009). The pcDNA3-hPEPT1 plasmid was used as a template for all mutagenesis reactions. Oligonucleotides were custom synthesized (Integrated DNA Technologies, Coralville, IA) for all site-directed mutations in this study. The Gene Editor site-directed mutagenesis kit (Promega, Madison, WI) was used to generate all mutations. HEK293 cells were obtained from the American Type Culture Collection (ATCC CRL-1573, Manassas, VA). At 72 h posttransfection, cells were used for evaluation of [3H]-Gly-Sar uptake and assays were performed to show cell surface expression.
Immunolocalization
The procedure for immunofluorescence microscopy staining has been described in detail previously (Xu et al. 2009). Transfected or MOCK cells were seeded onto coverslips and cultured for 48 h. Coverslips were then incubated with 3.7% formaldehyde in phosphate-buffered saline (PBS) at room temperature for 20 min. After washing three times with PBS, coverslips were permeabilized with 0.5% Triton X-100 for 15 min, washed once with PBS, then blocked with 1% bovine serum in PBS at room temperature for 30 min. After washing once with 0.05% Tween 20 in PBS (PBST), coverslips were incubated with 1:100 rabbit polyclonal anti-hPEPT1 overnight at 4°C. After washing three times with PBST, coverslips were incubated with FITC-conjugated secondary antibodies for 1 h, then washed again with PBST (twice) and PBS (once). Finally, coverslips were mounted onto slides with antifade medium and examined by fluorescence microscopy.
Cell Surface Biotinylation and Western Blotting
Surface proteins in HEK293 cells transfected with pcDNA3-hPEPT1 were biotinylated with EZ-Link Sulfo-NHS-LC-Biotin (1.5 mg/ml) in PBS for 30 min at 4°C. Cell lysates were then incubated with streptavidin agarose resin to precipitate biotinylated proteins. Bound proteins were eluted with SDS sample buffer and fractionated by electrophoresis on an 8% polyacrylamide electrophoresis gel, blotted onto Trans-Blot transfer medium pure nitrocellulose membranes (Bio-Rad, Hercules, CA), probed with 1:500 affinity purified and anti-hPEPT1 primary antibody (Santa Cruz Biotechnology) and visualized with secondary antibody and chemiluminescence. Rabbit monoclonal anti-β1-integrin antibody was used as the positive control (Abcam).
Uptake Assay
After washing with transport medium (MTS-Tris, pH 6), transfected HEK293 cells were incubated for 10 min at 37°C with a solution containing [3H]Gly-Sar (0.5 μCi/ml). After washing thrice in ice-cold MES-Tris, cells were lysed in 1 ml lysis buffer. BCA protein assay reagents were used to determine the protein content of each well and the cell-associated radioactivity was measured in a Wallac MicroBeta Trilux microplate liquid scintillation counter (Perkin-Elmer, Norwalk, CT). Mock and wild-type (WT) hPEPT1-transfected HEK293 cells were used as negative and positive controls, respectively.
Data Analysis
Data for each experiment were obtained from cultured cells from at least two different batches. Prism (GraphPad Software, San Diego, CA) was used to perform curve fitting and statistical analyses. Data were assessed using t tests and one- or two-way ANOVA with Dunnett's multiple comparison and a Bonferroni correction when warranted. Statistical significance was defined as P < 0.05. Kinetic analysis of Gly-Sar uptake was performed using the Michaelis–Menten equation, V = Vmax[S]/(Km + [S]), where V is the initial uptake rate of Gly-Sar, Vmax is the maximum uptake velocity, [S] is the concentration of Gly-Sar and Km is the Michaelis constant.
Results
Mutagenesis and Cell Surface Expression
Sixteen charged residues in loop 6–7 were individually mutated to alanine. Each mutated transporter was transiently transfected into HEK293 cells and its membrane expression level evaluated with immunofluorescence microscopy and biotinylation followed by Western blotting (Fig. 1). All transporters exhibited similar plasma membrane expression compared with WT-hPEPT1.
Fig. 1.
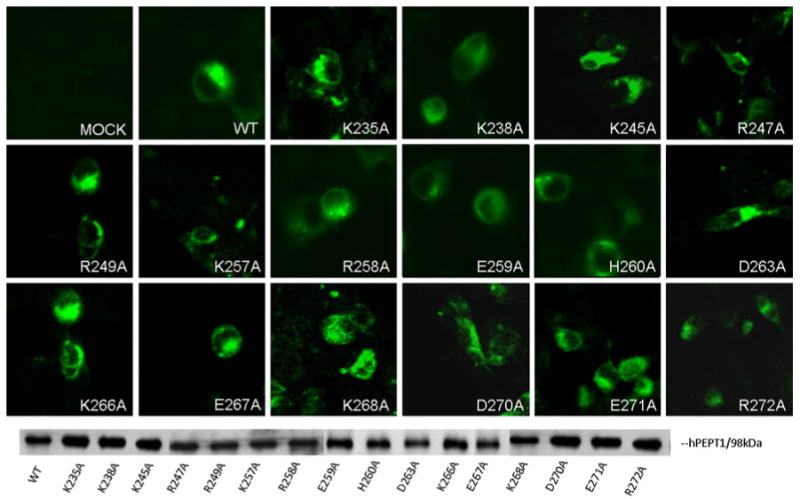
Membrane localization of wild-type (WT) and mutated hPEPT1 transporters in HEK293 cells. Transfected HEK293 cells were subjected to immunofluorescence microscopy using affinity-purified rabbit anti-hPEPT1 primary antibody and FITC-conjugated secondary antibody, both at a dilution of 1:500, 72 h posttransfection. HEK293 cells with transfected proteins were biotinylated with sulfo-NHS-LC biotin for 30 min at room temperature. Immunoprecipitation was carried out, followed by Western blot analysis using affinity-purified rabbit anti-hPEPT1 primary antibody (1:500), with visualization using goat-anti-rabbit HRP-conjugated secondary antibody (1:10,000) and chemiluminescence
Uptake Activity of Mutated Transporters
Gly-Sar uptake for each of the 16 mutated transporters is shown relative to that of WT-hPEPT1 in Fig. 2. Mutation to alanine of the three positively charged residues in the center of the N-terminal half of loop 6–7 (K238, K245, R247) caused a significant reduction in Gly-Sar uptake, whereas mutation of K235 and R249 did not do so. Similarly, mutation of four negatively charged amino acids (D263, E267, D270, E271) significantly reduced Gly-Sar uptake, but mutation of E259 did not do so. Mutation of the positively charged residues in the C-terminal half of the loop had no significant effect on uptake.
Fig. 2.
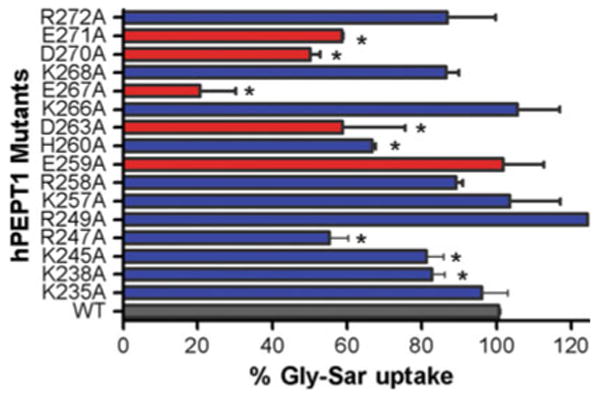
Percentage of Gly-Sar uptake activities by transporters with alanine mutations of residues in loop 6–7 of hPEPT1 relative to WT-hPEPT1 (n = 4–7 experiments per mutation). [3H]Gly-Sar uptake (0.5 μCi/ml, 10 min at 37°C) was measured 72 h posttransfection in HEK293 cells. Background uptake of mock-transfected HEK293 cells was subtracted. *P < 0.05 vs. WT-hPEPT1 uptake
Properties of Transporters with E267 Mutations
The E267A mutation resulted in more than 80% reduction of Gly-Sar uptake (Fig. 2). To probe the function of E267, we generated further mutations at this position and measured Gly-Sar uptake (Fig. 3). Replacement of the negative charge with a positive charge (E267K-hPEPT1) also significantly reduced uptake function, whereas the E267D mutation caused no significant change in Gly-Sar uptake (Fig. 3). We also examined Gly-Sar uptake by a charge-reversed doubly mutated transporter (K245E/E267K-hPEPT1), based on the apparent central location of positions 245 and 267 in the N-terminal and C-terminal halves of loop 6–7, respectively. The almost complete elimination of uptake for this transporter (Fig. 3) suggests that there is no direct functional interaction between the residues at these positions. Immunofluorescence and cell surface biotinylation followed by Western blot analysis (Fig. 4) confirmed that all E267 mutants had similar levels of surface expression to that of WT-hPEPT1.
Fig. 3.
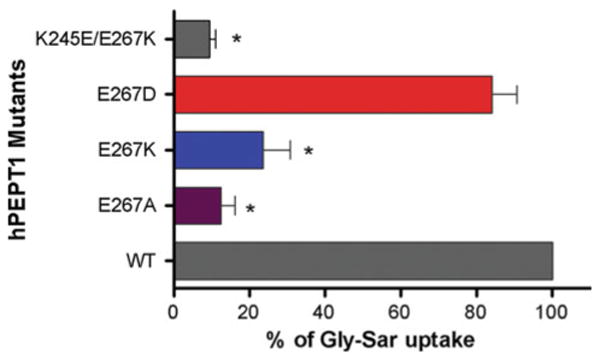
Percentage of Gly-Sar uptake by transporters with E267 mutations relative to WT-hPEPT1. *P < 0.05 vs. WT-hPEPT1
Fig. 4.
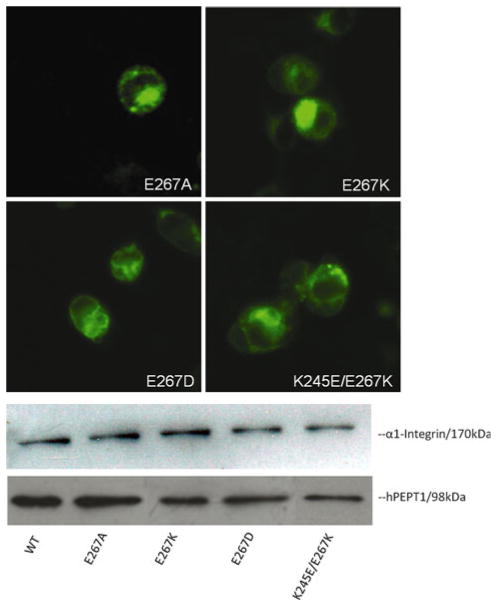
Membrane expression of mutants at E267 of hPEPT1 in transiently transfected HEK293 cells after 72 h posttransfection. Membrane localization was visualized with affinity-purified rabbit anti-hPEPT1 primary antibody (1:200) and FITC-conjugated secondary antibody (1:200). HEK293 cells with transfected proteins were biotinylated with sulfo-NHS-LC biotin for 30 min at room temperature. Immunoprecipitation was carried out, followed by Western blot analysis using affinity-purified rabbit anti-hPEPT1 primary antibody (1:500), with visualization using goat anti-rabbit HRP-conjugated secondary antibody (1:10,000) and chemiluminescence. α1-integrin (1:10,000) was used as the internal control
The time courses for accumulation of Gly-Sar in HEK293 cells transfected with WT-hPEPT1 and three transporters with E267 mutations are shown in Fig. 5a. Accumulation of Gly-Sar by WT-hPEPT1-transfected cells was more than 100 times that of mock-transfected HEK293 cells (data not shown). Initial uptake rates were determined within 2 min after onset and plotted against the Gly-Sar concentration (Fig. 5b). The initial uptake rate is saturated at high concentrations of Gly-Sar. The estimated Km and Vmax values for WT-hPEPT1 (Table 1) are consistent with those found previously in HEK293 cells (Bolger et al. 1998). For E267D-hPEPT1, Km was similar to that for WT-hPEPT1 and Vmax was about 30% smaller than the wild-type value. The Km values for E267A- and E267K-hPEPT1 were difficult to measure accurately because of the low uptake of these transporters but did not appear to differ significantly from Km for WT-hPEPT1. However, the Vmax values for E267A- and E267K-hPEPT1 were only 10% of the wild-type value.
Fig. 5.
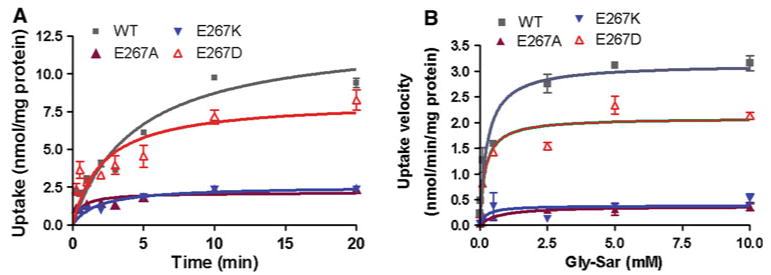
a Time courses of Gly-Sar uptake by WT-hPEPT1 (gray) and E267D (red), E267A (purple) and E267K (blue) mutants (n ≥ 3 for each point). b Concentration dependence of Gly-Sar uptake by WT-hPEPT1 and E267 mutants in transiently transfected HEK293 cells. Initial uptake rates were determined by linear regression analysis of the linear portion of the plot of Gly-Sar uptake vs. time (Color figure online)
Table 1. Kinetic parameters for uptake mediated by WT-hPEPT1 and E267 mutants.
| Transporter | Km (μM) | Vmax (nmol/mg protein/min)a | r2b |
|---|---|---|---|
| Wild type | 269.0 ± 67.9 | 3.14 ± 0.14 | 0.916 |
| E267A | 672.3 ± 434.4 | 0.37 ± 0.05 | 0.675 |
| E267K | 231.7 ± 264.6 | 0.39 ± 0.08 | 0.377 |
| E267D | 193.7 ± 52.9 | 2.09 ± 0.10 | 0.901 |
Determined by best nonlinear fit using Michaelis–Menten kinetics
Regression coefficient for best fit
Secondary Structure Prediction of Loop 6–7
Secondary structure predictions were performed to investigate the possible structure of loop 6–7 (Fig. 6a). The consensus of predictions by six algorithms indicated two helical regions in the loop: one in the N-terminal half and the other in the C-terminal half. The residues that showed a significant influence on hPEPT1 function after mutagenesis are all in or close to the predicted helical regions. The most important negatively charged residue, E267, lies in the middle of the predicted C-terminal helix. To validate these findings, we performed similar predictions for loop 6–7 of the E. coli lac permease (LacY) (Fig. 6b), for which the X-ray structure has been determined (Abramson et al. 2003). PEPT1 and LacY are members of the major facilitator superfamily, and proteins in this family may share similar structure (Saier et al. 2006). Furthermore, the largest intracellular loop in LacY also occurs between TMDs 6 and 7. The LacY structure was determined in the posttransport state and has loop 6–7 in an extended conformation with two short helical regions in the C- and N-terminal halves of the loop (Abramson et al. 2003). The secondary structure prediction also shows helices in the two halves of LacY loop 6–7 (Fig. 6b). This is consistent with the X-ray structure and similar to the prediction for hPEPT1, despite the lack of sequence homology between the loops of the two proteins.
Fig. 6.
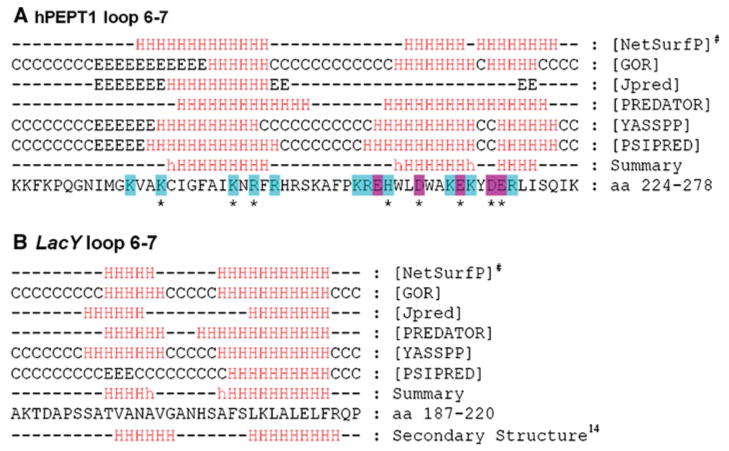
Secondary structure predictions for loop 6–7 in hPEPT1 and LacY. Predictions were made using the online servers of six programs: NetSurfP (Petersen et al. 2009), GOR (Sen et al. 2005), Jpred (Cole et al. 2008), PREDATOR (Frishman and Argos 1996), YASSPP (Karypis 2006) and PSIPRED (Bryson et al. 2005). The summary was generated based on the results of these programs: H (helix) indicates at least five of the programs predicted a helix at a given position, and h indicates four of the programs predicted a helix. In the hPEPT1 sequence, letters in blue and red indicate positively and negatively charged residues, respectively, that were mutated in this study, and *indicates that the mutation had a significant influence on hPEPT1 activity. #In the NetSurfP prediction, H indicates an α-helix probability >0.6 (Color figure online)
Discussion
hPEPT1 has broad substrate specificity, as demonstrated by its transport of many di- and tripeptides. Interestingly, hPEPT1 shows a varying degree of affinity for di- and tripeptides, which results in differences in substrate transport (Vig et al. 2006). The transporter also has a high throughput requirement since hPEPT1 is mainly functional after intake of food. Assuming the basic principle of a two-state model with pre- and posttransport conformations (Bolger et al. 1998), high throughput might be achieved by a specific mechanism to induce a return to the pretransport state after substrate translocation. We have proposed that reformation of a salt bridge between R282 and D341 after transport might be part of this mechanism (Kulkarni et al. 2007). The current study indicates that positive and negative residues in loop 6–7 also play an important role in substrate uptake.
The structure of hPEPT1 loop 6–7 is unknown, and there are no structures of proteins with strong sequence homology to hPEPT1. The functional similarity between LacY and hPEPT1 (they are both 12-transmembrane proton symporters that translocate small hydrophilic molecules) has been used as a basis for homology modeling (Meredith and Price 2006). Our secondary structure predictions indicated two helices in loop 6–7 in both proteins. In hPEPT1, the charged residues in the predicted helix in the N-terminal half of the loop are all positive, whereas all the negatively charged residues in the loop fall in the predicted C-terminal helix. These findings suggest a relationship among the charged residues, the putative helical structure and the function of loop 6–7 in substrate uptake.
The two putative helices in loop 6–7 of hPEPT1 are amphipathic, and in the closed (pretransport) conformation these helices may interact through hydrophobic contacts, with outward orientations of the charged residues. Upon substrate transport, the hydrophobic contacts may be broken and the loop could undergo a conformational change. Studies on LacY provide some support for this model. Both biophysical and biochemical studies on LacY suggest that the conformational change needed for completion of transport is accomplished via a rocker-switch movement (Guan et al. 2007; Zhou et al. 2008). The LacY structure was determined in the posttransport state and has loop 6–7 in an extended conformation but with helices in the C- and N-terminal halves of the loop. The positive and negative charges within the similar predicted helices in the respective halves of hPEPT1 loop 6–7 may provide long-range electrostatic interactions that contribute to the reestablishment of a pretransport conformation after substrate translocation.
Our kinetic data are consistent with reduced turnover of hPEPT1 following mutation of E267 in helix 2 of loop 6–7 to a neutral or positively charged amino acid. The Km values for the wild-type and mutated transporters were all in the high micromolar range, showing that mutation of E267 did not affect substrate binding affinity. In contrast, Vmax values for E267A- and E267K-hPEPT1 were much lower than for the wild-type protein, suggesting that the total charge on the helix is important for high-throughput transport. The reduced Gly-Sar uptake following alanine substitutions of other charged residues in the N-terminal (K238, K245, R247) and C-terminal (D263, D270, E271) halves of the loop is consistent with this conclusion. The change in charge may make it more difficult for the protein to return to the pretransport state, thereby reducing substrate throughput. There are other possible interpretations of these data. These include elimination of a direct interaction of a mutated residue with the substrate, which we think unlikely given the intracellular location of the loop. It is also possible that the predicted amphipathic helices could engage in lipid interactions or in interactions with other loops, and we cannot exclude these possibilities.
Intracellular loops containing secondary structure and loops that influence substrate transport have been found in other proteins. Mutagenesis and cysteine modification identified a putative α-helix in an intracellular loop of the serotonin transporter (Zhang and Rudnick 2005), and mutations of an intracellular loop in the dopamine transporter significantly influence the kinetics of substrate uptake, with changes of Km and Vmax relative to the wild-type protein (Chen et al. 2000). Our results for hPEPT1 provide a further example of the importance of intracellular loops in protein transporters and add another element to the emerging picture of the hPEPT1 translocation mechanism.
Acknowledgments
We thank Daya Perkins and Dimple Modi for scientific input. We thank Miriam Fine and Aisi Wu for technical assistance. This work was supported in part by research grant NIAAA/NIH AA013922 (to D. L. D.) and the USC School of Pharmacy. This work was conducted as partial fulfillment of the requirements for the PhD degree in neuroscience, University of Southern California (L. X.).
Abbreviations
- hPEPT1
Human dipeptide transporter
- TMD
Transmembrane domain
- Gly-Sar
Glycylsarcosine
- WT
Wild type
Contributor Information
Liya Xu, Alcohol and Brain Research Laboratory, Titus Family Department of Clinical Pharmacy and Pharmaceutical Economics and Policy, School of Pharmacy, University of Southern California, 1985 Zonal Avenue PSC 500, Los Angeles, CA 90033, USA; Neuroscience Graduate Program, University of Southern California, Los Angeles, CA, USA.
Yiyu Li, Department of Pharmacology and Pharmaceutical Sciences, School of Pharmacy, University of Southern California, Los Angeles, CA, USA.
Ian S. Haworth, Department of Pharmacology and Pharmaceutical Sciences, School of Pharmacy, University of Southern California, Los Angeles, CA, USA
Daryl L. Davies, Email: ddavies@usc.edu, Alcohol and Brain Research Laboratory, Titus Family Department of Clinical Pharmacy and Pharmaceutical Economics and Policy, School of Pharmacy, University of Southern California, 1985 Zonal Avenue PSC 500, Los Angeles, CA 90033, USA.
References
- Abramson J, Smirnova I, Kasho V, Verner G, Kaback HR, Iwata S. Structure and mechanism of the lactose permease of Escherichia coli. Science. 2003;301:610–615. doi: 10.1126/science.1088196. [DOI] [PubMed] [Google Scholar]
- Bolger MB, Haworth IS, Yeung AK, Ann D, von Grafenstein H, Hamm-Alvarez S, Okamoto CT, Kim KJ, Basu SK, Wu S, Lee VH. Structure, function, and molecular modeling approaches to the study of the intestinal dipeptide transporter PepT1. J Pharm Sci. 1998;87:1286–1291. doi: 10.1021/js980090u. [DOI] [PubMed] [Google Scholar]
- Brandsch M, Knütter I, Bosse-Doenecke E. Pharmaceutical and pharmacological importance of peptide transporters. J Pharm Pharmacol. 2008;60:543–585. doi: 10.1211/jpp.60.5.0002. [DOI] [PubMed] [Google Scholar]
- Bryson K, McGuffin LJ, Marsden RL, Ward JJ, Sodhi JS, Jones DT. Protein structure prediction servers at University College London. Nucleic Acids Res. 2005;33:W36–W38. doi: 10.1093/nar/gki410. [DOI] [PMC free article] [PubMed] [Google Scholar]
- Chen N, Ferrer JV, Javitch JA, Justice JB., Jr Transport-dependent accessibility of a cytoplasmic loop cysteine in the human dopamine transporter. J Biol Chem. 2000;275:1608–1614. doi: 10.1074/jbc.275.3.1608. [DOI] [PubMed] [Google Scholar]
- Cole C, Barber JD, Barton GJ. The Jpred 3 secondary structure prediction server. Nucleic Acids Res. 2008;36(Web Server issue):W197–W201. doi: 10.1093/nar/gkn238. [DOI] [PMC free article] [PubMed] [Google Scholar]
- Covitz KM, Amidon GL, Sadée W. Membrane topology of the human dipeptide transporter, hPEPT1, determined by epitope insertions. Biochemistry. 1998;37:15214–15221. doi: 10.1021/bi981128k. [DOI] [PubMed] [Google Scholar]
- Daniel H. Molecular and integrative physiology of intestinal peptide transport. Annu Rev Physiol. 2004;66:361–384. doi: 10.1146/annurev.physiol.66.032102.144149. [DOI] [PubMed] [Google Scholar]
- Frishman D, Argos P. Incorporation of non-local interactions in protein secondary structure prediction from the amino acid sequence. Protein Eng. 1996;9:133–142. doi: 10.1093/protein/9.2.133. [DOI] [PubMed] [Google Scholar]
- Guan L, Mirza O, Verner G, Iwata S, Kaback HR. Structural determination of wild-type lactose permease. Proc Natl Acad Sci USA. 2007;104:15294–15298. doi: 10.1073/pnas.0707688104. [DOI] [PMC free article] [PubMed] [Google Scholar]
- Karypis G. YASSPP: better kernels and coding schemes lead to improvements in protein secondary structure prediction. Proteins. 2006;64:575–586. doi: 10.1002/prot.21036. [DOI] [PubMed] [Google Scholar]
- Kulkarni AA, Haworth IS, Lee VH. Transmembrane segment 5 of the dipeptide transporter hPEPT1 forms a part of the substrate translocation pathway. Biochem Biophys Res Commun. 2003a;306:177–185. doi: 10.1016/s0006-291x(03)00926-4. [DOI] [PubMed] [Google Scholar]
- Kulkarni AA, Haworth IS, Uchiyama T, Lee VH. Analysis of transmembrane segment 7 of the dipeptide transporter hPEPT1 by cysteine-scanning mutagenesis. J Biol Chem. 2003b;278:51833–51840. doi: 10.1074/jbc.M308356200. [DOI] [PubMed] [Google Scholar]
- Kulkarni AA, Davies DL, Links JS, Patel LN, Lee VH, Haworth IS. A charge pair interaction between Arg282 in transmembrane segment 7 and Asp341 in transmembrane segment 8 of hPEPT1. Pharm Res. 2007;24:66–72. doi: 10.1007/s11095-006-9119-x. [DOI] [PubMed] [Google Scholar]
- Liang R, Fei YJ, Prasad PD, Ramamoorthy S, Han H, Yang-Feng TL, Hediger MA, Ganapathy V, Leibach FH. Human intestinal H+/peptide cotransporter. Cloning, functional expression, and chromosomal localization. J Biol Chem. 1995;270:6456–6463. doi: 10.1074/jbc.270.12.6456. [DOI] [PubMed] [Google Scholar]
- Links JL, Kulkarni AA, Davies DL, Lee VH, Haworth IS. Cysteine scanning of transmembrane domain three of the human dipeptide transporter: implications for substrate transport. J Drug Target. 2007;15:218–225. doi: 10.1080/10611860701267491. [DOI] [PubMed] [Google Scholar]
- Meredith D. Site-directed mutation of arginine 282 to glutamate uncouples the movement of peptides and protons by the rabbit proton-peptide cotransporter PepT1. J Biol Chem. 2004;279:15795–15798. doi: 10.1074/jbc.M313922200. [DOI] [PubMed] [Google Scholar]
- Meredith D. The mammalian proton-coupled peptide cotransporter PepT1: sitting on the transporter-channel fence? Philos Trans R Soc Lond B. 2009;364:203–207. doi: 10.1098/rstb.2008.0139. [DOI] [PMC free article] [PubMed] [Google Scholar]
- Meredith D, Price RA. Molecular modeling of PepT1—towards a structure. J Membr Biol. 2006;213:79–88. doi: 10.1007/s00232-006-0876-6. [DOI] [PubMed] [Google Scholar]
- Petersen B, Petersen TN, Andersen P, Nielsen M, Lundegaard C. A generic method for assignment of reliability scores applied to solvent accessibility predictions. BMC Struct Biol. 2009;9:51. doi: 10.1186/1472-6807-9-51. [DOI] [PMC free article] [PubMed] [Google Scholar]
- Rubio-Aliaga I, Daniel H. Peptide transporters and their roles in physiological processes and drug disposition. Xenobiotica. 2008;38:1022–1042. doi: 10.1080/00498250701875254. [DOI] [PubMed] [Google Scholar]
- Saier MH, Jr, Tran CV, Barabote RD. TCDB: the transporter classification database for membrane transport protein analysis and information. Nucleic Acids Res. 2006;34:D181–D186. doi: 10.1093/nar/gkj001. [DOI] [PMC free article] [PubMed] [Google Scholar]
- Sen TZ, Jernigan RL, Garnier J, Kloczkowski A. GOR V server for protein secondary structure prediction. Bioinformatics. 2005;21:2787–2788. doi: 10.1093/bioinformatics/bti408. [DOI] [PMC free article] [PubMed] [Google Scholar]
- Vig BS, Stouch TR, Timoszyk JK, Quan Y, Wall DA, Smith RL, Faria TN. Human PEPT1 pharmacophore distinguishes between dipeptide transport and binding. J Med Chem. 2006;49:3636–3644. doi: 10.1021/jm0511029. [DOI] [PubMed] [Google Scholar]
- Xu L, Haworth IS, Kulkarni AA, Bolger MB, Davies DL. Mutagenesis and cysteine scanning of transmembrane domain 10 of the human dipeptide transporter. Pharm Res. 2009;26:2358–2366. doi: 10.1007/s11095-009-9952-9. [DOI] [PMC free article] [PubMed] [Google Scholar]
- Zhang YW, Rudnick G. Cysteine-scanning mutagenesis of serotonin transporter intracellular loop 2 suggests an alpha-helical conformation. J Biol Chem. 2005;280:30807–30813. doi: 10.1074/jbc.M504087200. [DOI] [PubMed] [Google Scholar]
- Zhou Y, Guan L, Freites JA, Kaback HR. Opening and closing of the periplasmic gate in lactose permease. Proc Natl Acad Sci USA. 2008;105:3774–3778. doi: 10.1073/pnas.0800825105. [DOI] [PMC free article] [PubMed] [Google Scholar]


