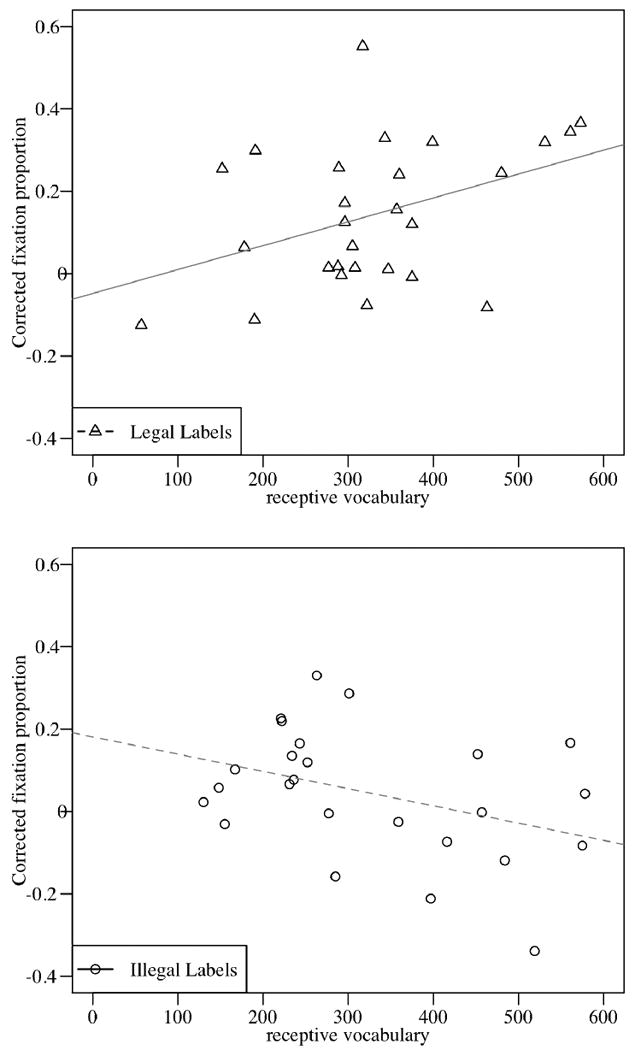
Figure 3.

Scatter plots of infants' corrected fixation proportion by receptive vocabulary size (number of words understood on MCDI) for legal (top plot) and illegal labels (bottom plot). Solid regression line shows significant correlation, while dashed regression line shows a trend towards significance.
