

Abstract
Diabetes is rapidly escalating amongst low-income, older adults at great cost to the Medicare program. We use longitudinal survey data from the Health and Retirement Study linked to administrative Medicare records and biomarker data to assess the relationship between Food Stamp receipt and diabetes health outcomes. We find no significant difference in Medicare spending, outpatient utilization, diabetes hospitalizations and blood sugar (HbA1c) levels between recipients and income-eligible non-recipients after controlling for a detailed set of covariates including individual fixed effects and measures of diabetes treatment compliance. As one-third of elderly Food Stamp recipients are currently diabetic, greater coordination between the Food Stamp, Medicare, and Medicaid programs may improve health outcomes for this group.
Keywords: Diabetes, Food Stamps, Biomarker data, Elderly, Medicare spending
1. Introduction
The cost of diabetes and other chronic conditions amongst older Americans are major drivers of the Medicare financing crisis (Huang et al., 2009; Thorpe and Howard, 2006). Incidence of diabetes is rapidly escalating in the United States despite a Healthy People 2010 goal to decrease its disease and economic burden. Nearly one-quarter of the U.S. elderly population currently has been diagnosed with diabetes, facing increased risk of premature death, disability, heart disease, kidney failure, and other complications (Sloan et al., 2009). The illness burden not only reduces patient quality of life but also strains public and private payers. In 2005, diabetes cost Medicare, the Federal health insurance program for the elderly, an estimated $71 billion, with the program spending 75% more on elderly diabetics than non-diabetics (Gold et al., 2007).
In light of the staggering costs of diabetes, obesity and other metabolic conditions to public insurance programs, policymakers are looking to innovative strategies emphasizing individual behavioral modification. A key aspect of diabetes management is dietary intervention. The American Diabetes Association recommends a diet emphasizing fruit, vegetables, whole grains and low-fat dairy to stabilize blood sugar (glucose), improve blood pressure and cholesterol levels and reduce weight (ADA, 2008). Despite a well-documented role of diet in diabetes management and evidence of a socioeconomic gradient in diabetes, little is known about the relationship between participation in the United States Department of Agriculture’s Food Stamp program (FSP) and diabetes management.1 With more than 40 million Americans currently receiving Food Stamps, greater understanding of the the program’s health effects are increasingly important (USDA, 2010). Policymakers are beginning to consider the contributions of poor dietary choices to public and private health care spending. At President Obama’s recent White House Health Summit, Senator Tom Coburn argued that the Food Stamp program creates diabetes by providing incentives for participants to eat the wrong foods (Coburn, 2010).
Although the initial goals of the Food Stamp program included improved access to a nutritionally adequate diet, the operational focus has emphasized expanding household food budgets rather than explicitly altering consumption of purchased food or addressing the health consequences of dietary choices (Currie, 2003). Relatively little is known about the health consequences of Food Stamp receipt. Participation in the FSP may impact health outcomes for diabetics by directly altering the type or amount of food consumption, for example if benefits are used to purchase a higher quality diet than would otherwise be available. Food Stamps may positively affect health through an income effect, or adversely affect health by imposing a monthly food purchasing cycle leading to periods of binging and deprivation.
Thus, Food Stamp receipt may improve or harm health with ambiguous implications for total Medicare spending and utilization for elderly diabetics. This paper tests the relationship between Food Stamp benefit receipt and Medicare spending and utilization to understand the potential for expansion of the Food Stamp program to reduce Medicare spending growth. We use survey data from the Health and Retirement Study (HRS), a nationally representative, longitudinal survey of older Americans, matched with administrative Medicare spending and utilization data and clinical biomarker samples. Clinical and administrative data provide information about specific types of health care utilization and clinical outcomes that are difficult to capture in survey data. Medicare claims data include clinical compliance with diabetes treatment guidelines, providing information about positive or negative selection into program participation.
We first use HRS data to document the high and rapidly growing prevalence of diabetes amongst elderly Americans. This trend that is particularly salient for elderly Food Stamp recipients, 32% of whom were diabetic in 2006. We show that this disease burden is of particular policy relevance because Medicare spending is particularly high for diabetics and for lower income seniors.
In unadjusted data, Food Stamp recipients have higher Medicare spending and utilization and worse blood sugar control than eligible non-participants. Rates of Food Stamp take-up are particularly low amongst eligible elderly adults, raising concerns that participants differ from non-participants in typically unobservable ways that may affect program take-up and health. In fixed effect regressions controlling for diabetes compliance, we find no significant difference in Medicare spending, outpatient utilization and blood sugar control for recipients and non-recipients. Food Stamp recipients are 7 percentage points more likely to experience an inpatient hospitalization, though there is no difference in likelihood of hospitalizations for diabetes. Food Stamp receipt is associated with lower rates of End-Stage Renal Disease (ESRD, permanent kidney failure) for non-Whites, who are disproportionately affected by ESRD. Results suggest that increasing diabetic enrollment in the Food Stamp Program is unlikely to generate savings for the Medicare program or significantly alter health of low-income diabetics.
In the next section, we describe the Food Stamp program and review the mechanisms through which Food Stamps could impact health outcomes for diabetics. Section 3 describes the survey, biomarker and administrative components of the Health and Retirement Study data. Section 4 describes the empirical approach. Results are presented in Section 5 and Section 6 concludes.
2. Background
2.1. The Food Stamp program
In 2009, the Supplemental Nutritional Assistance Program (the successor of the FSP) provided more than $50 billion dollars of in-kind assistance to help low-income households purchase food (USDA, 2010). Participants are expected to spend 30% of their income on food. Means tested benefits supplement this amount up to a minimum threshold for households with income up to 130% of the Federal poverty level and net income up to the poverty threshold. Households with at least one member aged 60 and older are considered elderly. Elderly households face the more liberal net income requirement, that gross income less a standard deduction and allowances for child support, earned income, excess housing and medical costs meet or fall below the poverty level (Ways and Means, 2008). Households are also eligible for benefits if they receive Supplementary Security Income (SSI) or Temporary Assistance to Needy Families (TANF). In 2006, elderly respondents in the Health and Retirement Study average monthly Food Stamp benefits of $71 for single-person household and $118 for couples, approximately 45% of the maximum benefit allotment.
With take-up rates of approximately 30%, participation in the Food Stamp program has historically been low amongst income-eligible seniors (Haider et al., 2003). Empirical work has examined barriers to take-up amongst this group, suggesting that non-participants may be less needy than participants and or reliant on assistance from other sources such as Meals-on-Wheels (Haider et al., 2003; Wu, 2009).
2.2. Food Stamps and diabetes health outcomes
Diabetes is a metabolic condition where the body cannot properly absorb glucose (blood sugar). Food is broken down to glucose to be used as a source of energy. Diabetics are unable to absorb glucose because of a deficit or resistance to insulin, the hormone that causes cells to process sugar. Most diabetics have Type 2 (adult-onset) diabetes, where the body produces sufficient insulin but is resistant to its effects. Complications of diabetes include amputation, blindness, heart disease, and kidney failure, medical conditions which are both expensive to treat and impose adverse implications for patient longevity and quality of life (National Diabetes Information and Clearinghouse, 2008).
Diabetes prevalence is rapidly increasing amongst older adults, reflecting both incidence of new diagnoses and aging of younger diabetics. The growing cost burden of diabetes alone is responsible for 5.5% of the increase in Medicare spending between 1987 and 2004 (Thorpe and Howard, 2006). Descriptive analysis of HRS survey data demonstrates that diabetes prevalence is especially pronounced amongst older adults receiving Food Stamps. Fig. 1 shows trends in self-reported diabetes diagnosis amongst Health and Retirement Study respondents over 6 interview waves. By 2006, 32% of Food Stamp recipients (more than 800,000 older adults) self-report a previous diabetes diagnosis, compared to 27% of income-eligible non-participants and 19% of ineligible seniors (all differences statistically significant at 5%). Fig. 1 also illustrates the explosive recent increases in diabetes amongst older adults. By 2006, more than 10.5 million older adults report a diabetes diagnosis. During the past decade, prevalence increased by 23% amongst Food Stamp recipients and 58% amongst income-ineligible seniors.
Fig. 1.
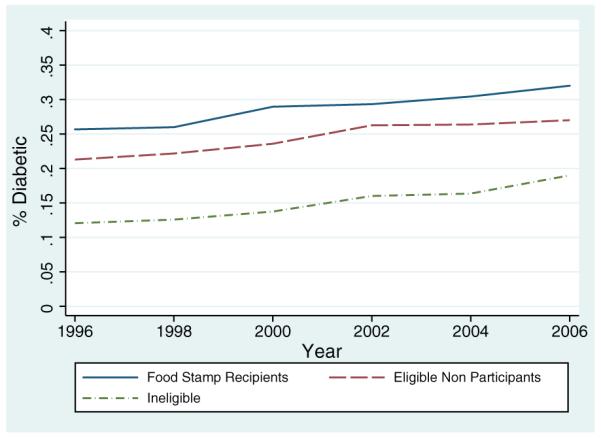
Diabetes prevalence by income group, older Americans 1996–2006.
The spread of diabetes is alarming to policymakers because of the health consequences and because Medicare costs are significantly higher for diabetics than non-diabetics. More diabetes amongst older adults will further strain the Medicare trust fund. Fig. 2 shows that average Medicare spending is particularly high for low-income diabetics. Medicare spends nearly twice as much on diabetics in the lowest quintile of household income, with $13,000 or less in annual income, than it does on households in the highest quintile of annual income ($55,000 and up). Across the income distribution, Medicare spending on diabetics averages an additional $3914, 65% more than for non-diabetics. Program spending on diabetics in the lowest income quintile, including Food Stamp recipients, is particularly striking, at more than double expenditures on non-diabetics.2 In principle, improvements in the health of low-income diabetics or reductions in diabetes prevalence amongst this group could generate savings for Medicare.
Fig. 2.
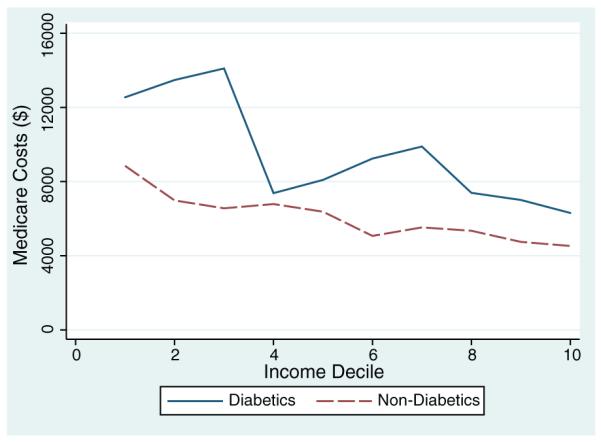
Medicare spending by income decile, non-decedents 2004.
Diabetics require a stable diet following medical nutrition guidelines to maintain health, suggesting that food stamp benefit receipt may play an important role in diabetes management for low-income diabetics. FSP benefits can directly affect diabetic health outcomes by alleviating food insecurity. In a sample of diabetics seeking care at an urban hospital, nearly one-third reported difficulties managing blood sugar because they could not afford enough food (Nelson et al., 1998). Benefit receipt may additionally impact health through several indirect mechanisms.
Food Stamps essentially provide an income transfer for households with pre-transfer food spending greater than or equal to their benefit amount. This characterizes the majority of households in the sample; 77% of HRS Food Stamp households report additional cash spending on food. Assuming that both food and other health spending are normal goods for this population, the net expected response is for recipient households to increase consumption of both goods. Empirical research has demonstrated this response amongst other recipient groups.
Hoynes and Schanzenbach (2009) find that roll-out of the Food Stamp program caused an increase in household food spending. Many earlier studies find that Food Stamp receipt is associated with increased food spending. The marginal propensity to spend on food is estimated to range between 0.2 and 0.7, indicating that recipient households increase food spending by less than the total amount of the transfer (Johnson et al., 1981; Levedahl, 1991, 1995). Similar to papers in the Food Stamps and obesity literature, this paper analyzes the total effect of Food Stamp receipt on health, including health effects caused by changes in food consumption and those caused by changes in consumption of other goods (Chen et al., 2005; Kaushal, 2007).
Increasing the amount of food purchased does not necessarily improve quality of food consumed. Wilde et al. (1998) find that food stamp recipients increase consumption of meats, sugars and fats, though consumption of healthier foods is unchanged by Food Stamp receipt. Currie (2003) summarizes a series of studies analyzing examining nutrient and caloric intake based on dietary recall data collected in the 1970s and 1980s. These studies find mixed evidence of an impact on nutrition. Several studies conclude that Food Stamp receipt increases intake of calories as well as nutrients including calcium and iron. While this suggests a beneficial health effect, as Currie (2003) points out this will not be the case if the participant is already receiving adequate vitamins and calories.
Diabetics may be more likely than other Food Stamp recipients to use additional income to improve dietary quality because of their medical diagnosis tying food consumption to well-being. In descriptive work, Weimer (1998) found that amongst older adults, receipt of a doctor’s diagnosis of diabetes, heart disease or cancer; medical diagnoses that trigger medical advice for dietary modification, was associated with lower fat and caloric intake. Inability to afford food has been linked to increased risk of hypoglycemic attacks where insufficient blood sugar causes physical symptoms and physician visits (Nelson et al., 1998, 2001).
Food Stamp benefits are provided once a month. Recipients may have difficulty smoothing consumption across the month, purchasing larger amounts of food early in the month and running out of food prior to receiving the next month’s benefit. Blood sugar control can be difficult to achieve for diabetics without access to a stable diet. Stephens (2003) found that households reliant on Social Security for the majority of their income increase spending on fresh food in the days immediately following receipt of their benefit check relative to spending at the end of the month. Shapiro (2005) demonstrates a similar pattern amongst Food Stamp recipients, who reduce caloric intake over the course of the month and then increase again when new benefits are received. Erratic food consumption and availability can be particularly problematic for diabetics because it can increase the risk of obesity and impede adherence to a diabetic meal plan. Periods of food deprivation such as the end of the benefit cycle can impede blood sugar control if households are unable to purchase appropriate foods for medical nutrition therapy. Physiologic response to periods of hunger and food deprivation can include increased body fat accumulation as protection against future caloric deficits (Dietz, 1995).
Thus, the theoretical predictions about the effects of food stamp receipt on diabetic health outcomes and associated Medicare spending are ambiguous. Empirical work in this area has predominantly focused on obesity and child health outcomes. Particularly little is known about the health consequences of benefit receipt for adults or the cost implications of benefit receipt to other public programs. Several papers have considered the relationship between Food Stamp receipt and obesity, which is closely associated with increased risk of chronic conditions and higher health care spending (Finkelstein et al., 2009). Most find no relationship for men, while some studies have found that Food Stamp receipt leads to weight gain and obesity for women (see Ver Ploeg and Ralston, 2008; Zagorsky and Smith, 2009 for reviews). Ver Ploeg and colleagues demonstrate that rates of obesity amongst income-eligible non-participants are catching up with those of Food Stamp recipients, raising questions about whether differences observed in early studies generalize to current demographics. Almond et al. (2008) find that Food Stamps caused improvements in infant birthweight amongst children with mothers exposed to the program at roll-out (1960s to early 1970s), though Currie and Cole (1993) found no effect of food stamp receipt on birthweight for children born to recipient mothers in the 1980s.
3. Data
We analyze data from the Health and Retirement Study (HRS), a nationally representative, longitudinal survey of older Americans designed to capture demographic, physical and cognitive functioning, work, and family structure variables related to health and retirement (Juster and Suzman, 1995). The HRS reinterviews respondents and participating spouses biennially. 30,887 older Americans have been interviewed at least once between 1992 and 2006. In each wave, households report Food Stamp participation by month, income, assets and participation in means-tested programs. Respondent-level data detail health measures including diabetes and other chronic conditions, as well as sociodemographic variables including age, race, education level, household composition and employment history. Respondents also report two health behaviors, whether they smoke (counterindicated for diabetics) or they engage in physical exercise (recommended for diabetics). These measures help to determine whether healthier (positive selection) or less healthy diabetics selectively participate in the Food Stamp program.
The quality of self-reported food stamp receipt by older adults in the HRS is high relative to other datasets. Though underreporting of food stamps receipt is common in survey data, Haider et al. (2003) find that participation rates reported by HRS respondents more closely match administrative records than self-reports in the Current Population Survey or the Survey of Income and Program Participation. Respondents in households reporting Food Stamp receipt since the previous interview are considered Food Stamp recipients. The majority of households receiving Food Stamps at any time during the wave receive them consistently. In multivariate analysis, we compare Food Stamp recipients to respondents in households which appear Food Stamp eligible but do not participate. These households have income at or below 130% of the Federal poverty level and assets of $3000 or less, or qualify based on participation in TANF or SSI.
3.1. Medicare claims data
HRS survey data is linked to Medicare administrative claims data, for respondents who have previously consented to its release. Beginning in 1993, respondents who were at least 65 years old were asked to provide their Medicare number to facilitate the linkage for research purposes. Consenting respondents provide access to current, prior and future Medicare claims data, creating longitudinal measures of health care utilization and spending. The majority of Medicare-eligible HRS respondents have consented to the administrative linkage. Records have been successfully matched for 86% of respondents. We use Medicare claims data from 1995 to 2005 for this study. Annual Medicare data from the year a respondent completed an HRS interview are merged with survey responses. This creates a matched file with 15,452 respondents over 50,992 person-waves. On average, we observe 3.3 wave-years of Medicare claims data for matched respondents. We exclude 9608 observations from Medicare managed care enrollees because plan reports of members utilization are incomplete and unreliable during the study period (Asper, 2009). 26% of eligible respondents with linked data receive Food Stamp benefits between 1995 and 2005, similar to overall participation rates reported in the survey data.
The claims data include several health outcomes of interest. We examine total annual Medicare spending for each respondent, as well as counts of outpatient visits, and indicators for whether a beneficiary is hospitalized during the year for any reason, hospitalized for diabetes,3 or has end-stage renal disease (ESRD). ESRD, or permanent kidney failure, is a serious diabetes complication requiring regular dialysis or a kidney transplant, typically at significant cost to the Medicare program.
Claims data are also used to code several measures of respondent compliance with diabetes treatment guidelines recommended for disease management. These provide additional insight about potential non-random Food Stamp participation by diabetics with better (worse) health behaviors. Treatment guidelines for diabetes care include clinically testing glycosylated hemoglobin (HbA1c) levels, a measure of average blood sugar concentration at least twice annually; cholesterol screenings at least once annually; and annual eye exams to screen for diabetic retinopathy, a leading cause of blindness (ADA, 2007). Current Procedural Terminology (CPT) codes reported in the Medicare outpatient and carrier files are used to determine whether respondents had each of three recommended screenings during the two year period covering interview year and the previous year (Hebert et al., 1999; Keating et al., 2003). While these screenings should be performed at least once annually, we conservatively use a two-year look-back period to avoid undercounting in administrative data.
3.2. Biomarker data
Two recent waves of the HRS collected biomarker data including blood samples from some respondents (HRS, 2007a,b). Biomarker data yield clinical evidence about the quality of the respondent’s recent diabetes management reflected in glycosylated hemoglobin (HbA1c) levels. HbA1c is a measure of average blood glucose concentration over the past two to three months. Since January 2010, HbA1c levels of 6.5 or higher are used to diagnose diabetes (ADA, 2010). A level of 6% or less is considered normal (non-diabetic) (Mitka, 2009). The American Diabetes Association (ADA, 2007) recommends HbA1c levels below 7% as a treatment goal for adult diabetics. Use of this clinical outcome provides a measure of diabetes control that is difficult to capture through self-reported recall data.
We use biomarker data from two collections focused on different subsamples of HRS respondents. The first biomarker collection was part of the 2003 Mail Survey on Diabetes (MSD), a mail survey sent to a subsample of HRS respondents who self-identified as diabetic in the 2002 wave. The MSD was designed to obtain additional information about treatment and self-management of diabetes and to collect a clinical biomarker of glucose control (HRS, 2007a). Survey respondents were asked to mail back dried blood spots. The MSD provides detailed survey information but yields a small sample of blood spots; 1901 respondents returned surveys, with 64% of that group also returning a valid blood spot (HRS, 2007a). Food Stamp recipients participating in the MSD were less likely to also return valid blood spots, with valid samples collected from only one-third of this group. Overall, low-income and less-educated diabetics were less likely to return bloodspots (Heisler et al., 2007). This may bias results if compliant diabetics systematically differ from those who do not return bloodspots.
In 2006, half of HRS households were randomly selected to receive an enhanced face to face interview including biomarker collection (HRS, 2007b). The in-person blood draw had a consent rate of 83%, and valid blood spots were analyzed for 6507 HRS respondents (77.5% of the target sample). Race, education, and ethnicity were unrelated to the probability of completing the physical specimen collection in 2006 (Sakshaug et al., 2010). The two collections combined yield 2482 valid bloodspots from older diabetics. 588 of these are from Food Stamp recipients or income-eligible non-participants.
Food Stamp recipients and eligible non-participants are generally worse off physically and financially than higher income HRS respondents. Table 1 presents summary statistics comparing Food Stamp recipients to income eligible and ineligible non-participants. Consistent with the greater illness burden, Food Stamp recipients and eligible non-participants both average nearly 60% more annual Medicare spending than higher income respondents. Utilization differences between recipients and eligible non-participants are small in the unadjusted data. Food Stamp recipients are more likely than non-participants to receive recommended medical care, suggesting positive selection into participation, but also more likely to smoke (negative selection into Food Stamps). Food Stamp recipients are also much more likely to receive Medicaid (78% vs. 37%). This may provide another measure of FSP participants’ greater willingness to participate in public programs. Medicaid provides additional cost sharing and coverage for services like prescription drugs that were not available in Fee-for-Service Medicare during the study period and has ambiguous implications for overall utilization. Medicaid receipt may increase utilization by reducing the cost of health care, or decrease utilization by improving health with prescription drug coverage or other benefits.
Table 1.
Characteristics of diabetic Food Stamp recipients and non-recipients, 1995–2005.
| Food Stamps | Eligible non-takers | Ineligibles | |
|---|---|---|---|
| Total Medicare spending $ | 11,877 (20,651) | 11,694 (20,238) | 7375 (15,789) |
| # Inpatient hospitalizations | 0.17 (0.38) | 0.17 (0.38) | 0.11 (0.31) |
| # Diabetes hospitalizations | 0.03 (0.18) | 0.04 (0.20) | 0.02 (0.13) |
| # Physician visits | 16.0 (12.8) | 13.8 (12.3) | 12.4 (11.4) |
| Whether ESRD | 0.03 (0.17) | 0.03 (0.16) | 0.01 (0.12) |
| Currently exercises | 0.36 (0.48) | 0.35 (0.48) | 0.46 (0.50) |
| Current smoker | 0.17 (0.38) | 0.11 (0.31) | 0.07 (0.26) |
| HbA1c screen | 0.62 (0.48) | 0.57 (0.49) | 0.62 (0.49) |
| Cholesterol screen | 0.49 (0.50) | 0.41 (0.49) | 0.50 (0.50) |
| Retinopathy | 0.43 (0.50) | 0.39 (0.49) | 0.45 (0.50) |
| Food insecurity | 0.33 (0.47) | 0.15 (0.36) | 0.03 (0.18) |
| Separated/divorced | 0.21 (0.41) | 0.13 (0.34) | 0.05 (0.21) |
| Widowed | 0.45 (0.50) | 0.46 (0.50) | 0.23 (0.42) |
| Medicaid | 0.78 (0.41) | 0.37 (0.48) | 0.05 (0.21) |
| Hypertension | 0.83 (0.37) | 0.81 (0.39) | 0.72 (0.45) |
| Arthritis | 0.83 (0.37) | 0.75 (0.43) | 0.67 (0.47) |
| Heart disease | 0.51 (0.50) | 0.45 (0.50) | 0.43 (0.49) |
| Stroke | 0.17 (0.38) | 0.22 (0.41) | 0.13 (0.33) |
| Psychiatric problems | 0.34 (0.48) | 0.27 (0.44) | 0.16 (0.37) |
| BMI | 30.9 (7.3) | 29.1 (6.7) | 28.4 (5.4) |
| # ADL limitations | 1.36 (1.58) | 1.25 (1.68) | 0.53 (1.12) |
| # IADL limitations | 0.47 (0.85) | 0.52 (0.92) | 0.21 (0.61) |
| Observations | 754 | 1911 | 4840 |
| Black | 0.39 (0.49) | 0.35 (0.48) | 0.11 (0.32) |
| Hispanic | 0.23 (0.34) | 0.23 (0.33) | 0.28 (0.38) |
| Female | 0.77 (0.42) | 0.68 (0.47) | 0.45 (0.50) |
| <High school education | 0.73 (0.44) | 0.67 (0.47) | 0.31 (0.46) |
Standard deviations in parentheses.
Medicare spending and utilization variables are annual totals for the year of interview. Screening variables (HbA1c, cholesterol, retinopathy indicate any screening in past 2 years.
4. Empirical approach
4.1. Food Stamp receipt and Medicare spending and utilization
We first consider the relationship between Food Stamp receipt and health care cost and use. We estimate fixed effects regressions of each of the Medicare spending and utilization outcomes Yit following
| (1) |
where FSit is an indicator of Food Stamp receipt, Zit is a vector of time-varying individual characteristics representing diabetes compliance (exercise, smoking, HbA1c, cholesterol, and retinopathy screenings) to control for positive (negative) selection into Food Stamps, Xit is a vector of time variant individual characteristics which may also influence health outcomes including comorbid conditions (self-reported heart disease, stroke, cancer, arthritis, mental health, counts of the numbers of activities of daily living and instrumental activities of daily living limitations, body mass index, whether working for pay, Medicaid coverage, retiree health insurance, whether widowed, divorced or single (with married as the reference category), household size and whether the household experienced food insufficiency (did not have enough to eat) at any time during the past wave), YOBi × Tt is a birth year specific linear time trend to control for age and time effects, and μi is a vector of individual effects.
Eq. (1) is estimated separately for each of the Yit, the natural log of annual Medicare spending, count of outpatient visits, and indicators for any hospitalization within the year, any diabetes-specific hospitalization (characterized by primary diagnostic codes on the discharge abstract) and whether the respondent has end-stage renal disease. All specifications are estimated using ordinary least squares regression.4 Since the Food Stamp effect may vary by the amount of benefits received, we reestimate Eq. (1) replacing FSit with the dollar amount of monthly Food Stamp benefits.
All models compare Food Stamp recipients to eligible non-participants. In the fixed effects models, the Food Stamp effect is identified by movement in and out of the Food Stamp program. One way that households move in and out of Food Stamps is through changes in eligibility status, particularly those driven by changes in household composition following events such as death of a spouse. In order to capture these movements, we use a measure of permanent eligibility. Respondents in households eligible for Food Stamps in at least half of the waves in which they are interviewed are considered eligible. Formally, a respondent is included in the analysis if where et is an indicator equal to 1 if the respondent is income and asset eligible for Food Stamps at interview wave t. Table 2 demonstrates that a sizeable fraction of the sample changes Food Stamp status over time. Although Medicare spending is higher for switchers than other groups, there is not a consistent pattern in differences between switchers and either always-takers or never-takers.
Table 2.
Characteristics of Food Stamp receipt switchers.
| Switchers | Never FS | Always FS | |
|---|---|---|---|
| ln(Medicare spend) | 8.1 (2.3) | 7.6 (2.6) | 7.9 (2.2) |
| # Inpatient hospitalizations | 0.18 (0.39) | 0.17 (0.37) | 0.15 (0.35) |
| # Diabetes hospitalizations | 0.03 (0.17) | 0.04 (0.20) | 0.06 (0.23) |
| # Physician visits | 15.1 (11.4) | 13.4 (11.9) | 16.5 (13.1) |
| Whether ESRD | 0.05 (0.22) | 0.02 (0.13) | 0.02 (0.13) |
| Currently exercises | 0.34 (0.47) | 0.33 (0.47) | 0.33 (0.47) |
| Current smoker | 0.15 (0.35) | 0.10 (0.30) | 0.15 (0.36) |
| A1C test | 0.62 (0.49) | 0.55 (0.50) | 0.61 (0.49) |
| LDL screen | 0.46 (0.50) | 0.37 (0.48) | 0.53 (0.50) |
| Retinopathy | 0.43 (0.50) | 0.38 (0.49) | 0.43 (0.50) |
| Food insufficient | 0.27 (0.44) | 0.17 (0.38) | 0.36 (0.48) |
| Age | 71.5 (8.3) | 74.8 (9.5) | 71.3 (9.2) |
| Female | 0.74 (0.44) | 0.74 (0.44) | 0.82 (0.39) |
| Black | 0.41 (0.49) | 0.35 (0.48) | 0.40 (0.49) |
| Hispanic | 0.29 (0.45) | 0.24 (0.43) | 0.29 (0.45) |
| Observations | 627 | 927 | 327 |
Standard deviations in parentheses.
Medicare spending and utilization variables are annual totals for the year of interview.
Screening variables (HbA1c, cholesterol, retinopathy indicate any screening in past 2 years.
4.2. Food Stamp receipt and glycemic control
One mechanism through which Food Stamp receipt could impact diabetic health outcomes and health care spending is by improving (impeding) blood sugar control to avoid more serious complications. Since HbA1c provides a clinical measure of blood sugar control over the past two to three months, biomarker data allow us to consider the effect of Food Stamps on glycemic control for those receiving benefits within 60 days of their HbA1c sample collection. We pool the 588 bloodspots from Food Stamp eligible diabetics in the 2003 and 2006 biomarker collections as only 40 Food Stamp eligible respondents appear in both samples.
We focus on whether Food Stamp receipt is related to a diabetic’s odds of having an HbA1c level at or below 7%, consistent with ADA treatment guidelines, and an HbA1c level less than 9% using logistic regression. HbA1c levels above 9% are considered indicators of poor diabetes control and indicate patients at increased risk for costly diabetes complications (National Committee for Quality and Assurance, 2010). The dependent variables are binary indicator of whether the measured HbA1c level is below the specified threshold.
Individual level models include controls for control for previously discussed time-varying characteristics as well as dummy variables for age in five year categories, indicators for Black and other race as well as Hispanic ethnicity, sex, whether the respondent is a high-school graduate and year of biomarker collection. We also control for whether the respondent is using oral diabetes medications or injectable insulin, which facilitate blood sugar control,5 and the household income to poverty ratio.
5. Results
5.1. Food Stamps and Medicare spending
We fail to find a significant relationship between Food Stamp receipt and Medicare spending for older diabetics. Table 3 reports results from estimating Eq. (1) using both measures of Food Stamp receipt (any benefit and amount) with and without the measures of diabetes compliance as well as ordinary least squares regression coefficients. In subsequent tables, we report only estimates from models with individual fixed effects and compliance measures. This is our preferred specification as it does the most to address non-random program participation, though we note that there is no relationship between Food Stamp receipt and Medicare spending across all specifications. Specification tests reject use of the more efficient random effects estimator.
Table 3.
Food Stamp receipt and logged Medicare spending, 1995-2005.
| FS receipt | FS amount | |||||
|---|---|---|---|---|---|---|
| Food Stamp receipt (wave) | −0.02 (0.12) | 0.18 (0.16) | 0.20 (0.16) | |||
| Monthly benefit ($) | −0.001 (0.001) | 0.0006 (0.001) | 0.0003 (0.001) | |||
| Exercises | −0.29* (0.13) | −0.31* (0.13) | ||||
| Smokes | 0.10 (0.30) | 0.15 (0.29) | ||||
| A1c screening | 0.61** (0.14) | 0.63** (0.14) | ||||
| Cholesterol screening | 0.37** (0.13) | 0.34* (0.14) | ||||
| Retinopathy | 0.30* (0.13) | 0.28* (0.13) | ||||
| Fixed effects | No | Yes | Yes | No | Yes | Yes |
| Observations | 1825 | 1825 | 1818 | 1818 |
Standard errors are reported below coefficients.
The dependent variable is the natural log of annual Medicare spending.
Regression models control for time-varying health and demographic characteristics in Table 1.
p < 0.05.
p < 0.01.
The diabetes compliance variables are related to total Medicare spending. While regular exercise, not surprisingly, is associated with significantly lower spending, receipt of all three of the diabetic screenings are associated with higher Medicare spending. Patients may appear “compliant” when receiving screenings as part of a more serious health episode. Alternatively, compliance may reflect preferences for more health care consumption of all types.
5.2. Food Stamps and health care utilization
Table 4 reports the relationships between Food Stamp receipt onand health care utilization. Food Stamp recipients are 7 percentage points more likely to experience an inpatient hospitalization (α = 0.07, se = 0.03). There is no significant difference in rates of hospitalization for diabetes between recipients and non-recipients. The additional hospitalizations for Food Stamp recipients are primarily admissions for heart disease, which is exacerbated by diabetes. Heart disease is a more prevalent comorbidity amongst Food Stamp recipient diabetics (51%) than non-recipient (45%) or income-ineligible diabetics (43%).
Table 4.
Food Stamp receipt and health care utilization, 1995–2005.
| Inpatient hosp. | Diabetes hosp. | Physician visits | ESRD | |||||
|---|---|---|---|---|---|---|---|---|
| Food Stamp receipt (wave) | 0.07* (0.03) | 0.02 (0.02) | −0.63 (0.82) | −0.01 (0.01) | ||||
| Monthly benefit ($) | 0.0003 (0.0003) | −0.00007 (0.0001) | −0.0009 (0.006) | −0.0001 (0.0001) | ||||
| Exercises | 0.01 (0.03) | 0.01 (0.03) | 0.01 (0.01) | −0.004 (0.01) | −1.6* (0.64) | −2.0** (0.63) | −0.003 (0.008) | −0.01 (0.008) |
| Smokes | 0.02 (0.06) | 0.05 (0.06) | 0.05 (0.03) | 0.04 (0.03) | −0.59 (1.51) | −1.40 (1.48) | 0.02 (0.02) | 0.02 (0.02) |
| A1c screening | 0.01 (0.03) | 0.02 (0.03) | 0.01 (0.02) | 0.004 (0.01) | 3.1** (0.71) | 3.2** (0.71) | 0.01 (0.009) | 0.02 (0.009) |
| Cholesterol screening | −0.01 (0.03) | −0.02 (0.03) | 0.03 (0.02) | 0.01 (0.01) | 0.20 (0.69) | 0.29 (0.68) | −0.03** (0.009) | −0.02** (0.009) |
| Retinopathy | −0.04 (0.03) | −0.03 (0.03) | −0.02 (0.01) | −0.01 (0.01) | 1.08 (0.66) | 0.97 (0.65) | 0.01 (0.01) | 0.01 (0.01) |
| Observations | 1825 | 1818 | 1825 | 1818 | 1825 | 1818 | 1825 | 1818 |
Standard errors are reported below coefficients.
FE regression models control for the time-varying characteristics described in Table 1.
p < 0.05.
p < 0.01.
We find no significant difference in outpatient utilization or ESRD status amongst recipients and non-recipients. Table 4 also provides evidence that the increased spending on compliant diabetics may result from additional physician visits. Diabetics with regular HbA1c screenings average more than 3 additional annual visits, while exercisers average nearly 2 fewer visits. This is consistent with the spending results above; suggesting that receipt of screening services is directly responsible for the additional visits or diabetics that who abide by screening guidelines have higher preferences for service use.
5.3. Food Stamp heterogeneity
The relationship between Food Stamps and health outcomes may vary across subgroups of low-income diabetics. Different groups may have different responses to benefit receipt which are obscured in the primary analysis. It may be appropriate to target policy efforts to particular subgroups. To better understand where these efforts might focus, we regress the estimated fixed effects ui on time-invariant characteristics to identify three strong determinants of the individual effect; being non-White, female, and having less than a high school education. In Table 5, we present estimates from Eq. (1) by subgroup.
Table 5.
Food Stamp receipt and health outcomes by subgroup, 1995–2005.
| Medicare spend | Inpatient hosp. | Diabetes hosp. | Outpatient visits | ESRD | ||||||
|---|---|---|---|---|---|---|---|---|---|---|
| Non-White | ||||||||||
| Food Stamp receipt | 0.23 (0.19) | 0.08* (0.04) | 0.01 (0.02) | −0.61 (0.99) | −0.03* (0.01) | |||||
| Monthly benefit | 0.0005 (0.001) | 0.0002 (0.0003) | −0.0001 (0.0002) | 0.0002 (0.007) | −0.0001 (0.0001) | |||||
| Observations | 1583 | 1578 | 1583 | 1578 | 1583 | 1578 | 1583 | 1578 | 1583 | 1578 |
| White | ||||||||||
| Food Stamp receipt | 0.04 (0.31) | −0.004 (0.07) | 0.02 (0.03) | 0.02 (0.02) | ||||||
| Monthly benefit | 0.0006 (0.0037) | 0.0005 (0.0008) | 0.0031 (0.0192) | −0.0003 (0.0002) | ||||||
| Observations | 439 | 437 | 439 | 437 | 439 | 437 | 439 | 437 | 439 | 437 |
| Female | ||||||||||
| Food Stamp receipt | 0.11 (0.18) | 0.03 (0.04) | 0.01 (0.02) | −1.02 (0.96) | −0.02 (0.01) | |||||
| Monthly benefit | −0.0002 (0.001) | 0.0002 (0.0003) | −0.00003 (0.0001) | −0.0055 (0.007) | −0.0002 (0.0001) | |||||
| Observations | 1371 | 1366 | 1371 | 1366 | 1371 | 1366 | 1371 | 1366 | 1371 | 1366 |
| Male | ||||||||||
| Food Stamp receipt | 0.59 (0.40) | 0.21** (0.07) | 0.02 (0.04) | 1.37 (1.77) | −0.006 (0.012) | |||||
| Monthly benefit | 0.006 (0.004) | 0.002* (0.001) | 0.000 (0.000) | 0.017 (0.016) | 0.000 (0.000) | |||||
| Observations | 454 | 452 | 454 | 452 | 454 | 452 | 454 | 452 | 454 | 452 |
| <High school education | ||||||||||
| Food Stamp receipt | 0.22 (0.18) | 0.08* (0.04) | 0.02 (0.02) | −0.40 (0.90) | −0.001 (0.01) | |||||
| Monthly benefit | −0.0007 (0.001) | 0.0002 (0.0003) | 0.00003 (0.0001) | −0.006 (0.007) | −0.0001 (0.0001) | |||||
| Observations | 1386 | 1381 | 1386 | 1381 | 1386 | 1381 | 1386 | 1381 | 1386 | 1381 |
| High school education | ||||||||||
| Food Stamp receipt | 0.10 (0.38) | 0.12 (0.08) | −0.00862 (0.05) | 1.55 (2.19) | −0.03 (0.03) | |||||
| Monthly benefit | 0.005 (0.0027) | 0.001 (0.0006) | −0.0002 (0.0004) | 0.036* (0.02) | −0.0004 (0.0002) | |||||
| Observations | 439 | 437 | 439 | 437 | 439 | 437 | 439 | 437 | 439 | 437 |
Standard errors are reported below coefficients.
FE regression models control for the time-varying characteristics described in Table 1
p < 0.05.
p < 0.01.
Results are broadly consistent with those previously reported, and statistically insignificant for Medicare spending, diabetes hospitalizations and outpatient visits. Food Stamp receipt is associated with a 3 percentage point decrease in the probability of ESRD for non-Whites (p < 0.05). Minorities are considerably more likely to develop ESRD, so this is consistent with disease incidence. Food Stamps have no statistically significant effects for women. The increased probability of hospitalization for Food Stamp recipients appears to be driven by men, for whom Food Stamp receipt is associated with a 21 percentage point increase in probability of hospitalization; non-whites (α = 0.08, se = 0.04), and those with less than a high school education (α = 0.08, se = 0.04).
5.4. Food Stamp receipt and glycemic control
We test whether Food Stamps affect Medicare spending and utilization through the influence of diet on glycemic control using the biomarker data. Characteristics of the biomarker sample are reported in Table 6. Unadjusted HbA1c levels are highest (reflecting worse glycemic control) amongst Food Stamp recipients (7.22 vs. 7.11 amongst non-takers). This is consistent with the relatively high rates of food insufficiency reported by Food Stamp recipients and erratic consumption cycles documented in other papers (Shapiro, 2005; Stephens, 2003).
Table 6.
Characteristics of diabetic Food Stamp recipients and non-recipients, biomarker sample.
| Food Stamps |
Eligible non-takers |
Ineligibles | |
|---|---|---|---|
| HbA1c level | 7.22 (1.35) | 7.11 (1.50) | 6.90 (1.26) |
| HbA1c ≤ 7 | 0.48 (0.50) | 0.61 (0.49) | 0.64 (0.48) |
| Exercise | 0.21 (0.41) | 0.30 (0.46) | 0.40 (0.49) |
| Smokes | 0.17 (0.38) | 0.13 (0.33) | 0.07 (0.26) |
| HbA1c screening | 0.45 (0.50) | 0.55 (0.50) | 0.51 (0.50) |
| Cholesterol screening | 0.33 (0.47) | 0.31 (0.46) | 0.26 (0.44) |
| Retinopathy | 0.33 (0.47) | 0.27 (0.44) | 0.29 (0.46) |
| Food insufficient | 0.27 (0.45) | 0.16 (0.36) | 0.04 (0.20) |
| Medicaid | 0.67 (0.47) | 0.35 (0.48) | 0.05 (0.21) |
| SR health ≥ good | 0.79 (0.41) | 0.66 (0.48) | 0.38 (0.48) |
| Hispanic | 0.25 (0.44) | 0.24 (0.43) | 0.08 (0.27) |
| Black | 0.34 (0.48) | 0.34 (0.47) | 0.14 (0.35) |
| Income to needs ratio | 1.28 (1.36) | 1.13 (0.89) | 4.71 (6.87) |
| Female | 0.85 (0.36) | 0.68 (0.47) | 0.48 (0.50) |
| <High school education | 0.66 (0.48) | 0.64 (0.48) | 0.26 (0.44) |
| HS graduate | 0.19 (0.39) | 0.25 (0.43) | 0.37 (0.48) |
| ADL limitations | 0.96 (1.4) | 0.81 (1.3) | 0.33 (0.80) |
| IADL limitations | 0.80 (1.4) | 0.65 (1.2) | 0.25 (0.75) |
| Diabetes medication | 0.91 (0.28) | 0.84 (0.36) | 0.83 (0.38) |
| Age 60–65 | 0.28 (0.45) | 0.28 (0.45) | 0.24 (0.43) |
| Age 70–75 | 0.29 (0.45) | 0.17 (0.38) | 0.22 (0.41) |
| Age 75–80 | 0.10 (0.29) | 0.15 (0.35) | 0.17 (0.37) |
| Age ≥ 80 | 0.15 (0.36) | 0.19 (0.39) | 0.17 (0.38) |
| Overweight | 0.88 (0.33) | 0.82 (0.39) | 0.80 (0.40) |
| HMO enrollee | 0.13 (0.34) | 0.10 (0.30) | 0.15 (0.36) |
| No Medicare data | 0.25 (0.44) | 0.27 (0.45) | 0.27 (0.44) |
| Observations | 126 | 462 | 2029 |
Standard deviations in parentheses. 2003 and 2006 data.
Despite worse glycemic control, Food Stamp recipient diabetics surveyed in the MSD report similar dietary quality to more affluent respondents. The unadjusted data may reflect beneficial effects of Food Stamps overshadowed by higher overall disease burden amongst the Food Stamp recipients. As Table 7 shows, Food Stamp diabetics report following medical nutrition therapy diets one day fewer on average per week than non-recipients (4.5 vs. 5.5), but are able to achieve similar levels of fruit consumption (4.5 days vs. 4.9) and eat less dessert (2.3 days vs. 2.9).
Table 7.
Diabetic nutrition behavior, 2003.
| Food Stamps | Non-takers | Ineligibles | |
|---|---|---|---|
| Know diabetic diet | 0.76 (0.43) | 0.74 (0.44) | 0.82 (0.49) |
| Days/week follow diet | 4.5 (1.8) | 5.5 (1.9) | 5.4 (1.7) |
| Days/week eat 5+ fruits or vegetables | 4.5 (1.7) | 4.9 (2.0) | 4.9 (1.7) |
| Days/week eat high fat foods | 3.7 (2.0) | 3.2 (2.0) | 3.5 (1.9) |
| Days/week eat 2+ snacks or dessert | 2.3 (1.3) | 2.9 (2.0) | 2.9 (1.9) |
| Observations | 67 | 67 | 1031 |
Standard deviations in parentheses.
Subset of summary of diabetes self-care activities scale.
Table 8 shows that there is no significant difference in glycemic control between FSP recipients and non-participants conditional on observable characteristics. Odds of compliance with the ADA recommended HbA1c level below 7 do not vary for Food Stamp recipients versus non-recipients (OR = 0.70, 95% CI = (0.37, 1.02)). There is also no difference in the odds of uncontrolled blood sugar; Food Stamp recipients face the same odds of HbA1c levels below 9% (OR = 1.19, 95% CI = (0.49, 2.64)), suggesting that they do not face higher risk of severe diabetes mis-management problems than non-recipients.
Table 8.
Food Stamp receipt and glycemic control (HbA1c level).
| HbA1c < 7% | HbA1c < 9% | |
|---|---|---|
| Food Stamp receipt | 0.7 [0.44, 1.12] | 1.19 [0.51, 2.78] |
| Currently exercises | 1.17 [0.75, 1.82] | 1.31 [0.58, 2.97] |
| Current smoker | 1.09 [0.61, 1.93] | 0.61 [0.25, 1.50] |
| A1c screening | 1.19 [0.75, 1.87] | 1.1 [0.50, 2.41] |
| Cholesterol screening | 0.97 [0.58, 1.60] | 0.7 [0.25, 1.93] |
| Retinopathy | 1.08 [0.69, 1.69] | 0.89 [0.35, 2.29] |
| Observations | 588 | 588 |
95% confidence intervals below coefficients.
All specifications control for variables reported in Table 6.
5.5. Robustness
Our findings persist across numerous robustness checks. Integration of survey and Medicare data requires decisions about data structure and study population that may influence results. In the main analysis, we use annual Medicare data from the year of interview. This includes utilization that occurs after the interview, but ensures that independent variables represent events that have occurred prior to or simultaneously with the interview. The median HRS interview typically occurs in May or June of the interview year. Survey questions are retrospective, asking respondents about the period since their last interview, so responses may reflect recent health conditions and program participation or events that considerably predate the interview. As a robustness check, we reestimate Eq. (1) merging survey responses to Medicare data from the year prior to interview instead of the current year. In these regressions, we find no relationship between Food Stamp receipt and Medicare spending nor any of the utilization measures. Coefficients are statistically insignificant and small in magnitude.6
Finally, we consider the possibility of a threshold effect, with only larger benefit amounts affecting diabetic health outcomes. We reestimated models using only Food Stamp recipients with benefits above the median monthly payment to consider the possibility that only larger benefits are related to diabetics’ health. These results are consistent with other specifications and are statistically insignificant.
While this paper has focused on the potential health effects of Food Stamp receipt, it is also possible that changes in health motivate program participation or disenrollment. We exploit the panel nature of the HRS data to examine whether new diabetes diagnoses trigger changes in Food Stamp receipt across waves. We find no evidence that diagnoses trigger movement into or out of the program, which helps to allay concerns about endogeneity of health status and program participation.
The observed relationship between FSP participation and glycemic control may be biased by unobserved factors which drive take-up of Food Stamps and diabetes self-management. With only one bloodspot per respondent, fixed effects cannot be included to absorb the time-invariant factors. As a robustness test, we use propensity score matching to create a non-recipient control group that is statistically similar to the Food Stamp recipients on average across all observed covariates (Dehejia and Wahba, 1999; Rosenbaum and Rubin, 1985). This approach efficiently uses available data to create a control group for whom the ignorability of treatment assignment assumption holds conditional on observed covariates. Nearest-neighbor matching is used to match each Food Stamp recipient to the non-recipient with the closest propensity to receive Food Stamps.
By matching on work status, race, household income, presence of comorbidities, continuous and categorical age and the diabetes compliance variables, we are able to achieve balance on all covariates included in previous models. Results from the 443 observations for which there is common support yield small and insignificant treatment effects. Causal inference using propensity scores requires the assumption that observed characteristics are the only confounding covariates between Food Stamp receipt and diabetes control, which cannot be directly tested. One test of the design which we are able to perform is to estimate the propensity scores without matching on diabetes compliance. When we omit these variables, the estimated effect of Food Stamp receipt is larger in magnitude and statistically significant, suggesting that the non-recipients who are economically and demographically most similar to Food Stamp recipients have different compliance behaviors resulting in lower HbA1c levels.
6. Conclusions and policy implications
Reducing Medicare spending on chronic illness is critical for the program’s long-term financial sustainability. The spread of diabetes, a disease closely tied to diet, amongst older adults, highlights the potential for non-health programs to impact Federal health expenditures. This paper considers the relationship between Food Stamp receipt and a number of health spending and utilization outcomes for elderly diabetics. Participation in the Food Stamp program could be associated with improved health through improved diet quality or increased household resources, or hurt health by imposing erratic consumption patterns or promoting excessive food consumption. We use a longitudinal dataset merging Health and Retirement Study survey, Medicare claims and biomarker data and find little evidence that Food Stamp receipt is related to Medicare spending or health outcomes for diabetics.
This paper contributes to an underdeveloped literature understanding the health effects of Food Stamp receipt. Findings are consistent with the related Food Stamps and obesity literature, which also fails to find causal evidence that Food Stamp receipt impacts obesity (Ver Ploeg and Ralston, 2008). While many papers have considered the high rates of obesity amongst Food Stamp recipients, the growing diabetes epidemic amongst Food Stamp recipients and eligible non-participants has received little attention. We first use HRS linked Medicare data to describe the growing prevalence of diabetes amongst Food Stamp receiving and eligible older adults. Nearly one-third of elderly Food Stamp recipients are diabetic, averaging close to $4000 more in Medicare spending than non-diabetics. In fixed effect regression models, we find no relationship between Food Stamp receipt and Medicare spending, diabetes hospitalizations, outpatient visits and risk of End-Stage Renal Disease.
The relationship between Food Stamp receipt and health care utilization varies for subpopulations. Food Stamp receipt is significantly associated with a 3 percentage point decline in risk of ESRD for non-Whites but also an 8 percentage point increase in risk of hospitalization for non-Whites and those with less than a high school education.
We also use recently collected biomarker data to consider the relationship between Food Stamp receipt and glycemic control. This is one pathway through which Food Stamp receipt could influence health care spending and utilization. Again we find an insignificant relationship between Food Stamp receipt and health. In cross-sectional data, we find that no difference in the odds that Food Stamp recipients meet American Diabetes Association treatment guidelines or have poor glycemic control consistent with diabetes management problems.
Several unavoidable limitations should be considered when interpreting these results. Although we include a number of controls for potential selection into Food Stamps including administrative measures of compliance with diabetes treatment guidelines and individual fixed effects, it is possible that we have not accounted for all potential sources of bias necessary to capture the causal effect of Food Stamps on health. Keating et al. (2003) show that administrative data can lead to undercounting of diabetes compliance indicators, particularly for minorities. While we use a two-year lookback period to minimize this potential bias, it is impossible to know whether all compliant diabetics are correctly classified. Medicare data necessarily excludes Medicaid spending, so we do not capture all spending on the dual-eligibles in the sample. Despite the inherent limitations of the administrative data, it enables us to consider many outcomes and measures of selection bias that are unavailable in survey data alone. As this study focused on elderly Food Stamp recipients, findings may not generalize to children and working-age adults, though diabetes is increasing in these populations as well. Future research should consider the health effects of Food Stamp receipt and evaluate the health effects of alternative benefit delivery mechanisms.
The growing burden of diabetes amongst low-income Medicare beneficiaries suggests a role for policy intervention. Coordination between the Food Stamp program, Medicare and Medicaid can help provide diabetics with nutrition counseling to select appropriate food choices within the Food Stamp budget. Policymakers should consider the adequacy of the Food Stamp budget for medical nutrition therapy. One-third of Food Stamp recipient diabetics report food insufficiency, raising questions about whether changes to program design such as larger benefits or more frequent benefit disbursements would benefit older diabetics. While we find little evidence that Food Stamps affect health of diabetics, alternative food delivery mechanisms, such as provision of specific food bundles that promote diabetes self-management may be a more effective way to protect the health of this population. The United States Department of Agriculture may want to consider the health impact of both providing benefits that can only be used on nutritious foods likely to be consistent with the medical nutrition therapy diet as well as more flexible and frequent benefits that could be used for food and other health related purchases. We note that the changes to the Food Stamp program recommended to improve diabetes health outcomes are also expected to help improve recipients’ weight outcomes (Averett, 2010).
Acknowledgments
I gratefully acknowledge funding from the United States Department of Agriculture Economic Research Service and the National Institute on Aging through grant P30 AG012846. I thank David Betson, Adam Chen, Chris Cigolle, Katie Fitzpatrick, Jack Iwashyna, Bob LaLonde, Helen Levy and David Weir for helpful comments and discussion.
Footnotes
The Food Stamp program is currently known as the Supplemental Nutrition Assistance Program, or SNAP. As this study analyzes data from a period prior to the name change, we refer to the Food Stamp program throughout the text.
This figure is based on HRS respondents who are enrolled in Fee-for-Service Medicare for all of calendar year 2004. Decedents are excluded, so reported trends are not an artifact of end-of-life utilization.
Diabetes hospitalizations have a primary diagnosis code of 249.xx, 250.xx, or 271.4, the majority of these are 250.xx, others are included for completeness.
Conditional logit regressions would be appropriate for the last three outcomes, in practice these models failed to converge in the available secure computing environment.
This variable is only included in more recent HRS waves and cannot be included in the longitudinal analyses.
Estimates available from the authors upon request.
References
- Almond D, Hoynes HW, Schanzenbach D. Inside the war on poverty: the impact of food stamps on birth outcomes. 2008. NBER Working Paper 14306.
- American Diabetes Association Standards of diabetes care. Diabetes Care. 2007;30(Suppl. 1):S4–S42. doi: 10.2337/dc07-S048. [DOI] [PubMed] [Google Scholar]
- American Diabetes Association Nutrition recommendations and interventions for diabetes. Diabetes Care. 2008;31(Suppl. 1):S61–S78. doi: 10.2337/dc08-S061. [DOI] [PubMed] [Google Scholar]
- American Diabetes Association Summary of Revisions for the 2010 Clinical Practice Recommendations. Diabetes Care. 2010;33(Supplement 1):S3. doi: 10.2337/dc10-S003. [DOI] [PMC free article] [PubMed] [Google Scholar]
- Asper F. Medicare Managed Care Enrollees and the Medicare Utilization Files. Minneapolis: 2009. Research Data Assistance Center Publication TN009. [Google Scholar]
- Averett SL. In: Obesity among Poor Americans: Is Public Assistance the Problem? Smith Patricia K., editor. Vanderbilt University Press; Nashville, Tennessee: 2010. p. 197. ISBN: 978-0-8265-1636-7, paperback. [Google Scholar]; Economics and Human Biology. 8(3):421–422. [Google Scholar]
- Chen Z, Yen ST, Eastwood DB. Effects of food stamp participation on body weight and obesity. American Journal of Agricultural Economics. 2005;87(5):1167–1173. [Google Scholar]
- Coburn T. [accessed 10.07.10];Remarks at the White House Health Care Summit. 2010 February 25; 2010. Available from: http://www.washingtonpost.com/wp-dyn/content/article/2010/02/25/AR2010022502664.html.
- Currie J. U.S. food and nutrition programs. In: Moffit R, editor. Means-tested Transfer Programs in the United States. National Bureau of Economic Research Conference Report; 2003. pp. 199–290. [Google Scholar]
- Currie J, Cole N. Welfare and Child Health: the link between AFDC participation and birth weight. The American Economic Review. 1993;83(4):971–985. [Google Scholar]
- Dehejia RH, Wahba S. Causal effects in non-experimental studies: re-evaluating the evaluation of training programs. Journal of the American Statistical Association. 1999;94:1053–1062. [Google Scholar]
- Dietz WH. Does hunger cause obesity? Pediatrics. 1995;95(5):766–767. [PubMed] [Google Scholar]
- Finkelstein EA, Trogdon JG, Cohen JW, Dietz W. Annual medical spending attributable to obesity: payer-and service-specific estimates. Health Affairs Web Exclusive. 2009;28:w822–w831. doi: 10.1377/hlthaff.28.5.w822. [DOI] [PubMed] [Google Scholar]
- Gold M, Thornton C, Hedley A, Fahlman C, Felt-Lisk S, Weathers B, Croghan T. Federal medical and disability program costs associated with diabetes, 2005. Mathematica Policy Research. 2007 [Google Scholar]
- Haider SJ, Jacknowitz A, Schoeni RF. Food stamps and the elderly: why is participation so low? Journal of Human Resources. 2003;38(Suppl.):1080–1111. [Google Scholar]
- Hebert PL, Geiss LS, Tierney EF, Engelgau MM, Yawn BP, McBean AM. Identifying persons with diabetes using Medicare claims data. American Journal of Medical Quality. 1999;14(6):270–277. doi: 10.1177/106286069901400607. [DOI] [PubMed] [Google Scholar]
- Heisler M, Faul JD, Hayward RA, Langa KM, Blaum C, Weir D. Mechanisms for Racial and Ethnic Disparities in Glycemic Control in Middle-aged and Older Americans in the Health and Retirement Study. Archives of Internal Medicine. 2007;167(17):1853–1860. doi: 10.1001/archinte.167.17.1853. [DOI] [PubMed] [Google Scholar]
- Health and Retirement Study 2003 Mail Survey on Diabetes. Data Description and Usage. 2007a [Google Scholar]
- Health and Retirement Study 2006 Biomarker Data. Data Description and Usage. 2007b [Google Scholar]
- Hoynes H, Schanzenbach D. Consumption responses to in-kind transfers: evidence from the introduction of the food stamp program. American Economic Journal: Applied Economics. 2009;1(4):109–139. [Google Scholar]
- Huang ES, Basu A, O’Grady M, Capretta JC. Projecting the Future Diabetes Population Size and Related Costs for the U.S. Diabetes Care. 2009;32(12):2225–2229. doi: 10.2337/dc09-0459. [DOI] [PMC free article] [PubMed] [Google Scholar]
- Johnson SR, Burt JA, Morgan KA. The Food Stamp Program: Participation, Food Costs, and Diet Quality for Low-Income Households. Food Technology. 1981;35:58–70. [Google Scholar]
- Juster T, Suzman R. An overview of the Health and Retirement Study. Journal of Human Resources. 1995;30(Suppl.):S7–S56. [Google Scholar]
- Kaushal N. Do food stamps cause obesity? Evidence from immigrant experience. Journal of Health Economics. 2007;26(5):968–991. doi: 10.1016/j.jhealeco.2007.01.006. [DOI] [PubMed] [Google Scholar]
- Keating NL, Landrum MB, Landon BE, Ayanian JZ, Borbas C, Guadagnoli E. Measuring the quality of diabetes care using administrative data: is there bias? Health Services Research. 2003;38(6 Pt 1):1529–1545. doi: 10.1111/j.1475-6773.2003.00191.x. [DOI] [PMC free article] [PubMed] [Google Scholar]
- Levedahl JW. Technical Bulletin. Economic Research Service, U.S. Department of Agriculture; Washington, DC: 1991. Effect of Food Stamps and Income on Household food Expenditures. [Google Scholar]
- Levedahl JW. A theoretical and empirical evaluation of the functional forms used to estimate the food expenditure equation of food stamp recipients. American Journal of Agricultural Economics. 1995;77(4):960–968. [Google Scholar]
- Mitka M. Hemoglobin A1c poised to become preferred test for diagnosing diabetes. Journal of the American Medical Association. 2009;301(15):1528. doi: 10.1001/jama.2009.479. [DOI] [PubMed] [Google Scholar]
- National Committee for Quality Assurance [accessed 20.02.10];Healthcare effectiveness data and information set 2010. 2010 Available from: http://www.ncqa.org/portals/0/HEDISQM/HEDIS2010/2010Measures.pdf.
- National Diabetes Information Clearinghouse . Diabetes Overview. Bethesda: 2008. NIH Publication No. 09-3873. [Google Scholar]
- Nelson K, Brown ME, Lurie N. Hunger in an Adult Patient Population. Journal of the American Medical Association. 1998;279(15):1211–1214. doi: 10.1001/jama.279.15.1211. [DOI] [PubMed] [Google Scholar]
- Nelson K, Cunningham W, Andersen Ron., Harrison G, Gelberg L. Is Food Insufficiency Associated with Health Status and Health Care Utilization Among Adults with Diabetes? Journal of General Internal Medicine. 2001;16(6):404–411. doi: 10.1046/j.1525-1497.2001.016006404.x. [DOI] [PMC free article] [PubMed] [Google Scholar]
- Rosenbaum PR, Rubin DB. Constructing a control group using multivariate matched sampling methods that incorporate the propensity score. The American Statistician. 1985;39(1):33–38. [Google Scholar]
- Sakshaug JW, Couper MP, Ofstedal MB. Characteristics of physical measurement consent in a population-based survey of older adults. Medical Care. 2010;48(1):64–71. doi: 10.1097/mlr.0b013e3181adcbd3. [DOI] [PMC free article] [PubMed] [Google Scholar]
- Shapiro J. Is there a daily discount rate? Evidence from the food stamp nutrition cycle. Journal of Public Economics. 2005;89(2–3):303–325. [Google Scholar]
- Sloan FA, Bethel A, Ruiz D, Shea AH, Feinglos MN. The growing burden of diabetes mellitus in the us elderly population. Archives of Internal Medicine. 2009;168(2):192–198. doi: 10.1001/archinternmed.2007.35. [DOI] [PubMed] [Google Scholar]
- Stephens M. “3rd of the Month”: do social security recipients smooth consumption between checks? American Economics Review. 2003;93(1):406–422. [Google Scholar]
- Thorpe K, Howard DH. The Rise in Spending among Medicare Beneficiaries: The Role of Chronic Disease Prevalence and Changes in Treatment Intensity. Health Affairs. 2006;25:w378–w388. doi: 10.1377/hlthaff.25.w378. [DOI] [PubMed] [Google Scholar]
- U.S. Committee on Ways and Means . The Green Book 2008. House Committee on Ways and Means; Washington, DC: 2008. [Google Scholar]
- U.S. Department of Agriculture [accessed 20.07.10];Supplemental Nutrition Assistance Program: Number of Persons Participating. 2010 Available from: www.fns.usda.gov/pd/29SNAPcurrPP.htm.
- Ver Ploeg M, Ralston K. Food Stamps and obesity: What do we know? United States Department of Agriculture Economic Research Service Economic Information Bulletin; 2008. p. 34. [Google Scholar]
- Weimer J. U.S. Department of Agriculture; Factors Affecting Nutrient Intake of the Elderly. 1998 Agricultural Economic Report No. 769.
- Wilde PE, McNamara PE, Ranney CK. The effects of income and food programs on dietary quality: a seemingly unrelated regression analysis with error components. American Journal of Agricultural Economics. 1998;81(4):959–971. [Google Scholar]
- Wu A. Why do so few elderly use Food Stamps? 2009. Unpublished draft.
- Zagorsky J, Smith PK. Does the U.S. Food Stamp Program contribute to adult weight gain? Economics and Human Biology. 2009;7(2):246–258. doi: 10.1016/j.ehb.2009.05.003. [DOI] [PubMed] [Google Scholar]