Abstract
WNK1 (with-no-lysine[K]-1) is a protein kinase of which mutations cause a familial hypertension and hyperkalemia syndrome known as pseudohypoaldosteronism type 2 (PHA2). Kidney-specific (KS) WNK1 is an alternatively spliced form of WNK1 kinase missing most of the kinase domain. KS-WNK1 downregulates the Na+-Cl− cotransporter NCC by antagonizing the effect of full-length WNK1 when expressed in Xenopus oocytes. The physiological role of KS-WNK1 in the regulation of NCC and potentially other Na+ transporters in vivo is unknown. Here, we report that mice overexpressing KS-WNK1 in the kidney exhibited renal Na+ wasting, elevated plasma levels of angiotensin II and aldosterone yet lower blood pressure relative to wild-type littermates. Immunofluorescent staining revealed reduced surface expression of total and phosphorylated NCC and the Na+-K+-2Cl− cotransporter NKCC2 in the distal convoluted tubule and the thick ascending limb of Henle's loop, respectively. Conversely, mice with targeted deletion of exon 4A (the first exon for KS-WNK1) exhibited Na+ retention, elevated blood pressure on a high-Na+ diet and increased surface expression of total and phosphorylated NCC and NKCC2 in respective nephron segments. Thus, KS-WNK1 is a negative regulator of NCC and NKCC2 in vivo and plays an important role in the control of Na+ homeostasis and blood pressure. These results have important implications to the pathogenesis of PHA2 with WNK1 mutations.
INTRODUCTION
WNK (with-no-lysine [K]) kinases are serine–threonine protein kinases discovered as homologues of mitogen-activated protein kinases (1). They are named for the unusual position of the catalytic lysine in subdomain I instead of subdomain II (1). The mammalian WNK family consists of four members, WNK1–4, which share 85–90% sequence identity in the kinase domain (1–3). The discovery that mutations in WNK1 and WNK4 cause the autosomal-dominant hypertension and hyperkalemia known as pseudohypoaldosteronism type 2 (PHA2) led to extensive characterization of their properties and function. Studies have shown that WNK1 and WNK4 regulate various Na+, K+ and Cl− transporters (4–9). Dysregulation of these transporters contribute to the hypertension and hyperkalemia phenotypes in PHA2.
The regulation of some transporters requires the kinase function of WNKs. For example, WNK1 and 4 phosphorylate and activate oxidative stress-responsive kinase-1 and its related Ste20-related proline-alanine-rich kinase (SPAK), which in turn phosphorylate and activate the thiazide-sensitive sodium chloride cotransporter NCC and the bumetanide-sensitive sodium–potassium-2 chloride cotransporter NKCC (10–12). In addition, WNKs have kinase-independent roles. WNK1 and 4 directly interact with serum- and glucocorticoid-induced kinase-1, causing it to activate the epithelial Na+ channel ENaC (13). WNK1 and 4 enhance endocytosis of the renal outer medullary K+ channel (ROMK) also via a kinase-independent mechanism that involves a direct interaction with an endocytic scaffold protein, intersectin (9).
Both human and mouse WNK1 genes consist of 28 exons and are alternatively spliced (2,14,15). The full-length WNK1 (FL-WNK1) transcript produced from all 28 exons is ubiquitously expressed (1,2). An alternatively spliced WNK1 transcript produced by the alternative initiating exon4A and exon5 through 28 is expressed exclusively in the kidney and encodes a peptide referred to as kidney-specific WNK1 (KS-WNK1) (14,15). Thus, KS-WNK1 lacks amino acids 1–437 of the FL-WNK1 that are encoded by exon1 through 4. The first 30 amino acids of KS-WNK1 encoded by exon4A are unique to KS-WNK1. In the kidney, KS-WNK1 is predominantly expressed in the distal convoluted tubule (DCT), the connecting tubule and the cortical collecting duct (16). The transcript for KS-WNK1 in the kidney is more abundant than that for FL-WNK1 (14,15). Their relative protein abundance in the kidney has not yet been determined.
Studies have shown that KS-WNK1 antagonizes FL-WNK1 regulation of the renal K+ transport. FL-WNK1 inhibits the renal K+ channel ROMK by enhancing clathrin-coated vesicle-mediated endocytosis of the channel (7–9). KS-WNK1, by itself, has no effect on ROMK1, but antagonizes the inhibition of ROMK1 caused by FL-WNK1 (8). We found that amino acids 1–253 of KS-WNK1 are necessary and sufficient for the antagonism of the effect of FL-WNK1 on ROMK (17). Moreover, mice overexpressing amino acids 1–253 of KS-WNK1 display increased surface expression of ROMK in the renal distal tubules and decreased serum K+ levels, supporting that KS-WNK1 is a physiological antagonist of FL-WNK1. We also demonstrated that the ratio of full-length versus KS-WNK1 regulates surface abundance of ROMK channels and renal K+ secretion. With respect to Na+ transporter, Yang et al. (18) reported that KS-WNK1 antagonizes the increase in the surface expression of NCC by FL-WNK1 expressed in Xenopus oocytes. The physiological role of KS-WNK1 in the regulation of NCC and potentially other Na+ transporters in vivo, however, is unknown. The present study examined these questions.
RESULTS
Transgenic mice overexpressing KS-WNK1 in the kidney have reduced blood pressure and elevated plasma levels of aldosterone and angiotensin II
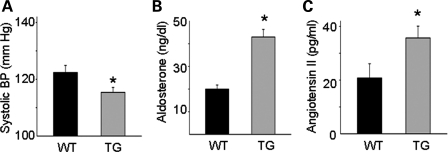
We measured blood pressure in transgenic (TG) mice overexpressing amino acids 1–253 of KS-WNK1 in the kidney and wild-type (WT) littermates using a tail-cuff sphygmomanometer. The systolic blood pressure of TG mice was significantly lower than that of WT littermates under normal Na+ diets (Fig. 1A; 115 ± 2 versus 122 ± 3 mmHg, n = 8 each, P < 0.05). The diastolic BP of TG mice was also lower than that of WT (data not shown). We measured plasma aldosterone and angiotensin II levels to assess the effective circulating volume status. The plasma aldosterone (Fig. 1B, 42 ± 3 versus 20 ± 2 ng/dl, n = 10, P< 0.001) and angiotensin II (Fig. 1C, 35 ± 4 versus 20 ± 6 pg/ml, n = 6, P < 0.05) levels of TG mice were elevated compared with those of WT mice (Fig. 1B and C). Blood electrolytes and creatinine are shown in Table 1. As previously reported by us (17), plasma K+ concentration of these TG mice is lower than that of WT mice, due to increased tubular K+ secretion from the upregulation of ROMK. A decrease in the plasma K+ levels should suppress aldosterone secretion from the adrenal gland. Thus, the increase in the aldosterone levels in KS-WNK1-TG mice as observed is likely due to the activation of the renin–angiotensin system, consistent with the notion that a low effective circulating volume causes the decrease in blood pressure.
Figure 1.
Blood pressure (A), plasma aldosterone (B) and angiotensin II (C) levels in WT and KS-WNK1-TG (TG) mice. Mice were on normal rodent diets. The asterisk indicates P< 0.05 versus WT mice.
Table 1.
Blood data of TG mice overexpressing amino acids 1–253 of KS-WNK1 versus WT mice
| WT (n = 10) | TG (n = 10) | |
|---|---|---|
| Na (mm/l) | 145.6 ± 0.5 | 144.6 ± 0.4 |
| K (mm/l) | 4.94 ± 0.22 | 3.92 ± 0.24* |
| Cl (mm/l) | 116.3 ± 0.7 | 114.4 ± 0.5 |
| Ca (mm/l) | 1.15 ± 0.12 | 1.11 ± 0.20 |
| Mg (mm/l) | 0.60 ± 0.13 | 0.59 ± 0.09 |
| Creatinine (mg/dl) | 0.106 ± 0.011 | 0.086 ± 0.010 |
Values in mean ± SEM. Mice were on normal rodent diets.
*P < 0.05 TG versus WT.
Renal Na+ wasting in KS-WNK1-TG mice
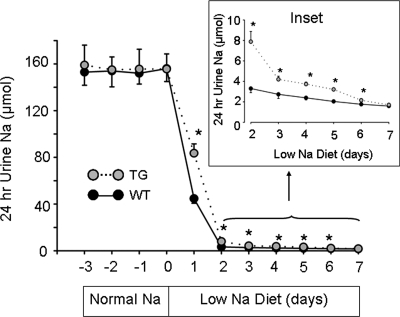
We conducted Na+ balance studies to evaluate the mechanism of hypovolemia in TG mice. Differences in the steady-state urinary Na+ excretion may reflect differences in dietary intake rather than the ability of renal tubules to reabsorb Na+. We designed experiments to examine the renal handling of Na+ under non-steady state. KS-WNK1-TG and WT mice were pair-fed normal Na+ diets (0.49% NaCl, g per 100 g diet) for 2 weeks to allow reaching a steady state, and this was followed by low-Na+ diets (0.01%) for 1 week. Twenty-four hour urinary Na+ excretion was collected daily using metabolic cages during the last 4 days on normal Na+ diets and during low-Na+ diets. As shown in Figure 2, 24 h urinary Na+ excretion was constant during the last 4 days on normal Na+ diets and was not different between TG and WT mice, indicating that mice were in a steady-state Na+ balance. Upon switching to low-Na+ diets, urinary Na+ excretion fell sharply within the first 24 h, indicating that both WT and TG mice responded to dietary Na+ restriction by increasing renal Na+ reabsorption. The initial rate of response to low-Na+ diets for KS-WNK1-TG and WT mice, however, was different. Urinary Na+ excretion collected during the first day of low-Na+ diets was 84 ± 8 and 45 ± 4 μm for TG and WT mice, respectively (Fig. 2, n = 8, P < 0.001). Na+ excretion remained significantly higher for TG mice than for WT mice from day 2 to 6 of low-Na+ diets (Fig. 2, inset). Thus, compared with WT mice, the ability of KS-WNK1-TG mice to reabsorb Na+ in response to dietary Na+ restriction is impaired. At day 7, Na+ excretion was not significantly different between TG and WT mice, indicating reaching a new steady state.
Figure 2.
Urinary Na+ excretion in response to dietary Na+ restriction. Shown are Na+ excretion in KS-WNK1-TG (gray circles, n = 8, mean ± SEM) and WT mice (black circles, n = 8, mean ± SEM). Twenty-four-hour urine was collected daily on normal Na+ diets (0.49% NaCl) for 4 days (−3, −2, −1, 0). Diets were switched to low-Na+ diets (0.01% NaCl) on day 0 and 24 h urine collection continued for 7 days. Inset is Na+ excretion in day 2–7 of low-Na+ diets shown in an expanded scale. The asterisk indicates P< 0.05 versus WT mice.
Reduced expression and phosphorylation of NCC in the kidney of KS-WNK1 TG mice
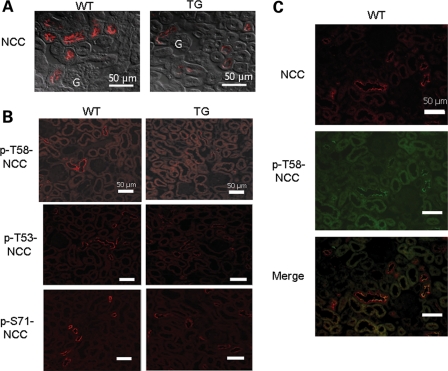
We next investigated the effect of increased KS-WNK1 on expression and phosphorylation of NCC cotransporter in the mouse kidney. Immunofluorescent staining revealed that the abundance of NCC in the DCT was decreased in TG mice (Fig. 3A). We further investigated the phosphorylation status of NCC using residue-specific anti-phospho-antibodies. As shown, phosphorylation of NCC at threonine-58 (T58; numbering based on rat NCC sequence), threonine-53 (T53) and serine-71 (S71) was all reduced in TG mice (Fig. 3B). The specificity of antibodies for NCC was validated by double-labeling immunofluorescent staining in the kidney of WT mice. As shown, antibody against (unphosphorylated) NCC and against phospho-T58 of NCC (p-T58-NCC) labeled the same tubule (Fig. 3C). Interestingly, within the same tubule, the labeling by these two antibodies did not completely overlap. The labeling by antibody against p-T58-NCC appeared to be relatively more concentrated to the apical membranes, whereas that by antibody against NCC showed a broader distribution (Fig. 3C, merged images).
Figure 3.
Immunofluorescent staining of NCC in WT and KS-WNK1-TG mice. (A) Immunofluorescence of NCC in the renal cortex of homozygous TG mice and WT mice. The microscopic images were obtained using ×40 objective lens. Fluorescent images were merged with differential interference contract image to better illustrate subcellular distribution. Scale bar: 50 µm. ‘G’ indicates glomerulus. (B) Immunofluorescence of p-NCC (T58, T53, S71) in TG and WT mice. Cortical sections of kidneys were subjected to immunofluorescent staining using indicated residue-specific anti-phosphor-antibodies (T58, T53 and S71) and visualized at a magnification of ×20. Scale bar: 50 µm. (C) Double-immunofluorescent staining of NCC (red, rabbit antibody) and p-T58-NCC (green, sheep antibody) in WT mice. Scale bar: 50 µm.
Reduced expression and phosphorylation of NKCC2 in the kidney of KS-WNK1-TG mice
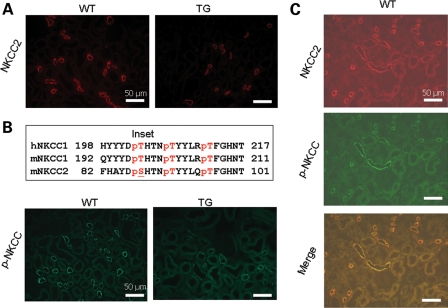
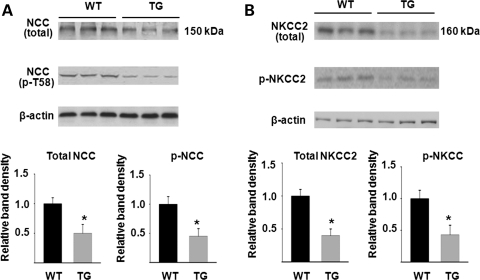
We next examined the impact of increased KS-WNK1 on expression and phosphorylation of Na-K-2Cl cotransporter in the mouse kidney. Similar to NCC, immunofluorescent staining using NKCC2-specific antibody showed a moderate reduction in the abundance of the transporter in TG mice (Fig. 4A). Phosphorylation of NKCC2 was analyzed using a pan anti-phospho-NKCC antibody that was raised against a cluster of three phospho-threonine residues in the N-terminus of NKCC1 (T203, T207 and T212; numbering based on human NKCC1 sequence) (10). This antibody is expected to recognize NKCC2 as well since two of three threonine residues and the overall amino acids included to generate the antibody are conserved in NKCC2 (19) (Fig. 4B, inset). We observed that phospho-NKCC was also reduced in TG mice (Fig. 4B). We also performed double-labeling using anti-NKCC2 and pan anti-phospho-NKCC antibodies in the kidney of WT mice. As shown, anti-NKCC2 antibody labeled the apical side of thick ascending limb (TAL) of Henle's loop (Fig. 4C). Pan anti-p-NKCC antibody labeled the apical side of same tubules as the anti-NKCC2 antibody. In contrast to NKCC2, which is expressed only in the apical membrane of TAL, NKCC1 is broadly expressed in tissues including the kidney (20,21). In the kidney, NKCC1 is expressed in the basolateral membrane of medullary collecting ducts (22,23). Thus, the apical labeling by pan anti-p-NKCC antibody in the renal cortex likely represents NKCC2. Similar to NCC, p-NKCC2 appeared to be more highly expressed in apical regions compared with the total NKCC2 (Fig. 4C, merged image). Semi-quantitative western blot analysis confirmed that, compared with WT mice, KS-WNK1-TG mice had reduced abundance of total and phosphorylated NCC and NKCC2 in the kidney cortex (Fig. 5).
Figure 4.
Immunofluorescent staining of NKCC2 in WT and KS-WNK1-TG mice. (A) Immunofluorescence of NKCC2 in the cortex of TG and WT mice. Scale bar: 50 µm. (B) Immunofluorescence of p-NKCC in the cortex of TG and WT mice. Scale bar: 50 µm. Inset shows amino acid sequence of human NKCC1 used for generating pan anti-p-NKCC antibody, and the corresponding sequence of mouse NKCC1 and NKCC2. Single-letter denotation of amino acids is used. ‘p’ indicates phosphate residue attached to the following threonine or serine. (C) Double-staining of NKCC2 (red, rabbit antibody) and p-NKCC (green, sheep antibody) in WT mice. Scale bar: 50 µm.
Figure 5.
Semi-quantitative western blot analysis of total and phosphorylated NCC (A) and NKCC2 (B) abundance in WT and KS-WNK1-TG mice. Top panels are representative blots from three separate experiments (each experiment includes three control and three mutant mice). Lower panels summarize densitometric analysis of NCC, p-NCC, NKCC2, p-NKCC normalized to β-actin. Bar graph (mean ± SEM, n = 9 combined from three separate experiments) shows density relative to WT (i.e. WT = 1). The asterisk indicates P < 0.05 versus WT by two-tailed unpaired Student's t-test.
Generation of KS-WNK1-KO mice and analysis of blood chemistry and blood pressure
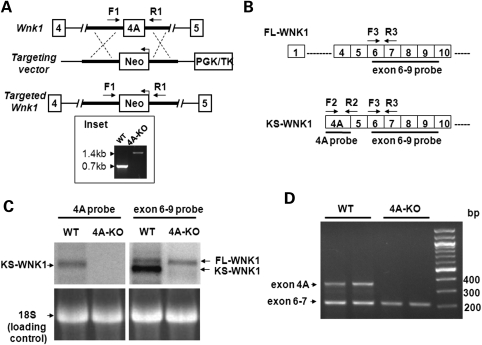
To further examine the in vivo physiological role of KS-WNK1 in Na+ transport, we created KS-WNK1-KO mice. This was accomplished using homologous recombination gene-targeting to replace the first coding exon of KS-WNK1, exon4A, by a DNA cassette containing the selectable marker gene neomycin transferase (Fig. 6A). Deletion of exon4A was verified by polymerase chain reaction (PCR) using forward and reverse primers as indicated. As shown, PCR analysis of tail DNA from WT and homozygous KS-WNK1 knockout (4A-KO) mice revealed DNA bands of ∼0.7 and 1.4 kb in size as predicted for WT and mutant alleles, respectively (Fig. 6A, inset). Northern blot analysis using probes specific for exon4A and exon 6–9, respectively (Fig. 6B), revealed that WT mice expressed KS-WNK1 as well as FL-WNK1 (Fig. 6C). In contrast, 4A-KO mice did not express KS-WNK1, but had a normal expression of FL-WNK1 (Fig. 6C). The results of northern blot analysis were confirmed by reverse-transcription (RT)-PCR analysis (Fig. 6D). To see whether deletion of exon 4A affects expression of FL-WNK1 inadvertently (or induces compensatory changes), we performed quantitative real-time PCR analysis using primers specific for FL-WNK1 and found that levels of FL-WNK1 transcript were not different between WT and 4A-KO mice (Supplementary Material, Fig. S1).
Figure 6.
Generation of KS-WNK1-null mice and confirmation of lack of KS-WNK1 expression. (A) Targeting strategy for generating 4A-KO mice. The diagram shows WT Wnk1 locus, targeting construct and the targeted locus with the deletion of exon4A. Genotyping was performed by PCR using a primer set (F1 and R1) flanking exon4A. The 0.7 kb band represents the WT allele, and the 1.4 kb band represents the targeted allele containing Neo gene (in reverse orientation). (B) Diagram for initial exons of FL-WNK1 and KS-WNK1. Probes for northern blot analysis of exon 4A and exons 6–9 (solid lines) and primers for RT-PCR analysis (arrows) used in the studies shown in (C) and (D) are shown. (C) Northern blot analysis of WNK1 expression in the kidney of 4A-KO mice and WT littermate controls. Exon 4A probe detected KS-WNK1 transcript in WT, but not in 4A-KO mice. Exon 6–9 probe detected two transcripts representing FL-WNK1 and KS-WNK1, respectively, in WT mice, but detected only one transcript representing FL-WNK1 in 4A-KO mice. Also shown is 18S RNA as loading controls. (D) RT-PCR analysis of WNK1 transcripts in the WT and 4A-KO kidney. PCR primers targeting exon 4A (F2/R2 shown in B) and exons 6–7 (F3/R3, B) were combined in the same PCR reaction to detect the expression of WNK1 isoforms.
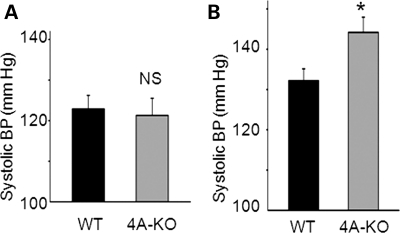
We observed no obvious differences in survival, gross physical appearance and organ morphology between KS-WNK1-KO and WT mice. Table 2 shows plasma electrolytes and creatinine of KS-WNK1-KO versus WT mice. Except for the concentration of Na+, which is slightly elevated in KS-WNK1-KO mice, there were no significant differences in plasma electrolytes and creatinine. It should be noted that KS-WNK1-KO mice were in pure 129/sv background, whereas KS-WNK1-TG mice were in C57BL/6J background, which may contribute to small differences in the basal levels of creatinine and electrolytes between KO and TG mice (Table 1 versus Table 2). On normal diets, blood pressure of KS-WNK1-KO mice was not different from that of WT mice (Fig. 7A). After feeding on high-Na+ diets (4% NaCl) for 2 weeks, the systolic blood pressure of KS-WNK-KO mice, however, was significantly elevated compared with WT mice (Fig. 7B, 144 ± 5 versus 132 ± 4mmHg, n = 6 each, P< 0.05).
Table 2.
Blood data of KS-WNK1-null mice (exon 4A knockout; 4A-KO) versus WT mice
| WT (n = 8) | 4A-KO (n = 8) | |
|---|---|---|
| Na (mm/l) | 140.9 ± 0.5 | 143.6 ± 0.4* |
| K (mm/l) | 4.25 ± 0.32 | 4.33 ± 0.24 |
| Cl (mm/l) | 115.6 ± 0.6 | 114.2 ± 0.5 |
| Ca (mm/l) | 1.05 ± 0.12 | 1.07 ± 0.12 |
| Mg (mm/l) | 0.42 ± 0.13 | 0.41 ± 0.09 |
| Creatinine (mg/dl) | 0.058 ± 0.011 | 0.070 ± 0.005 |
Values in mean ± SEM. Mice were on normal rodent diets.
*P < 0.05 4A-KO versus WT.
Figure 7.
Blood pressure in WT and KS-WNK1-KO mice in normal Na+ diets (0.49% NaCl) (A) or high-Na+ diets (4% NaCl) (B). The asterisk indicates P< 0.05 versus WT.
Renal Na+ retention in KS-WNK1-KO mice
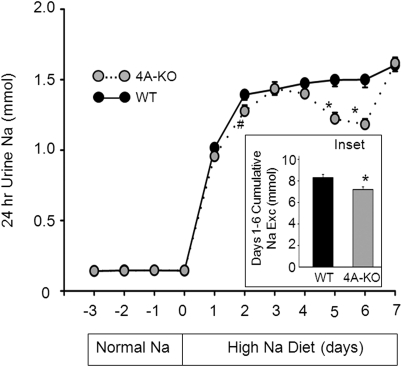
We carried out Na+ balance studies to examine renal handing of Na+ in KS-WNK1-KO mice. WT and KS-WNK1-KO mice (4A-KO) were first fed normal Na+ diets (0.49% NaCl) for 2 weeks to reach a steady state Na+ balance and then switched to high-Na+ diets (4% NaCl) to allow assessment of responses to high Na+ challenge. As shown in Figure 8, urinary Na+ excretion during the last 3 days of normal Na+ diets (approximate steady state) was not different between WT and KO mice. As expected, 24 h urinary Na+ excretion increased in response to increased Na+ intake. Because of the inherent variability in voiding and very high urinary Na+ concentration, the measured daily urinary Na+ excretion was quite variable from day to day and from animal to animal. Nonetheless, the results showed that increase in Na+ excretion was significantly less in the KO mice than in WT. The P-values for differences of daily Na+ excretion between WT and 4A-KO were 0.05 on day 2 (indicated by #) and <0.05 on days 5 and 6 (indicated by *). Differences of Na+ excretion between WT and 4A-KO can be further illustrated by examining the cumulative Na+ excretion from day 1 to 6 (Fig. 8, inset; 8.3 ± 0.3 and 7.2 ± 0.3 mm for WT and KO mice, respectively). These results indicate that KS-WNK1-KO mice reabsorbed more Na+ than WT mice in response to high dietary Na+ challenges. Urinary Na+ excretion measured at day 7 high-Na+ diets (Fig. 8) or longer (data not shown) was not different between WT and KO mice. This can be explained that in the steady state, higher blood pressure from Na+ retention in the KO mice (as shown in Fig. 7B) offsets the increase in tubular ability to reabsorb Na+ through the pressure-natriuresis effect.
Figure 8.
Urinary Na+ excretion in response to high-Na+ diets in KS-WNK1-KO and WT mice. Shown are Na+ excretion in KS-WNK1-KO mice (gray circles, n = 9, mean ± SEM) and WT mice (black circles = 9, mean ± SEM) under normal Na+ (0.49% NaCl; day −3 to −1) and high-Na+ diets (4% NaCl; day 1–7). On day 0, mice were switched from normal Na+ diets to high-Na+ diets. The asterisk and hash indicate P < 0.05 and P = 0.05 versus WT, respectively. Inset shows cumulative Na+ excretion from day 1 to 6 of high-Na+ diets.
Increased expression and phosphorylation of NCC and NKCC2 in the kidney of KS-WNK1-KO mice
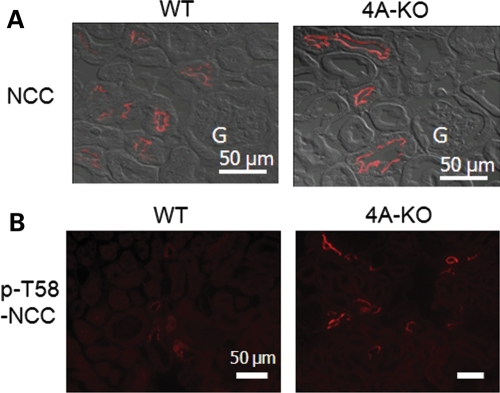
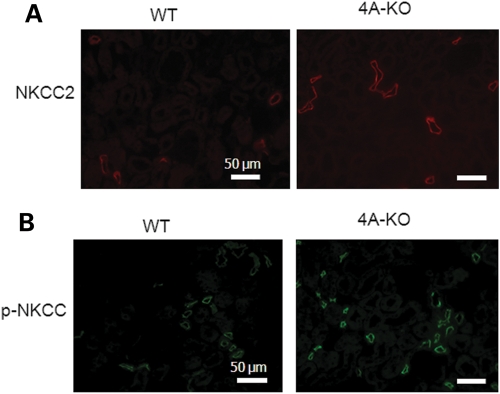
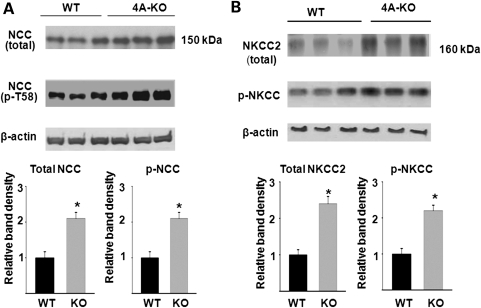
We further examined expression and phosphorylation of NCC in KS-WNK1-KO mice, using immunofluorescent staining. In opposite to that in KS-WNK1-TG mice, the abundance of NCC in DCT and phosphorylation of the transporter at T58 were both increased in KS-WNK1-KO mice compared with WT mice (Fig. 9A and B). Phosphorylation of NCC at T53 and S71 was also increased in the KO mice compared with WT mice (not shown). The abundance of NKCC2 and phosphorylation of the transporter were further examined in KS-WNK1-KO mice by immunofluorescent staining. The results showed that the total NKCC2 and phosphorylated NKCC2 in TAL were increased in KS-WNK1-KO mice compared with WT mice (Fig. 10A and B). Semi-quantitative western blot analysis confirmed that, compared with WT mice, KS-WNK1-KO mice had increased abundance of total and phosphorylated NCC and NKCC2 in the kidney cortex (Fig. 11).
Figure 9.
Immunofluorescent staining of NCC in WT and KS-WNK1-KO mice. (A) Immunofluorescence of NCC in the cortex of KS-WNK1-KO and WT mice. Fluorescent images were overlapped with differential interference contrast images to better illustrate subcellular distribution. Shown are microscopic images obtained using ×40 objective lens. Scale bar: 50 µm. ‘G’ indicates glomerulus. (B) Immunofluorescence of p-NCC (Thr 58) in KS-WNK1-KO and WT mice. Scale bar: 50 µm.
Figure 10.
Immunofluorescent staining of NKCC2 in WT and KS-WNK1-KO mice. (A) Immunofluorescence of NKCC2 in KS-WNK1-KO and WT mice. Scale bar: 50 µm. (B) Immunofluorescence of p-NKCC in KS-WNK1-KO and WT mice. Scale bar: 50 µm.
Figure 11.
Semi-quantitative western blot analysis of total and phosphorylated NCC (A) and NKCC2 (B) abundance in WT and KS-WNK1-KO (4A-KO) mice. Top panels are representative blots from three separate experiments (each experiment includes three control and three mutant mice). Lower panels summarize densitometric analysis of NCC, p-NCC, NKCC2, p-NKCC normalized to β-actin. Bar graph (mean ± SEM, n = 9 combined from three separate experiments) shows density relative to WT (i.e. WT = 1). The asterisk indicates P < 0.05 versus WT by two-tailed unpaired Student's t-test.
DISCUSSION
The goal of the present study is to examine the role of KS-WNK1 in the regulation of Na+ transport and blood pressure in vivo. We have previously produced TG mice overexpressing amino acids 1–253 of KS-WNK1 in the kidney and shown that these mice display the expected effect of KS-WNK1 on ROMK K+ channel and renal K+ transport (8,17). As this region of KS-WNK1 also plays a role in regulating NCC (24), we studied these TG mice and found that they had lower effective circulating volume and lower blood pressure and displayed decreased abundance of NCC and NKCC2 in DCT and TAL, respectively. It is possible that the results of TG mice were partly due to ectopic expression of KS-WNK1 in nephron segments that do not normally express the protein. To support that these findings in TG mice represent the in vivo function of the whole KS-WNK1 protein, we generated 4A-KO mice. We found that KO mice displayed the inverse phenotypes of TG mice, i.e. increased abundance of NCC and NKCC2, Na+ retention and elevated blood pressure in response to high Na+ challenges. These results provide compelling evidence to support the hypothesis that KS-WNK1 is a negative regulator of NCC and NKCC2 in vivo and plays an important role in the control of Na+ homeostasis and blood pressure.
How KS-WNK1 exerts the negative regulation on NCC and NKCC2 remains unknown. Early on, two studies reported that WNK4 inhibited NCC in Xenopus oocytes expression system (4,5). Subsequently, Yang et al. (18) reported that FL-WNK1 had no effect on NCC by itself but antagonized the inhibition on NCC by WNK4. Subramanya et al. (24) further showed that KS-WNK1 antagonized the ability of FL-WNK1 to reverse WNK4-mediated inhibition of NCC. The region of KS-WNK1 (amino acids 1–148) that antagonizes FL-WNK1 reported by Subramanya et al. is within amino acids 1–253 included in our TG mice. Thus, the negative regulation of NCC by KS-WNK1 may be through antagonizing the effect of FL-WNK1 on WNK4. Other potential mechanisms exist. In contrast to the report of WNK4 inhibition of NCC (4,5), several cell-based studies showed that both WNK1 and WNK4 stimulated NCC (10,11,25). The stimulation of NCC by WNK1 and WNK4 occurred via the phosphorylation and activation of the intermediate kinases OSR1 and/or SPAK, which in turn phosphorylated and activated NCC (10,11,25). With respect to the in vivo relevance of these findings, Yang et al. (26) found that knock-in mice carrying a gain-of-function PHA2 disease-causing Wnk4 allele had increased abundance of the total and phosphorylated NCC and increased abundance of phosphorylated OSR1 and SPAK (26). Conversely, Ohta et al. (27) reported that Wnk4 hypomorphic mice had Na+ wasting, hypotension and decreased abundance of total and phosphorylated NCC and of phosphorylated OSR1 and SPAK. More recently, Rafiqi et al. (28) showed that in knock-in mice in which phosphorylation sites of SPAK for WNK1 and 4 were mutated, the abundance of total and phosphorylated NCC was decreased. Together, these studies provide strong evidence supporting the importance of WNKs-OSR1/SPAK signaling cascade in the regulation of NCC in vivo (26–28). Thus, KS-WNK1 may antagonize the stimulation of NCC by FL-WNK1 (or WNK4) via OSR1 and SPAK. Future studies involving crossing KS-WNK1 TG or KO mice with mice lacking WNK1, WNK4, OSR1 and/or SPAK will address these questions.
The Na+-K+-2Cl− cotransporter NKCC1 and 2 and NCC belong to the same SLC12 gene family cation transporters (29). NCC and NKCC2 are main transporters for Na+ reabsorption in DCT and TAL, respectively. The binding and phosphorylation sites of NCC for OSR1 and SPAK are conserved in NKCC1 and 2 (19,30). In vitro and cell-based studies have shown that WNK1 and 4 phosphorylated and activated NKCC1 and 2 via OSR1 and SPAK as well as NCC (10–12,31). In the study using mutant SPAK knock-in mice, Rafiqi et al. (28) showed that phosphorylation of NKCC2 (besides NCC) was reduced, supporting that SPAK-mediated phosphorylation of NKCC2 stimulated by WNKs was important for renal Na+ transport and blood pressure control. Our current results support this conclusion. Moreover, our results provide the first in vivo evidence supporting the hypothesis that KS-WNK1 antagonizes the effect of WNKs on NCC and NKCC2 mediated through OSR1 and/or SPAK.
One interesting question for the hypothesis that WNK1 and WNK4 stimulate NCC and NKCC via OSR1 and SPAK is how phosphorylation by OSR1 and SPAK enhances Na+ transport in the kidney. In general, phosphorylation may alter intrinsic transport activity and/or trafficking and thus the cell surface expression of transporters. Previously, Pacheco-Alvarez et al. (32) showed that mutation of threonine-53, threonine-58 and serine-71 of rat NCC completely abolished functional activity of the transporter expressed in Xenopus oocytes (measured by thiazide-mediated 22Na+ uptake stimulated by intracellular Cl− depletion) without affecting its surface expression. These results suggest that phosphorylation of these residues is important for the activity of NCC. On the other hand, Mutig et al. (33) recently showed that the administration of arginine vasopressin (AVP) to vasopressin-deficient Brattleboro rats for 30 min increased the abundance of total NCC and phosphorylated NCC (measured by confocal immunofluorescence and immuno-gold electron microscopy using antibodies against threonine-53 and serine-71) in the luminal plasma membrane of DCT. The total tubular abundance of NCC measured by western blot analysis was unchanged. Thus, the short-term effect of vasopressin on NCC is by phosphorylation, and phosphorylation may increase apical trafficking of NCC. Pedersen et al. (34) also reported that acute AVP administration to Brattleboro rats increased threonine-53/threonine-58 phospho-NCC abundance in the apical membrane without altering the distribution and abundance of total NCC. Interestingly, Pedersen et al. also found that AVP increased the abundance of phospho-OSR1 and phospho-SPAK. Thus, phosphorylation of NCC may promote apical trafficking as well as activity of the protein.
With respect to the regulation of NCC and NKCC2 by WNKs-OSR1/SPAK kinase cascade in mice, Yang et al. (26) found that in PHA2 Wnk4 knock-in mice, serine-71-phosphorylated NCC (analyzed by immunofluorescent and electron microscopy) was highly localized to the apical membranes compared with total NCC. The authors suggested that the phosphorylation of NCC at serine-71 stimulated by WNK4-OSR1/SPAK was important for apical localization. Our present findings that the abundance of total and phosphorylated NCC (threonine-53, threonine-58 and serine-71) and the abundance of total and phosphorylated NKCC2 change in parallel in TG and KO mice and that phosphorylated transporters are concentrated near the apical membrane are consistent with this idea.
One earlier study reported that KS-WNK1 activated the ENaC in culture cells (35). It was also reported that aldosterone increased the transcript for KS-WNK1 (36), suggesting that KS-WNK1 may be a downstream target for aldosterone and contributing to Na+ retention via ENaC. Though we cannot exclude an aldosterone and KS-WNK1 interaction that may enhance renal Na+ retention under some (perhaps acute) settings, our present results using TG and KO mice provide compelling evidence that sustained changes in KS-WNK1 expression exert inverse effects on NCC and NKCC2 phosphorylation and apical abundance impacting renal Na+ reabsorption mediated by the transporters.
Results of our study also help the understanding of pathogenesis of PHA2 caused by WNK1 mutations. Wilson et al. (2) reported that PHA2 patients with large deletions of intron 1 of WNK1 gene have increased abundance of the transcript. How deletions of the first intron increase WNK1 transcript is not known. Furthermore, as the oligonucleotide primers used by Wilson et al. for real-time PCR analysis of transcript do not distinguish between full-length and KS-WNK1, the identity of WNK1 isoform increased in affected PHA2 patients remains elusive. Studies in expression system have shown that WNK1 stimulates Na+-reabsorptive transporters and inhibits K+-secretory channels (4–9), which would be expected to contribute to hypertension and hyperkalemia, respectively. Cell-based expression studies have also shown that KS-WNK1 antagonizes FL-WNK1 regulation of Na+ and K+ transport (8,24). These results suggest that FL-WNK1 is preferentially increased in PHA2 patients. A recent study by Delaloy et al. (37) reported that the first intron of mouse Wnk1 contains regulatory elements for full-length and KS-WNK1, and their deletion leads to increased expression of both full-length and KS-WNK1 in the mouse kidney. The increase of FL-WNK1 in mice deleted of the regulatory elements, however, is significantly more than the increase of KS-WNK1. Delaloy et al. further reported that the regulatory elements are conserved in humans and lie within the region of WNK1 deleted in PHA2 and suggested that overexpression of FL-WNK1 relative to KS-WNK1 in the kidney (rather than an increase in KS-WNK1) is responsible for the phenotypes of hypertension and hyperkalemia in PHA2. Our current finding that in vivo KS-WNK1 regulates Na+ transport inversely of FL-WNK1, together with the previous report on the in vivo role of KS-WNK1 on K+ secretion (17), supports this idea.
MATERIALS AND METHODS
Generation of mice with altered KS-WNK1 expression
TG mice overexpressing amino acids 1–253 of KS-WNK1 in the kidney have been described (17). Briefly, an ∼2.6 kb purified DNA fragment under the control of a KS Ksp cadherin promoter, Ksp-Flag-KS-WNK1(1–253), was microinjected into the pronuclei of fertilized oocytes. Fertilized oocytes were from C57BL/6 crosses. Microinjected embryos were transferred into the oviducts of pseudopregnant foster mothers and were permitted to develop to term. Founder mice were identified by PCR analysis of tail-clipped genomic DNA and mated with C57BL/6 WT mice to produce hemizygous offspring. Mice homozygous for TG KS-WNK1 (1–253) alleles from the crossing of hemizygous mice were used for experiments. These mice express ∼3-fold higher KS-WNK1 mRNA abundance than WT mice (17).
4A-KO mice were generated by targeted deletion of exon4A, the first and unique exon of the alternatively spliced KS-WNK1 transcript. Two ∼3 kb fragments flanking the exon4A were PCR-amplified from mouse genomic DNA, with restriction endonuclease sites added to their ends (SfiI/XhoI for the left arm, BamHI/XbaI for the right arm), and subcloned into OsDupDel targeting vector (gift of Dr L James and Dr O. Smithies) flanking a reverse-oriented neomycin (neo) resistance gene cassette. The targeting vector also contains a herpes virus thymidine kinase gene for negative selection with ganciclovir. Targeting construct was linearized and electroporated into 129/sv mouse embryonic stem cells. Culture and electroporation of ES cells and injection of ES cells into blastocysts were performed by the TG core facility of the University of Texas Southwestern Medical Center. Targeted ES cell clones were screened for homologous recombination by PCR. ES cell clones positive for targeted Wnk1 allele were expanded and injected into C57BL/6 blastocysts to generate chimera founders. Chimera male founders were backcrossed to 129/sv WT female mice to obtain pure 129/sv heterozygous KO mice. Heterozygous 129/sv KO mice were then intercrossed to generate homozygous KS-WNK1-KO mice in a pure 129/sv genetic background. The KO mice were genotyped by PCR using forward primer in the left arm (F1: 5′-aggatgtattgctattgtaggaga-3′) and reverse primer in the right arm (R1: 5′-cacacacatccatgtaagcataacaccaatg-3′).
Northern blot and RT-PCR analysis of FL- and KS-WNK1 transcript
Total RNA was extracted from homogenized mouse kidneys with TRIzol (Invitrogen), quantified by spectrophotometer and subjected (15 μg/lane) to 1.2% agarose-MOPS-formaldehyde gel electrophoresis. The gel was blotted to Hybond-N+ membrane (Amersham) overnight in 10X SSC and UV-cross-linked. The membrane was then prehybridized in Rapid-hyb buffer (GE Healthcare) for 4 h. The probes were labeled with 32P-dCTP (MP Biomedicals) and Ambion's DECAprime II random primed DNA labeling kit, using RT-PCR-amplified mWNK1 exon 4A and exon 6–9 as templates (15). The blots were hybridized overnight at 60°C and washed four times (last wash with 2X SSC, 0.2% SDS at 65°C) and exposed to film or phosphoimager. For RT-PCR, cDNA samples were made from total RNAs of the mouse kidney by the TaqMan RT kit (Applied Biosystems) and were subjected to PCR with forward and reverse primer sets named F2/R2 (300 nm) and F3/R3 (200 nm), respectively. The primer sets F2/R2 (F2: 5′-agaaactactagtagcaaaatccctgtc; R2: 5′-gcttcactccctcatttatacaatcc-3′) and F3/R3 (F3: 5′-ccggaattcatgcaggaggaaacaggggtacgg; R3: 5′-ccgctcgagcccagactctaccatttcttg-3′) amplify exon 4A and exons 6–7, respectively.
Blood pressure measurements
Blood pressure of mice was measured using a programmable tail-cuff sphygmomanometer (BP 2000-series II blood pressure monitor) (Visitech Systems Instrument, Apex, NC, USA). Mice were acclimated to restraint and repeated tail-cuff inflation for 30min/day for 3 days. Measurements were performed for 5–7 consecutive days, with at least 20 readings per day. Blood pressure was recorded and calculated as mean ± SEM.
Blood analyses
Blood for electrolyte analyses was drawn by retro-orbital bleeding into heparinized blood tubes under anesthesia with Avertin. Plasma was recovered by centrifugation. Plasma electrolytes were performed using STAT-CCC Analyzer (Nova Biomedical, Waltham, MA, USA). Plasma creatinine was measured by capillary electrophoresis (P/ACE MDQ) (Beckman Coulter, Brea, CA, USA) as described previously (17). Plasma aldosterone was measured by tandem mass spectrometry (38) on an Applied Biosystems Sciex API-5000 LC-MS/MS with a Shimadzu Prominece UFLC front-end equipped with a Phenomenex Kinetex 150 × 2.1 mm, 2.6 μm C18 column. The samples (∼50 μl of plasma) were mixed with 100pg of d6-aldosterone (Sigma), deproteinated with 0.4 ml of acetonitrile and centrifuged. The supernatant was diluted with 0.9 ml of water, and 1 ml was injected and resolved at 0.4 ml/min with a gradient of 50–80% methanol in water with 5 mm ammonium acetate. The column oven was maintained at 30°C, yielding a retention time for aldosterone of 6.0 min. Using electrospray ionization in negative ion mode, the transitions (m/z) monitored were 359 → 331 for aldosterone and 365 → 337 for d6-aldosterone. Plasma angiotensin II was measured using a commercial angiotensin II enzyme immunoassay kit per manufacturer's instruction (SPI-BIO, Massy, France).
Metabolic and balance studies
Mice (male and female, ∼4 months old) were fed indicated diets and placed in metabolic cages (Hatteras Instruments, Cary, NC, USA) for collection of urine. Low-Na+ (0.01% NaCl, g per 100 g diet), high-Na+ (4% NaCl) and control-Na+ (0.49% NaCl) diets were purchased from Harlan Teklad (Madison, WI, USA). The concentration of Na+ in urine was measured using a microflame-emission photometer (Jenway, Essex, UK). All of the experiments involving animals were performed in compliance with relevant laws and institutional guidelines and were approved by the University of Texas Southwestern Medical Center at Dallas Institutional Animals Care and Use Committee.
Immunofluorescent staining and semi-quantitative western blot analysis
Mice were anesthetized by Avertin and perfused via cardiac puncture with 15 ml of PBS followed by 15 ml of 4% paraformaldehyde in PBS. The kidneys were harvested and fixed for 4 h in 4% paraformaldehyde in PBS at 4°C, dehydrated by immersion in 30% sucrose in PBS overnight at 4°C and embedded in Tissue-Tek OCT compound (Sakura Finetck, Torrance, CA, USA) for sectioning. The sections (4–5 μm thickness) were stained with following primary antibodies: rabbit polyclonal anti-NCC (1:500), p-T58-NCC (1:250), p-T53-NCC (1:2000), p-S71-NCC (1:1500), NKCC2 (1:5000), sheep polyclonal antibodies p-NCC T58 (1:100) and p-NKCC (1:100), followed by secondary antibodies including Alexa Fluor goat anti-rabbit IgG 488 or 568 (1:500) or Alexa Fluor 488 donkey anti-sheep IgG (1:500). The fluorescent images were obtained using Zeiss LSM510 confocal microscope as described previously (17). For double-labeling immunofluorescent staining, primary antibodies from rabbit and sheep were first applied, and this was followed by anti-rabbit and anti-sheep secondary antibodies, respectively. Rabbit anti-T53, -T58 and -S71-NCC antibodies are gifts from Dr Shinichi Uchida (Tokyo Medical and Dental University, Japan); anti-NCC and anti-NKCC2 antibodies are gifts from Dr Mark Knepper (NIH, Bethesda, MA, USA); sheep anti-T58-NCC and anti-p-NKCC1 (pan anti-p-NKCC) antibodies are purchased from the University of Dundee, UK. For semi-quantitative western blot analysis, homogenized particulate fractions of the kidney cortex (26,27) from WT and TG mice (or KO mice) were analyzed using the same antibodies against NCC, p-T58-NCC, NKCC2 and p-NKCC as used in immunofluorescent staining.
Statistical analysis
Statistical comparisons between two groups of data were made using two-tailed unpaired Student's t-test. A P-value <0.05 was considered statistically significant.
SUPPLEMENTARY MATERIAL
Supplementary Material is available at HMG online.
FUNDING
This work was supported by grants from National Institutes of Health (DK-59530 to C.-L.H., UTSW O'Brien Center grant P30DK079328) and a Clinician Scientist Award in Translational Research from the Burroughs-Wellcome Fund (grant 1005954 to R.J.A.).
ACKNOWLEDGEMENTS
We thank Dr Leighton James for advice on the generation of KO mice; C. David Vance for plasma aldosterone measurement; Dr Michel Baum for comments on the manuscript; Drs Shinichi Uchida and Mark Knepper for antibodies. C.-L.H. holds the Jacob Lemann Professorship in Calcium Transport of the University of Texas Southwestern Medical Center.
Conflict of Interest statement. None declared.
REFERENCES
- 1.Xu B., English J.M., Wilsbacher J.L., Stippec S., Goldsmith E.J., Cobb M.H. WNK1, a novel mammalian serine/threonine protein kinase lacking the catalytic lysine in subdomain II. J. Biol. Chem. 2000;275:16795–16801. doi: 10.1074/jbc.275.22.16795. doi:10.1074/jbc.275.22.16795. [DOI] [PubMed] [Google Scholar]
- 2.Wilson F.H., Disse-Nicodème S., Choate K.A., Ishikawa K., Nelson-Williams C., Desitter I., Gunel M., Milford D.V., Lipkin G.W., Achard J.M., et al. Human hypertension caused by mutations in WNK kinases. Science. 2001;293:1107–1112. doi: 10.1126/science.1062844. doi:10.1126/science.1062844. [DOI] [PubMed] [Google Scholar]
- 3.Veríssimo F., Jordan P. WNK kinases, a novel protein kinase subfamily in multi-cellular organisms. Oncogene. 2001;20:5562–5569. doi: 10.1038/sj.onc.1204726. doi:10.1038/sj.onc.1204726. [DOI] [PubMed] [Google Scholar]
- 4.Yang C.L., Angell J., Mitchell R., Ellison D.H. WNK kinases regulate thiazide-sensitive Na-Cl cotransport. J. Clin. Invest. 2003;111:1039–1045. doi: 10.1172/JCI17443. [DOI] [PMC free article] [PubMed] [Google Scholar]
- 5.Wilson F.H., Kahle K.T., Sabath E., Lalioti M.D., Rapson A.K., Hoover R.S., Hebert S.C., Gamba G., Lifton R.P. Molecular pathogenesis of inherited hypertension with hyperkalemia: the Na-Cl cotransporter is inhibited by wild-type but not mutant WNK4. Proc. Natl Acad. Sci. USA. 2003;100:680–684. doi: 10.1073/pnas.242735399. doi:10.1073/pnas.242735399. [DOI] [PMC free article] [PubMed] [Google Scholar]
- 6.Yamauchi K., Rai T., Kobayashi K., Sohara E., Suzuki T., Itoh T., Suda S., Hayama A., Sasaki S., Uchida S. Disease-causing mutant WNK4 increases paracellular chloride permeability and phosphorylates claudins. Proc. Natl Acad. Sci. USA. 2004;101:4690–4694. doi: 10.1073/pnas.0306924101. doi:10.1073/pnas.0306924101. [DOI] [PMC free article] [PubMed] [Google Scholar]
- 7.Kahle K.T., Wilson F.H., Leng Q., Lalioti M.D., O'Connell A.D., Dong K., Rapson A.K., MacGregor G.G., Giebisch G., Hebert S.C., et al. WNK4 regulates the balance between renal NaCl reabsorption and K+ secretion. Nat. Genet. 2003;35:372–376. doi: 10.1038/ng1271. doi:10.1038/ng1271. [DOI] [PubMed] [Google Scholar]
- 8.Lazrak A., Liu Z., Huang C.L. Antagonistic regulation of ROMK by long and kidney-specific WNK1 isoforms. Proc. Natl Acad. Sci. USA. 2006;103:1615–1620. doi: 10.1073/pnas.0510609103. doi:10.1073/pnas.0510609103. [DOI] [PMC free article] [PubMed] [Google Scholar]
- 9.He G., Wang H.R., Huang S.K., Huang C.L. Intersectin links WNK kinases to endocytosis of ROMK1. J. Clin. Invest. 2007;117:1078–1087. doi: 10.1172/JCI30087. doi:10.1172/JCI30087. [DOI] [PMC free article] [PubMed] [Google Scholar]
- 10.Vitari A.C., Deak M., Morrice N.A., Alessi D.R. The WNK1 and WNK4 protein kinases that are mutated in Gordon's hypertension syndrome phosphorylate and activate SPAK and OSR1 protein kinases. Biochem. J. 2005;391:17–24. doi: 10.1042/BJ20051180. doi:10.1042/BJ20051180. [DOI] [PMC free article] [PubMed] [Google Scholar]
- 11.Moriguchi T., Urushiyama S., Hisamoto N., Iemura S., Uchida S., Natsume T., Matsumoto K., Shibuya H. WNK1 regulates phosphorylation of cation-chloride-coupled cotransporters via the STE20-related kinases, SPAK and OSR1. J. Biol. Chem. 2005;280:42685–42693. doi: 10.1074/jbc.M510042200. doi:10.1074/jbc.M510042200. [DOI] [PubMed] [Google Scholar]
- 12.Anselmo A.N., Earnest S., Chen W., Juang Y.C., Kim S.C., Zhao Y., Cobb M.H. WNK1 and OSR1 regulate the Na+, K+, 2Cl− cotransporter in HeLa cells. Proc. Natl Acad. Sci. USA. 2006;103:10883–10888. doi: 10.1073/pnas.0604607103. doi:10.1073/pnas.0604607103. [DOI] [PMC free article] [PubMed] [Google Scholar]
- 13.Xu B.E., Stippec S., Chu P.Y., Lazrak A., Li X.J., Lee B.H., English J.M., Ortega B., Huang C.L., Cobb M.H. WNK1 activates SGK1 to regulate the epithelial sodium channel. Proc. Natl Acad. Sci. USA. 2005;102:10315–10320. doi: 10.1073/pnas.0504422102. doi:10.1073/pnas.0504422102. [DOI] [PMC free article] [PubMed] [Google Scholar]
- 14.Delaloy C., Lu J., Houot A.M., Disse-Nicodeme S., Gasc J.M., Corvol P., Jeunemaitre X. Multiple promoters in the WNK1 gene: one controls expression of a kidney-specific kinase-defective isoform. Mol. Cell Biol. 2003;23:9208–9221. doi: 10.1128/MCB.23.24.9208-9221.2003. doi:10.1128/MCB.23.24.9208-9221.2003. [DOI] [PMC free article] [PubMed] [Google Scholar]
- 15.O'Reilly M., Marshall E., Speirs H.J., Brown R.W. WNK1, a gene within a novel blood pressure control pathway, tissue-specifically generates radically different isoforms with and without a kinase domain. J. Am. Soc. Nephrol. 2003;14:2447–2456. doi: 10.1097/01.asn.0000089830.97681.3b. doi:10.1097/01.ASN.0000089830.97681.3B. [DOI] [PubMed] [Google Scholar]
- 16.O'Reilly M., Marshall E., Macgillivray T., Mittal M., Xue W., Kenyon C.J., Brown R.W. Dietary electrolyte-driven responses in the renal WNK kinase pathway in vivo. J. Am. Soc. Nephrol. 2006;17:2402–2413. doi: 10.1681/ASN.2005111197. doi:10.1681/ASN.2005111197. [DOI] [PubMed] [Google Scholar]
- 17.Liu Z., Wang H.R., Huang C.L. Regulation of ROMK channel and K+ homeostasis by kidney-specific WNK1 kinase. J. Biol. Chem. 2009;284:12198–12206. doi: 10.1074/jbc.M806551200. doi:10.1074/jbc.M806551200. [DOI] [PMC free article] [PubMed] [Google Scholar]
- 18.Yang C.L., Zhu X., Wang Z., Subramanya A.R., Ellison D.H. Mechanisms of WNK1 and WNK4 interaction in the regulation of thiazide-sensitive NaCl cotransport. J. Clin. Invest. 2005;115:1379–1387. doi: 10.1172/JCI22452. [DOI] [PMC free article] [PubMed] [Google Scholar]
- 19.Richardson C., Alessi D.R. The regulation of salt transport and blood pressure by the WNK-SPAK/OSR1 signalling pathway. J. Cell Sci. 2008;121:3293–3304. doi: 10.1242/jcs.029223. doi:10.1242/jcs.029223. [DOI] [PubMed] [Google Scholar]
- 20.Delpire E., Rauchman M.I., Beier D.R., Hebert S.C., Gullans S.R. Molecular cloning and chromosome localization of a putative basolateral Na(+)-K(+)-2Cl− cotransporter from mouse inner medullary collecting duct (mIMCD-3) cells. J. Biol. Chem. 1994;269:25677–25683. [PubMed] [Google Scholar]
- 21.Payne J.A., Xu J.C., Haas M., Lytle C.Y., Ward D., Forbush B., III Primary structure, functional expression, and chromosomal localization of the bumetanide-sensitive Na-K-Cl cotransporter in human colon. J. Biol. Chem. 1995;270:17977–17985. doi: 10.1074/jbc.270.30.17977. doi:10.1074/jbc.270.30.17977. [DOI] [PubMed] [Google Scholar]
- 22.Kaplan M.R., Plotkin M.D., Brown D., Hebert S.C., Delpire E. Expression of the mouse Na-K-2Cl cotransporter, mBSC2, in the terminal inner medullary collecting duct, the glomerular and extraglomerular mesangium, and the glomerular afferent arteriole. J. Clin. Invest. 1996;98:723–730. doi: 10.1172/JCI118844. doi:10.1172/JCI118844. [DOI] [PMC free article] [PubMed] [Google Scholar]
- 23.He X., Tse C.M., Donowitz M., Alper S.L., Gabriel S.E., Baum B.J. Polarized distribution of key membrane transport proteins in the rat submandibular gland. Pflugers Arch. 1997;433:260–268. doi: 10.1007/s004240050276. doi:10.1007/s004240050276. [DOI] [PubMed] [Google Scholar]
- 24.Subramanya A.R., Yang C.L., Zhu X., Ellison D.H. Dominant-negative regulation of WNK1 by its kidney-specific kinase-defective isoform. Am. J. Physiol. Renal Physiol. 2006;290:F619–F624. doi: 10.1152/ajprenal.00280.2005. doi:10.1152/ajprenal.00280.2005. [DOI] [PubMed] [Google Scholar]
- 25.Richardson C., Rafiqi F.H., Karlsson H.K., Moleleki N., Vandewalle A., Campbell D.G., Morrice N.A., Alessi D.R. Activation of the thiazide-sensitive Na+-Cl− cotransporter by the WNK-regulated kinases SPAK and OSR1. J. Cell Sci. 2008;121:675–684. doi: 10.1242/jcs.025312. doi:10.1242/jcs.025312. [DOI] [PubMed] [Google Scholar]
- 26.Yang S.S., Morimoto T., Rai T., Chiga M., Sohara E., Ohno M., Uchida K., Lin S.H., Moriguchi T., Shibuya H., et al. Molecular pathogenesis of pseudohypoaldosteronism type II: generation and analysis of a Wnk4(D561A/+) knockin mouse model. Cell Metab. 2007;5:331–344. doi: 10.1016/j.cmet.2007.03.009. doi:10.1016/j.cmet.2007.03.009. [DOI] [PubMed] [Google Scholar]
- 27.Ohta A., Rai T., Yui N., Chiga M., Yang S.S., Lin S.H., Sohara E., Sasaki S., Uchida S. Targeted disruption of the Wnk4 gene decreases phosphorylation of Na-Cl cotransporter, increases Na excretion and lowers blood pressure. Hum. Mol. Genet. 2009;18:3978–3986. doi: 10.1093/hmg/ddp344. doi:10.1093/hmg/ddp344. [DOI] [PubMed] [Google Scholar]
- 28.Rafiqi F.H., Zuber A.M., Glover M., Richardson C., Fleming S., Jovanović S., Jovanović A., O'Shaughnessy K.M., Alessi D.R. Role of the WNK-activated SPAK kinase in regulating blood pressure. EMBO Mol. Med. 2010;2:63–75. doi: 10.1002/emmm.200900058. doi:10.1002/emmm.200900058. [DOI] [PMC free article] [PubMed] [Google Scholar]
- 29.Haas M., Forbush B., III The Na-K-Cl cotransporter of secretory epithelia. Annu. Rev. Physiol. 2000;62:515–534. doi: 10.1146/annurev.physiol.62.1.515. doi:10.1146/annurev.physiol.62.1.515. [DOI] [PubMed] [Google Scholar]
- 30.Delpire E., Gagnon K.B. SPAK and OSR1: STE20 kinases involved in the regulation of ion homoeostasis and volume control in mammalian cells. Biochem. J. 2008;409:321–331. doi: 10.1042/BJ20071324. doi:10.1042/BJ20071324. [DOI] [PubMed] [Google Scholar]
- 31.Gagnon K.B., Delpire E. On the substrate recognition and negative regulation of SPAK, a kinase modulating Na+-K+-2Cl−, cotransport activity. Am. J. Physiol. Cell Physiol. 2010;299:C614–C620. doi: 10.1152/ajpcell.00074.2010. [DOI] [PMC free article] [PubMed] [Google Scholar]
- 32.Pacheco-Alvarez D., Cristóbal P.S., Meade P., Moreno E., Vazquez N., Muñoz E., Díaz A., Juárez M.E., Giménez I., Gamba G. The Na+:Cl− cotransporter is activated and phosphorylated at the amino-terminal domain upon intracellular chloride depletion. J. Biol. Chem. 2006;281:28755–28763. doi: 10.1074/jbc.M603773200. doi:10.1074/jbc.M603773200. [DOI] [PubMed] [Google Scholar]
- 33.Mutig K., Saritas T., Uchida S., Kahl T., Borowski T., Paliege A., Böhlick A., Bleich M., Shan Q., Bachmann S. Short-term stimulation of the thiazide-sensitive Na+-Cl− cotransporter by vasopressin involves phosphorylation and membrane translocation. Am. J. Physiol. Renal Physiol. 2010;298:F502–F509. doi: 10.1152/ajprenal.00476.2009. doi:10.1152/ajprenal.00476.2009. [DOI] [PubMed] [Google Scholar]
- 34.Pedersen N.B., Hofmeister M.V., Rosenbaek L.L., Nielsen J., Fenton R.A. Vasopressin induces phosphorylation of the thiazide-sensitive sodium chloride cotransporter in the distal convoluted tubule. Kidney Int. 2010;78:160–169. doi: 10.1038/ki.2010.130. doi:10.1038/ki.2010.130. [DOI] [PubMed] [Google Scholar]
- 35.Náray-Fejes-Tóth A., Snyder P.M., Fejes-Tóth G. The kidney-specific WNK1 isoform is induced by aldosterone and stimulates epithelial sodium channel-mediated Na+ transport. Proc. Natl Acad. Sci. USA. 2004;101:17434–17439. doi: 10.1073/pnas.0408146101. doi:10.1073/pnas.0408146101. [DOI] [PMC free article] [PubMed] [Google Scholar]
- 36.Vinciguerra M. Aldosterone, but not increased Na+ influx or NF-kappaB activation, increases kidney-specific WNK1 gene expression in renal collecting duct cells. Horm. Metab. Res. 2009;41:67–70. doi: 10.1055/s-0028-1087208. doi:10.1055/s-0028-1087208. [DOI] [PubMed] [Google Scholar]
- 37.Delaloy C., Elvira-Matelot E., Clemessy M., Zhou X.O., Imbert-Teboul M., Houot A.M., Jeunemaitre X., Hadchouel J. Deletion of WNK1 first intron results in misregulation of both isoforms in renal and extrarenal tissues. Hypertension. 2008;52:1149–1154. doi: 10.1161/HYPERTENSIONAHA.108.120899. doi:10.1161/HYPERTENSIONAHA.108.120899. [DOI] [PubMed] [Google Scholar]
- 38.Guo T., Taylor R.L., Singh R.J., Soldin S.J. Simultaneous determination of 12 steroids by isotope dilution liquid chromatography-photospray ionization tandem mass spectrometry. Clin. Chim. Acta. 2006;372:76–82. doi: 10.1016/j.cca.2006.03.034. doi:10.1016/j.cca.2006.03.034. [DOI] [PubMed] [Google Scholar]
Associated Data
This section collects any data citations, data availability statements, or supplementary materials included in this article.


