

Abstract
Recent progress on a high-resolution, photon-counting gamma-ray and x-ray imager called BazookaSPECT is presented. BazookaSPECT is an example of a new class of scintillation detectors based on integrating detectors such as CCD(charge-coupled device) or CMOS(complementary metal-oxide semiconductor) sensors. BazookaSPECT is unique in that it makes use of a scintillator in close proximity to a microchannel plate-based image intensifier for up-front optical amplification of scintillation light. We discuss progress made in bringing about compact BazookaSPECT modules and in real-time processing of event data using graphics processing units (GPUs). These advances are being implemented in the design of a high-resolution rodent brain imager called FastSPECT III. A key benefit of up-front optical gain is that any CCD/CMOS sensor can now be utilized for photon counting. We discuss the benefits and feasibility of using CMOS sensors as photon-counting detectors for digital radiography, with application in mammography and computed tomography (CT). We present as an appendix a formal method for comparing various photon-counting integrating detectors using objective statistical criteria.
Keywords: BazookaSPECT detectors, Photon-counting integrating detectors, molecular imaging, columnar CsI(Tl), SPECT, GPGPU, GPU, high-performance computing, maximum likelihood, position estimation, Fisher information
1. INTRODUCTION
A new generation of CCD-based photon-counting detectors has stirred excitement in the gamma-ray imaging community, particularly in the context of small-animal, single-photon emission computed tomography (SPECT). Detectors having sub-100 μm resolutions and large space-bandwidth products have been developed in a variety of configurations.1–7
One such detector, developed at the Center for Gamma-Ray Imaging, utilizes a microchannel plate(MCP)-based image intensifier for up-front amplification of scintillation light. This approach goes by the somewhat whimsical title “BazookaSPECT” in part because the original device, developed for small-animal SPECT imaging applications, had a long optical system (see Figure 1). The name BazookaSPECT has persisted, even when the device is much shorter and is not used for SPECT imaging. An exploded view of the original BazookaSPECT detector is shown in Figure 1.
Figure 1.

An exploded view of the original BazookaSPECT detector. A scintillator is directly coupled to a second-generation 25-mm input/output diameter image intensifier. The intensifier has an S25 multialkalai photocathode and a P20 output phosphor. It contains a single MCP which provides a variable optical gain of 10,000–24,000. The CCD camera (left) is a DragonFly Express from Point Grey Research, Inc.8 containing a 1/3″ format, Kodak KAI-0340 sensor, 640 × 480 with 7.4 μm pixel pitch. The CCD operates up to 200 frames/second (full resolution) in 8-bit mode.
The key distinctive feature of BazookaSPECT in comparison to other configurations is that up-front optical gain from an MCP intensifier negates light loss in the optical path, thereby allowing any CCD/CMOS integrating detector to be utilized. This allows one to configure a detector for desired spatial resolution and counting-rate capability. The freedom to employ high-speed imaging sensors has led to the development of BazookaSPECT detectors capable of high-counting rates for applications in nuclear medicine, small-animal SPECT, and potentially, digital radiography.
In this paper we review the various approaches to achieving photon counting with integrating detectors and discuss system tradeoffs. We review the recent progress made with BazookaSPECT detectors in terms of reducing the size of the optical coupling system. This has led to the development of compact BazookaSPECT modules that facilitate the design of high-resolution stationary SPECT imagers. At high counting rates, collecting and processing image data in real time becomes non-trivial. We have made progress in utilizing graphics processing units (GPUs) and multi-core processors to achieve real-time acquisition and processing of event data at high counting rates, > 25, 000 counts per second per camera, for small-animal SPECT imaging. The combination of compact BazookaSPECT modules and high-speed event processing has enabled the development of FastSPECT III, a stationary high-resolution rodent-brain imager. FastSPECT III is currently undergoing system integration. We have recently recognized the benefits and feasibility of photon-counting digital radiography detectors based on ultra-fast (> 106 frames per second) BazookaSPECT technology. Finally, there is clearly a need for a framework for comparing the performance of various photon-counting integrating detectors. We present an appendix with a detailed noise analysis for BazookaSPECT and related configurations, and discuss the advantages of up-front gain and maximum-likelihood event estimation.
2. PHOTON-COUNTING WITH INTEGRATING DETECTORS
2.1 Photon-Counting with Columnar CsI(Tl)
Photon-counting with integrating detectors can use a variety of structured and thin monolithic scintillation materials. In our initial BazookaSPECT experiments, we used microcolumnar CsI(Tl). When a gamma-ray or x-ray photon interacts within a columnar CsI(Tl) scintillator, its energy is converted to optical photons with a peak spectral emission around 545 nm. Needle-like columns channel scintillation light towards an exit surface while restricting light spread in the lateral direction. SEM micrographs of columnar CsI(Tl) scintillators fabricated by Radiation Monitoring Devices, Inc.9 are shown in Figure 2. Emerging scintillation light can either be imaged directly onto a CCD or be subjected to an optical amplification process prior to being imaged onto a CCD/CMOS sensor. With the integrating detector operating at sufficiently high frame rates, individual interactions appear as signal spread over small pixel regions, which we call a cluster, as can been seen in Figure 3. The spatial resolution using integrating detectors is sufficient to detect separate clusters due to re-interacting cesium and iodine K X rays with typical mean ranges of 100–300 μm (see Figure 6b). These pixel values can be used as data from which to estimate the interaction location and energy of each event, just as with an Anger scintillation camera.
Figure 2.
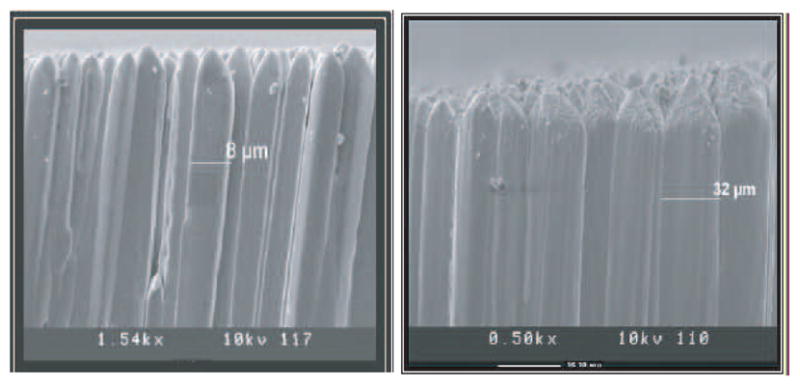
SEM micrographs of columnar CsI(Tl) show the fiber-optic like structure of the screens. The left image is 350-μm thick CsI(Tl) and the right image is 1500-μm thick CsI(Tl)9
Figure 3.
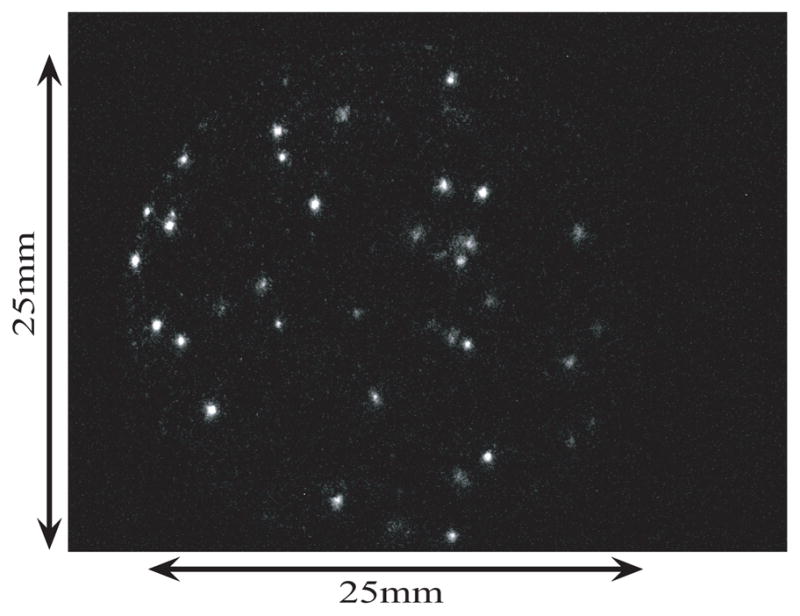
BazookaSPECT 99mTc gamma-ray interactions (~40) in 500 μm-thick RMD columnar CsI(Tl).
Figure 6.

Various configurations of photon-counting integrating detectors: (a) Photon-counting LumiSPECT2,12 with high-efficiency lens coupling. Scintillation light imaged onto a cooled, high-quantum-efficiency CCD reveals 140 keV (99mTc) gamma rays which are seen as individual clusters. (b) Photon counting with EMCCD-based integrating detectors. (c) Photon counting with a BazookaSPECT detector.
2.2 Frame Parsing
When the cluster size is small in comparison to the CCD/CMOS sensor, and the number of events per frame is small such that there is minimal overlap, individual gamma-ray/x-ray events can be identified and their associated pixel regions extracted. We refer to this process as frame parsing. One algorithm for frame processing uses the following steps:
A frame from the CCD is acquired.
A median filter is applied to remove hot/noisy pixels.
The filtered image is thresholded above the noise, and individual clusters are identified via a fast connected components labeling algorithm.10
Pixels corresponding to the identified clusters are extracted (e.g. 3 × 3 to 11 × 11 region of pixels).
Using the associated cluster pixels, the 2D/3D interaction location is estimated optimally using maximum-likelihood estimation.11
A visual demonstration of this algorithm is shown in Figure 4. As we shall discuss later, it can be implemented in real time with the use of graphics processing units (GPUs).
Figure 4.
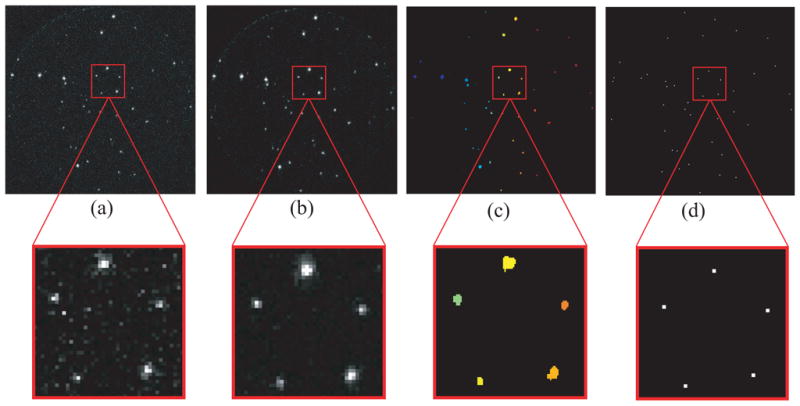
Data acquisition and processing algorithm: (a) Acquired photon-counting image, (b) median-filtered image to smooth data and remove noisy pixels, (c) filtered image with individual clusters identified using a connected components labeling algorithm10 (clusters identified by color), and (d) the estimated 2D γ-ray interaction positions. The position estimate, time stamp, summed pixels values, and all associated cluster pixels are concatenated and written to disk as a listmode11 event entry.
2.3 Maximum-Likelihood 3D Position and Energy Estimation
A limitation of columnar CsI(Tl) scintillators is that since the scintillator columns are not completely regular and are in partial contact with neighboring columns, they do not behave as high-quality fiber-optic light guides. As a consequence, there is non-negligible light spreading in the lateral direction and light loss that varies with depth. Both effects contribute to a depth-of-interaction (DoI) dependence which can substantially degrade both spatial and energy resolution, as well as limit the usable thickness for such scintillation screens. We have shown elsewhere6 that with maximum-likelihood (ML) 3D position and energy estimation methods, we can determine the DoI of individual gamma-ray interactions to correct for parallax errors associated with oblique gamma rays/X rays as well as recover better energy resolution.
As will be described, a variety of configurations and amplification processes are possible for achieving photon counting with integrating detectors. ML estimation provides a rigorous method for extracting the information content from detector signals and associated Fisher information methods can be used as a tool for comparing detector configurations. The appendix presents this analysis.
2.4 Photon-Counting Detector Configurations
As illustrated in Figure 5, depending upon the system, scintillation photons produced by the interacting gamma ray or X ray can be subject to variety of processes before finally being read out by the integrating detector.
Figure 5.

Signal formation in photon-counting integrating detectors: from emerging scintillation photons to image sensor detection.
2.4.1 Photon-Counting with Low-Noise, High-Quantum Efficiency CCDs
If scintillation light undergoes no optical amplification, but is simply imaged via lenses or a fiber-optic taper onto a low-noise, high-quantum-efficiency CCD, individual photon interactions can be observed.2 One example of a detector that operates in this configuration is the LumiSPECT12 gamma camera developed at the Center for Gamma-Ray Imaging (see Figure 6a). The primary disadvantage with this approach is that long read-out times associated with the sensor severely limit the counting-rate capability of the detector. Additionally, the system does not perform well with lower-energy isotopes such as 125I with 27–35 keV gamma rays, for example, because of the lower number of optical photons produced.
2.4.2 Photon-Counting with EMCCD Integrating Detectors
Another approach uses charge amplification within the CCD to achieve photon counting without any optical amplification of scintillation light. The internal gain provided by electron-multiplying CCDs (EMCCDs) makes possible low-noise performance at moderate frame rates, e.g. 512 × 512 sensors at ~30 fps. EMCCD photon-counting detectors have been studied by a number of groups, and they offer good spatial resolution (60–150 μm @ 30–140 keV) with some energy resolution.4–6,13 Figure 6b shows an RMD prototype EMCCD detector illuminated with a 57Co source.
High-resolution imaging systems that make use of EMCCDs also have some practical limitations. Frame rates of EMCCDs limit achievable event rates, and the direct coupling of the scintillator to the CCD means that detection area is limited to the size of the EMCCD, typically ≤ 1 cm2. Fiber-optic tapers can be used to increase the active area of the detector but at the cost of significant light loss with negative consequences for spatial resolution, energy resolution, and detection efficiency. The effect of this light loss is analyzed in detail in the appendix.
In order to increase detector area while maintaining high resolution, another approach utilizes an electrostatic de-magnifier (DM) tube coupled to an EMCCD.7 The DM tube (essentially a first-generation image intensifier) provides up-front optical amplification by converting scintillation photons to photoelectrons via a photocathode at the input face. Electrostatic focusing accelerates the photoelectrons towards a smaller-diameter output phosphor screen (demagnification process). The phosphor screen converts the photoelectrons back into optical photons, thereby resulting in an overall optical gain. The output screen of the DM tube is finally imaged onto an EMCCD via a fiber-optic taper or with lens coupling. In this configuration, the overall active area is increased, but count-rate performance is still limited by the EMCCD frame rate.
2.4.3 Photon-Counting with BazookaSPECT
BazookaSPECT has all the advantages of a system based on a DM tube, but much better count-rate capability. As in DM tube, scintillation photons are converted to photoelectrons via a photocathode. The key difference between the two intensifiers, however, is that with the insertion of a single or multiple microchannel plates, luminous gains ranging from 104–106 and higher can be achieved. Due to the substantial optical amplification, practically any CCD/CMOS sensor can be utilized as an integrating detector for photon counting. As sensors capable of frame rates > 106 begin to enter the market, BazookaSPECT will be able to utilize the technological advances.
3. DESIGN AND SIGNAL PROCESSING PROGRESS WITH BAZOOKASPECT IMAGERS
3.1 Compact BazookaSPECT Imagers
At CGRI, we have made progress in significantly reducing the size of the BazookaSPECT detector compared to the original design. This has been achieved with modification of the lens coupling system and has resulted in a compact BazookaSPECT detector as shown in Figure 7b,c. It has become feasible to incorporate multiple BazookaSPECT modules in stationary SPECT imagers such as the FastSPECT III discussed below.
Figure 7.

Evolution of the BazookaSPECT detector. (a) Original BazookaSPECT detector configuration using two lenses coupled in a × macro-photography configuration with a Spiratone 400 mm, F/6.3 telephoto lens and a Nikon 50 mm, F/1.2 lens to image a 25-mm diameter image intensifier onto a 1/3″ CCD. (b) Recently developed compact BazookaSPECT detector which uses a single, Fujinon 6mm, F/1.2 lens to image a 50-mm input/40-mm output image intensifier onto a 1/3″ CCD. (c) Compact BazookaSPECT detector using a Fujinon 6mm, F/1.2 lens to image a 25-mm diameter proximity focus, 2-MCP intensifier onto a 1/3″ CCD.
The initial versions of BazookaSPECT utilized a macro-photography lens coupling system (Figure 7a) to image the output screen of the image intensifier on to the CCD sensor. This configuration is valuable if the goal is to examine the clusters at high magnification, i.e., where the focal lengths of the two lenses are such that f1 ≥ f2. However, if the goal is to image the entire output screen of the intensifier onto the CCD/CMOS array, the lens configuration requires that the ratio of the focal lengths of the two lenses matches the needed magnification since m = f1/f2. For example, the configuration in Figure 7a uses a Spiratone 400 mm, F/6.3 telephoto lens and Nikon 50 mm, F/1.2 lens to image a 25-mm diameter output screen on to a 4.736 × 3.552 mm2 (640 × 480) sensor. Demagnification in this configuration is 8×.
We have found that we can image the entire output screen with a single lens by taking advantage of the up-front intensifier gain. By employing a fast (e.g. F/1.2) and short-focal-length (e.g. 6 mm) lens we are able to reduce the length of the system and image the entire output screen of larger diameter intensifiers with the addition of spacer rings. BazookaSPECT detectors utilizing this configuration are shown in Figure 7b,c. The configuration in Figure 7b has a second-generation image intensifier with a 50-mm diameter input window and a 40-mm diameter output face; the photocathode is S25; and the output phosphor is P43. The intensifier has a single microchannel plate and delivers a gain of up to 40,000. A single Fujinon 6 mm, F/1.2 lens is used in this system, and the CCD is the DragonFly Express8 described in Figure 1. The configuration in Figure 7c is composed of a two-MCP, proximity-focused image intensifier fabricated by Proxitronic Imaging GmbH.14 It has a multi-alkali photocathode, a P43 output phosphor, and 25-mm input/output windows. The gain of this intensifier is > 106. The same 6 mm, F/1.2 lens and DragonFly Express CCD are used in this configuration.
3.2 GPUs for High-Speed Frame Parsing and maximum-likelihood estimation
As emphasized earlier, up-front optical amplification from an MCP-based image intensifier allows imaging at fast frame rates with CMOS/CCD sensors. Consequently, we have detectors capable of high counting rates. For example, one of the first prototype BazookaSPECT detectors utilized a DragonFly Express8 camera, which is based on a 1/3″ format, Kodak KAI-0340 sensor, 640×480 pixels on a 7.4 μm pixel pitch. This CCD can operate at 200 frames per second at full resolution. With uniform illumination, more than > 25, 000 counts per second can be acquired with minimal overlap of clusters.1,15 At this frame rate, storing entire image frames to disk is not feasible, and so we implement the preprocessing step described in section 2.2 as frame parsing. This entails identifying, separating the clusters, and extracting only the pixels associated with events.
With heavy use of graphics processing units (GPUs) and multi-core processors, on a single computer we are currently able to frame parse data in real time from four BazookaSPECT detectors operating in parallel at 200 frames per second. In addition to frame parsing, GPUs can also be used event-parameter estimation and even tomographic reconstruction. We have previously shown that GPUs can be used for efficient ML estimation of event position and energy at speeds of 106 events per second and higher.16
3.3 FastSPECT III
The compact BazookaSPECT module and advances in real-time data acquistion/processing have enabled the development of a high-resolution, stationary, small-animal SPECT imager called FastSPECT III. FastSPECT III will serve as dedicated rodent brain imager and is undergoing final system integration. High-resolution SPECT imaging of the mouse/rat brain is of great interest for studying neurological pathologies, including Alzheimer’s and Parkinson’s disease. Many such studies have not been possible in the past due to the resolution limitations of current SPECT systems. FastSPECT III will provide SPECT imaging studies with isotropic linear resolutions ~250 μm.
Twenty compact BazookaSPECT modules will acquire projections of a spherical field of view with pinholes selected for desired resolution and sensitivity. With real-time processing capabilities of GPUs and multi-core processors, the twenty cameras will acquire and process data at 200 frames per second utilizing the algorithm described in section 2.2. The entire system will therefore have a counting rate capability of > 500, 000 counts per second. Additionally, the time stamp and cluster pixels for each event will be stored as listmode data for post processing and image reconstruction. The final design of FastSPECT III is shown in Figure 8.
Figure 8.

Design drawing for FastSPECT III. FastSPECT III is a multiple-pinhole SPECT system for rodent brain imaging at ultra-high spatial resolution (~ 250 μm). It uses 20 BazookaSPECT cameras of the type shown in Figure 7b. The tan ovals at the center are oblique views of two of the 5 cm-diameter columnar scintillation detectors. The size of FastSPECT III is about 60 cm on a side.
4. FEASIBILITY OF PHOTON-COUNTING DIGITAL RADIOGRAPHY AND COMPUTED TOMOGRAPHY
4.1 Benefits of a Photon-Counting Digital Radiography Detector
As emphasized earlier, up-front optical amplification provides BazookaSPECT with a crucial advantage by allowing the use of ultra-high-speed CMOS sensors capable of operation at thousands to potentially millions of frames per second. This capability suggests that CCD-based photon-counting detectors be considered for digital radiography (DR), and eventually, computed tomography (CT). A photon-counting digital radiography detector would provide several benefits over integrating detectors, including:
Be immune to readout noise (thresholded away)
Not suffer from problems with Swank noise or K reabsorption
Allow reduced patient dose
Have pure Poisson image statistics (conditional on a particular object)
Have sub-pixel spatial resolution
Not suffer resolution loss for oblique rays
Provide useful energy information17
A photon-counting DR detector does not suffer from inherent noise sources found in conventional detectors such as read noise. After individual x-ray photons are identified and their 2D or 3D position are estimated, the sensor read noise has been thresholded away, i.e., an image is generated whose pixels values correspond to the total number of incident x-ray photons for a given location. Additionally, Swank noise,18 a noise inherent in integrating detectors which results from variations in light output from the scintillation screen, is also negated for the same reasons just described.
At the expense of a lower x-ray collection efficiency and a higher dose, conventional integrating detectors utilize thin phosphors (20–100μm) for high resolution imaging; a thick scintillator would produce undesirable image blur. This is not the case, however, with a photon counting DR detector as individual x-ray photons are detectable even in thicker scintillators, such as 500 μm-thick columnar CsI(Tl) for example. The use of a thicker scintillator increases collection efficiency and thereby allows reduced patient dose without loss of contrast or spatial resolution.
The resultant data vector from an x-ray photon corresponds to small cluster of pixels, a 3 × 3 region for example. The cluster diameter as well as the associated pixel values vary depending on the x-ray energy ( ), the lateral 2D position interaction location (x, y), and the interaction depth (z) within the scintillator. Maximum-likelihood (ML) estimation provides a rigorous method for estimating these parameters (x, y, z, ) to improve both spatial and energy resolution. We have previously demonstrated this method in microcolumnar CsI(Tl).6 In order to further improve the spatial of the detector, 2D ML estimation can provide sub-pixel accuracy. 3D ML estimation also allows for correction of parallax errors caused by X rays incident at oblique angles.
Photon counting eliminates uncertainty about how many x-ray photons traversed the patient for each measurement and about the contribution of each to the final signal; energy information can be used to eliminate image artifacts and to optimally weight the photons in the final image for best task performance.17
4.2 Feasibility of Photon-Counting Mammography and Beyond
Photon counting with an integrating CCD/CMOS detector is possible in digital mammography. It can be accomplished utilizing commercially available high-speed CMOS sensors which operate at ultra-high frame rates using a pipeline architecture and multiple readout channels.
We demonstrate the conceptual feasibility for such a system by considering a Photon SA5 CMOS camera which operates up to 7,000 frames per second at 1024 × 1024 pixels with 20-μm pixel pitch. With a reasonable assumption of 0.01 mSv at 18 keV incident on the detector, this would lead to ~ 50, 000 photons/mm2. With a scintillator covering an area of 200 cm2 (e.g. 14×14 cm2) this would require collecting ~ 109 photons. Tiling the scintillator with four image intensifiers and four Photron19 SA5 CMOS cameras, the effective pixel size would be ~ 68 μm. Assuming 3 × 3 clusters, ~ 3, 000 x-ray photons per frame with minimal cluster overlap (< 10%) would be possible. At this rate, about 108 x-ray photons per second would be detected across the 4 sensors. It would therefore require ~ 10 seconds to complete the mammogram.
Beyond digital radiography, as CMOS sensors continue to increase in speed and decline in cost, and with compact BazookaSPECT modules, a CT system based on a ring of BazookaSPECT detectors is not implausible. Such a system would have 100–1000 times more effective pixels than conventional CT detectors. Compared to current commercial systems, the resolution would greatly increase, thereby greatly improving the detection of small lesions. An example imaging configuration for photon-counting, small-animal x-ray/CT system is shown in Figure 9.
Figure 9.

Imaging configuration for a photon-counting, small-animal x-ray/CT system.
4.3 Proof-of-Concept Experiment
As a proof of concept to demonstrate the feasibility of x-ray photon counting with BazookaSPECT, we utilized a high-speed CMOS sensor capable of continuous readout at tens of thousands of frames per second. The image intensifier used has a 50-mm diameter input window (see Figure 7b) with an 80 μm-thick x-ray scintillator (Lanex) directly coupled to it. The high-speed CMOS sensor is a Photron19 SA1 CMOS detector. For the proof-of-concept experiment, we acquired image data over a region of 256 × 256 pixels at 67,500 frames per second. A photon-counting frame is shown in Figure 10. Operation at this frame rate and with a few hundred x-ray photons per frame would allow for > 107 counts per second with an acceptably small probability of overlap. Overlap events are identifiable in BazookaSPECT frames from the shape and amplitude of the cluster, and thus may be rejected. It is even possible to recover many overlap events from a knowledge of mean single-event clusters and maximum likelihood estimation techniques.15
Figure 10.
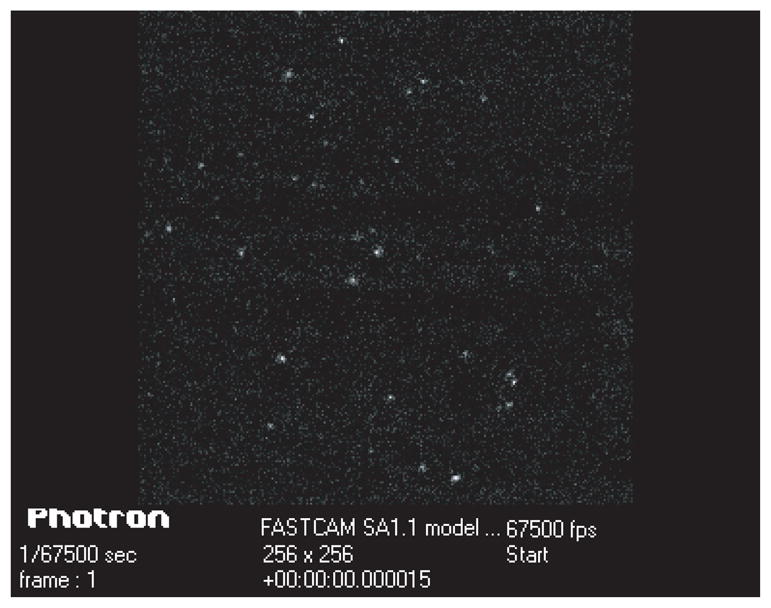
BazookaSPECT image frame taken with a Photron19 SA1 CMOS detector operating at 67,500 frames per second. The data was taken in the following configuration: 57Co source illuminating a 50-mm diameter image intensifier and an 80 μm-thick Lanex screen.
5. SUMMARY AND CONCLUSIONS
Photon-counting scintillation detectors based on CCD/CMOS sensors represent a new class of high-resolution imagers with application in nuclear medicine, small-animal SPECT, and digital radiography. These detectors have been built and tested in a variety of configurations. We have found that overall detector performance, in terms of counting-rate capability and effective detector area, is increased when scintillation light is subject to up-front optical gain. In BazookaSPECT detectors, scintillation light is amplified with MCP-based image intensifiers that provide luminous gains ranging from 104–106 or greater. Consequently, any CCD/CMOS sensor can be utilized for photon counting with detector counting-rate capabilities limited only by frame rates. CMOS sensors which operate at ultra-high frame rates (> 106) have prompted the investigation of BazookaSPECT detectors for digital radiography, with application in mammography and CT. High-performance computing with graphics processing units(GPUs) and multi-core processors enable real-time event detection and parameter estimation at high counting rates. Finally, we present as an appendix an objective method for comparing system configurations based on optimal maximum-likelihood estimation and the associated Fisher information.
Acknowledgments
The authors would like to thank Dr. Vivek Nargarkar of Radiation Monitoring Devices, Inc. (RMD) for providing CsI(Tl) columnar scintillators and other assistance. This work is supported by NIH Grant P41-EB002035-5.
Appendix: Statistical analysis of CCD/CMOS-based scintillation cameras
The objective of this appendix is to provide a unified statistical analysis of BazookaSPECT and other scintillation cameras that use integrating detectors such as CCD or CMOS cameras at fast frame rates, where the integrating detector functions in a photon-counting mode.
After the use of frame parsing to segment a cluster of M pixels for a single scintillation event, we obtain a set of pixel values {gm, m = 1, 2, …M} for that event. We can also think of this data set as an M × 1 data vector g, from which we wish to estimate the lateral position (x, y) of the gamma-ray event, its depth of interaction z and its energy . We assume here that maximum-likelihood estimation (MLE) will be used and that performance of the detector will be assessed by the Cramèr-Rao bound on the parameter estimates. For background on MLE, see Barrett and Myers,20 and for a review of its application to scintillation cameras, see Barrett et al.11
A likelihood is the probability density function (PDF) of the data conditional on the parameters to be estimated, pr(g|θ), where in the present discussion θ is the 4×1 vector (x, y, z, )t, with the superscript t denoting transpose. The significant noise sources that need to be modeled in this PDF are the random production of optical photons in the scintillator and the consequent random production of photoelectrons; dark current; random variations of the gain in the image intensifier or EMCCD; and the readout noise on the output of the CCD or CMOS detector.
It is a good assumption that the number of optical photons, Nopt, is a Poisson random variable and that its mean, N̄opt, depends on but not on the interaction location (x, y, z). If we also assume that the scintillator responds linearly to the gamma-ray energy deposited in it, we can write
| (A.1) |
with A being a known constant. With the Poisson assumption, the variance of Nopt equals its mean.
If the optical photons are Poisson-distributed, so are the resulting photoelectrons.20 The photoelectrons are produced on a continuous photocathode (or slab of silicon in the EMCCD cameras), but we can consider a pixel array defined by the discretization of the final readout. The mean number of electrons generated in the mth such pixel is given by
| (A.2) |
where
is the mean number generated in the dark by thermal excitation and AηQE is the mean number generated by the scintillation flash. Here, ηm(x, y, z) is the fraction of optical photons that reach pixel m and ηQE is the quantum efficiency of the photocathode, presumed independent of m. Again, the variance of nm equals its mean. Moreover, nm and nm′ are statistically independent for m ≠ m′.
For the detectors considered here, there is a random gain process following the conversion of optical photons to photoelectrons. We can write the mean of the final pixel value gm as
| (A.3) |
where Ḡ is the overall mean gain, including the effect of all components between the photon-to-electron conversion and the final readout.
To obtain the variance of gm, we must consider both the variance of the gain and the additional readout noise that can be added after the gain process. By the Burgess variance theorem,20 we find that the variance, conditional on the interaction location and energy, is given by
| (A.4) |
where Var G is the variance of the gain and σ2 is the variance of the readout noise, both assumed independent of m.
If the amplified signal from one gain channel does not influence the signal on an adjacent channel, then the covariance matrix for g, denoted K, is diagonal. In the Bazooka configuration, this means that the pixel size, defined by the elements of the CMOS camera, is larger than the blur introduced by the optics between the intensifier output and the CMOS camera. In that case, the elements of K are given by
| (A.5) |
where
| (A.6) |
In practice, the excess noise factor 1 + α ≈2 for both image intensifiers and EMCCDs.
All of the detectors under consideration here have a large gain ahead of the readout noise, so it is reasonable to neglect σ2, in which case
| (A.7) |
We are now in a position to construct the likelihood function. If we approximate the Poisson distribution for nm by a Gaussian and assume that both the gain noise and the readout noise are Gaussian, we have
| (A.8) |
With a bit of algebra, the corresponding log-likelihood becomes
| (A.9) |
where C is a constant, independent of the parameters to be estimated.
The score, denoted s, is a 4 × 1 random vector with components given by
| (A.10) |
with θ1 = x, θ2 = y, θ3 = z, and θ4 = . Specifically, for our log-likelihood,
| (A.11) |
The maximum-likelihood estimate of θ, denoted θ̂, is found by iteratively searching for the θ where all four components of the score vanish, or equivalently, directly maximizing the log-likelihood in the 4D parameter space. This step can be carried out on GPUs as discussed by Hesterman et al.16
The Fisher information matrix is the covariance matrix of the score. The score can be shown from (A.11) to have zero mean, so
| (A.12) |
The expectation can be performed by use of (A.5) and properties of Gaussian random variables. The result is
| (A.13) |
With (A.3) and (A.5), however, we can also write
| (A.14) |
We note that the first term is small compared to the second one if the total number of electrons, , is much larger than unity, as it surely must be in any practical system. Thus, finally,
| (A.15) |
The main use of the Fisher information matrix is to compute the Cramèr-Rao bound (CRB), which shows that the variance of the estimate θ̂j satisfies
| (A.16) |
An unbiased estimate for which this inequality becomes an equality is said to be efficient. An important theorem states that, in any estimation problem, the maximum-likelihood estimator is efficient if an efficient estimator exists. Moreover, even if no efficient estimator exists, the MLE is asymptotically unbiased and efficient as more independent data are acquired. In the context of this paper, that means that more photoelectrons are produced by each gamma-ray interaction. This key result provides a powerful incentive for using ML estimation and for collecting as much light as possible.
Detailed evaluation of the CRB, based on simulation of n̄m(x, y, z, ) and extensive numerical computations, will be published separately, but some important conclusions can be drawn immediately from (A.15). First, it is seen that Ḡ has disappeared; the gain does not matter so long as it is large enough to override the readout noise. Second, the gain noise reduces the Fisher information by a factor of 1 + α and increases the CRB by the same factor.
Third, the dark current (in the intensifier photocathode or the EMCCD) increases the denominator n̄m(x, y, z, ) in the Fisher information matrix elements [see (A.15)] without correspondingly increasing the derivatives ∂n̄m(x, y, z, )/∂θj. Thus the Fisher information is reduced and the CRB is increased by dark current. In an EMCCD, the dark current can be reduced by cooling, and in an image intensifier it can be reduced by choosing a photocathode with little response in the red or infrared part of the spectrum. In BazookaSPECT, dark current in the CMOS detector is unimportant because it occurs after the gain stage. When dark current is significant, however, MLE becomes even more important in making optimum use of the available data; the structure of the Fisher information matrix in (A.15) shows that pixels where the dark current is comparable to or greater than the optically produced current have relatively low information content, and the ML estimator automatically weights these pixels less.
Finally, (A.15) reveals that it is crucially important to make the number of photoelectrons as large as possible, which means collecting as many optical photons as possible and having a high quantum efficiency for converting the photons to photoelectrons. Optical imaging systems that demagnify the scintillator onto the CCD or CMOS sensor, either with a lens or a fiberoptic taper, are at an immediate, large disadvantage because the collection efficiency varies as (magnification)2. This disadvantage is avoided in the Bazooka geometry if the image intensifier is the same size as the scintillator, and it is also avoided in the geometry described by Meng7 where the demagnification is after the conversion of the light to electrons. Thus, the noise properties of the raw data in the system described by Meng7 are similar to those of Bazooka, but taking advantage of the low noise requires ML estimation, which is not used by Meng.7 Moreover, the Bazooka geometry, offers an additional advantage, compared to Meng,7 in that it can use very fast CMOS sensors rather than EMCCDs, resulting in a much higher count-rate capability.
References
- 1.Miller B, Barber H, Barrett H, Wilson D, Chen L. A low-cost approach to high-resolution, single-photon imaging using columnar scintillators and image intensifiers. Nuclear Science Symposium Conference Record, 2006. IEEE. 6:3540–3545. (29 2006-Nov. 1 2006) [Google Scholar]
- 2.Miller BW, Barber HB, Barrett HH, Chen L, Taylor SJ. Medical Imaging 2007: Physics of Medical Imaging. 1. Vol. 6510. SPIE; 2007. Photon-counting gamma camera based on columnar CsI(Tl) optically coupled to a back-illuminated CCD; p. 65100N. [DOI] [PMC free article] [PubMed] [Google Scholar]
- 3.Miller B, Barrett H, Furenlid L, Bradford Barber H, Hunter R. Recent advances in BazookaSPECT: Real-time data processing and the development of a gamma-ray microscope. Nuclear Inst and Methods in Physics Research, A. 2008;591(1):272–275. doi: 10.1016/j.nima.2008.03.072. [DOI] [PMC free article] [PubMed] [Google Scholar]
- 4.Beekman FJ, Vastenhouw B. Design and simulation of a high-resolution stationary SPECT system for small animals. Physics in Medicine and Biology. 2004;49(19):4579–4592. doi: 10.1088/0031-9155/49/19/009. [DOI] [PubMed] [Google Scholar]
- 5.Nagarkar V, Shestakova I, Gaysinskiy V, Singh B, Miller B, Bradford Barber H. Fast X-ray/γ-ray imaging using electron multiplying CCD-based detector. Nuclear Inst and Methods in Physics Research, A. 2007;563(1F):45–48. [Google Scholar]
- 6.Miller B, Barber H, Barrett H, Shestakova I, Singh B, Nagarkar V, Incorporated R. Single-photon spatial and energy resolution enhancement of a columnar CsI(Tl)/EMCCD gamma-camera using maximum-likelihood estimation. 2006;6142:61421T–1. [Google Scholar]
- 7.Meng L. An Intensified EMCCD Camera for Low Energy Gamma Ray Imaging Applications. Nuclear Science, IEEE Transactions on. 2006 Aug;53:2376–2384. doi: 10.1109/TNS.2006.878574. [DOI] [PMC free article] [PubMed] [Google Scholar]
- 8.Point Grey Research, Inc. http://www.ptgrey.com/
- 9.Miller SR, Gaysinskiy V, Shestakova I, Nagarkar VV. Recent advances in columnar CsI(Tl) scintillator screens. Penetrating Radiation Systems and Applications VII. 2005;5923(1):59230F. [Google Scholar]
- 10.Suzuki K, Horiba I, Sugie N. Fast connected-component labeling based on sequential local operations in the course of forward raster scan followed by backward raster scan. Pattern Recognition, 2000. Proceedings. 15th International Conference on 2; 2000. pp. 434–437. [Google Scholar]
- 11.Barrett H, Hunter W, Miller B, Moore S, Chen Y, Furenlid L. Maximum-likelihood methods for processing signals from gamma-ray detectors. Nuclear Science, IEEE Transactions on. 2009 June;56:725–735. doi: 10.1109/tns.2009.2015308. [DOI] [PMC free article] [PubMed] [Google Scholar]
- 12.Taylor SJ. Master’s thesis. University of Arizona, Deparment of Optical Sciences; Tucson, Arizona: 2004. Dual Modality Imaging With a Lens-Coupled CCD Camera. [Google Scholar]
- 13.Teo B, Shestakova I, Sun M, Barber W, Hasegawa B, Nagarkar V. Evaluation of a EMCCD detector for emission-transmission computed tomography; Nuclear Science Symposium Conference Record, 2005 IEEE; Oct, 2005. pp. 3050–3054. [Google Scholar]
- 14.Proxitronic Imaging GmbH. http://www.proxitronic.de/imaging/
- 15.Furenlid L, Clarkson E, Marks D, Barrett H. Spatial pileup considerations for pixellated gamma-ray detectors. Nuclear Science, IEEE Transactions on. 2000 Aug;47:1399–1403. doi: 10.1109/23.872985. [DOI] [PMC free article] [PubMed] [Google Scholar]
- 16.Hesterman JY, Caucci L, Kupinski MA, Barrett HH, Furenlid LR. Maximum-likelihood estimation with a contracting grid search algorithm. Nuclear Science, IEEE Transactions. 2009 doi: 10.1109/TNS.2010.2045898. submitted. [DOI] [PMC free article] [PubMed] [Google Scholar]
- 17.Tapiovaara M, Wagner R. SNR and DQE analysis of broad spectrum x-ray imaging. Phys Med. 1985 [Google Scholar]
- 18.Swank R. Absorption and noise in x-ray phosphors. Journal of Applied Physics. 1973;44:4199. [Google Scholar]
- 19.Photron, Inc. http://www.photron.com/
- 20.Barrett H, Myers K. Foundations of Image Science. John Wiley and Sons; 2004. [Google Scholar]