Abstract
Although practiced clinically for over 40 years, the use of hematopoietic stem cell (HSC) transplants remains limited by the ability to expand these cells ex vivo. An unbiased screen with primary human HSC identified a purine derivative, StemRegenin 1 (SR1), that promotes the ex vivo expansion of CD34+ cells. Culture of HSC with SR1 led to a fifty-fold increase in cells expressing CD34, and a 17-fold increase in cells that retain the ability to engraft immunodeficient mice. Mechanistic studies show that SR1 acts by antagonizing the aryl hydrocarbon receptor (AhR). The identification of SR1 and AhR modulation as a means to induce ex vivo HSC expansion should facilitate the clinical use of HSC therapy.
The identification of pharmacological agents that control adult or embryonic stem cell fate has the potential to facilitate the application of stem cell therapies to a host of diseases (1). Among the best characterized adult stem cells are hematopoietic stem cells (HSC) (2). Although HSC are widely used, their full clinical potential has yet to be realized due to lack of defined culture conditions for their expansion (3). This is especially true of allogeneic HSC transplants where only 50% of candidates can find a HLA-matched adult donor (4). The use of cord blood (CB)-derived HSC is an alternative, since the large number of banked CB units greatly facilitates finding an HLA matched graft (5). However, the low number of HSC in these units has largely restricted the widespread application of CB HSC to the pediatric setting (6). To overcome this limitation, clinicians are transplanting CB units from two donors with encouraging preliminary results (7), which suggests that even a 2-fold increase in HSC number would significantly impact HSC transplantation. Thus, identification of molecules that expand HSC during ex vivo culture has remained an important goal of the field.
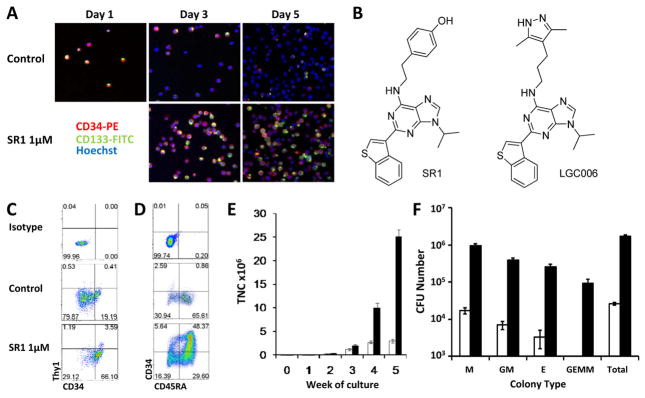
Culture conditions optimized for HSC expansion (serum free media supplemented with thrombopoietin, stem cell factor, flt3 ligand, and interleukin-6; referred to as “cytokines” hereafter) (8) result in robust proliferation accompanied by differentiation leading to loss of HSC activity. This differentiation can be followed by the loss of the cell surface proteins CD34 and CD133 which are expressed on HSC and progenitor cells (Fig. 1A) (9). Thus, to identify molecules that promote HSC expansion, we developed an assay that uses primary human CD34+ cells from the blood of mobilized donors (10) and evaluated CD34 and CD133 expression by confocal microscopy following a 5 day culture (Fig. 1A). Using this assay we screened a library of 100,000 heterocycles (11) and identified a purine derivative (SR1, Fig. 1B) that increases the number of CD34+ cells after 5 to 7 days with an EC50 of ~120 nM (Fig. 1A, fig. S1, and table S1). A structure-activity-relationship study of a 2,6,9-substituted purine library based on SR1 was analyzed. Representative analogs and their EC50 values are provided in the supporting information (figs. S2 to S4).
Fig. 1.
SR1 maintains an HSC phenotype and increases CFU content. (A) Expression of CD34 and CD133 in cultured mPB CD34+ cells. (B) Structure of SR1 and LGC006. (C) Phenotype of CD34+ mPB at 7 days or (D) CB at 35 days. (E) Weekly TNC counts from control (white bars) or SR1 (1 μM, black bars) cultures of 1,000 CB CD34+ cells. (F) Total CFU content of control (white bars) or SR1 (1 μM, black bars) cultures of 1000 CB CD34+ cells at 5 weeks.
Culture of mPB CD34+ cells with cytokines plus SR1 (hereafter refered to collectively as SR1, unless noted as SR1 alone) for 7 days increased the number of CD34+, CD133+, and CD90+ hematopoietic stem and progenitor cell populations 2.6-, 2.3-, and 10-fold, respectively (Fig. 1C, fig. S5A, and table S1) compared to control cells (defined as cultures with cytokines plus vehicle [DMSO, ≤0.01%]). Continued culture with SR1 for 3 weeks led to an 11-fold increase in total nucleated cells (TNC), a 73-fold increase in CD34+ cells as compared to control cultures, and a 1118-fold increase in CD34+ cells relative to input cells (fig. S5B and table S2). Removal of SR1 led to rapid differentiation indicating that the effect of SR1 is reversible (fig. S6). SR1 in the absence of cytokines did not induce proliferation, and at concentrations above 1 μM SR1 treatment is anti-proliferative (fig. S7). Culture with SR1 had no effect on murine HSC, but did expand CD34+ cells from bone marrow of humans, monkeys (cynomolgus and rhesus) and dogs (fig. S7). SR1 also maintains CB precursors at a less differentiated stage (Fig. 1D). Culture of human CB CD34+ cells for 5 weeks with SR1 resulted in a 17,100-fold expansion compared to input cells, a 10-fold increase in TNC, and a 47-fold increase in CD34+ cells and CD34+ subpopulations (e.g., CD34+CD45RA− enriched in HSC and multilineage progenitor cells) compared to control cells (Fig. 1, D and E, and table S3A).
We next determined if the increase in the number of CD34+ cells results from symmetric division using the cell division monitoring dye carboxyfluorescein succinimidyl ester (CFSE). After 7 days the cells had undergone 6–9 divisions regardless of the presence of SR1, indicating that SR1 does not affect the division rate (fig. S8, A and B). SR1 treated cells retained high levels of CD34 expression (66 to 76%) whereas cells cultured with cytokines alone lost CD34 expression (14 to 31%) (fig. S8C). Thus SR1 promotes the retention of CD34 expression following ex vivo culture.
SR1 also expands the number of colony forming cells (CFU). Culture of 1,000 CB CD34+ cells for 5 weeks with SR1 resulted in the production of 169 × 104 CFU, a 65-fold increase compared to control cells and a >9500 fold increase over input cells (Fig. 1F and table S3B). This includes increases in the number of single lineage myeloid (M, 55-fold), erythroid (E, 129-fold), and bipotential granulocyte/monocyte (GM, 55-fold) colonies. Multilineage granulocyte, erythroid, monocyte, and megakaryocyte (GEMM) colonies were only found in the SR1 expanded cells, suggesting that SR1 promotes the expansion of early multipotent progenitors.
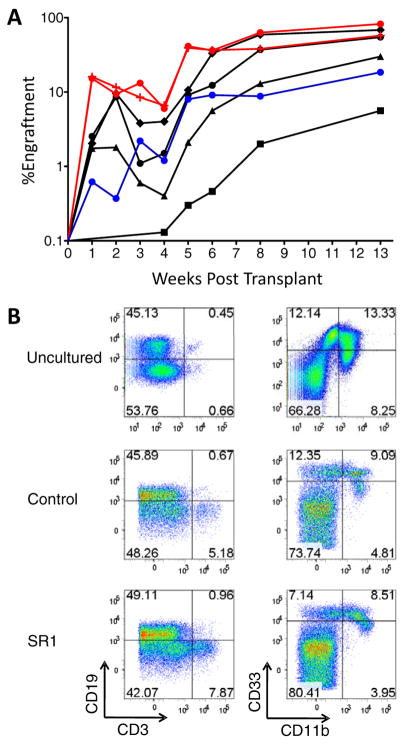
Next, we asked whether SR1 expanded CB CD34+ cells engraft NOD.Cg-Prkdcscid Il2rgtm1Wjl/SzJ (NSG) mice (12). Human cells capable of hematopoietic reconstitution in these mice are termed NOD-SCID repopulating cells (SRC) and represent candidate human HSC. 250,000 CB CD34+ cells were cultured 3 weeks with control conditions (1080-fold expansion) or SR1 (2024-fold expansion) (table S4). 300 to 30,000 uncultured CB CD34+ cells, or a fraction of the final culture equivalent to 300 to 10,000 starting cells, were transplanted into NSG mice (see fig. S9 for cell surface phenotype). CB CD34+ cells cultured with SR1 generated significant increases in human engraftment in the peripheral blood at one week compared to mice transplanted with 10,000 uncultured cells (6-fold, p < 0.05) or the progeny of 10,000 control cells (24-fold, p < 0.05) (Fig. 2A). The progeny of 300 CB CD34+ cells expanded with SR1 generated the same level of sustained engraftment as 10,000 uncultured CB CD34+ cells and a 4-fold increase in human engraftment compared to control cells at 8 weeks in the peripheral blood and 13 weeks in the bone marrow (BM) (Fig. 2A and fig. S10, A and B). These results demonstrate that SR1 promotes expansion of CB CD34+ cells that contribute to both early and sustained engraftment. The distribution of human B, T, and myeloid cells in BM, spleen and thymus was similar for all groups (Fig. 2B and figs. S11, A to C, and S12). These data demonstrate that CB CD34+ cells expanded with SR1 retain multilineage potential.
Fig. 2.
Culture of CB CD34+ cells with SR1 enhances early and late engraftment. (A) Mice were injected with 1000 (black squares), 3000 (black triangles), 10,000 (black circles), or 30,000 (black diamonds) uncultured CB CD34+ cells; or a fraction of the final culture equivalent to the progeny of CB CD34+ cells cultured for 21 days with control conditions [10,000 (blue circles)] or SR1 [0.75 μM, 300 (red crosses) or 10,000 (red circles)]. The average percent engraftment of human CD45+ cells in the blood (weeks 1 to 8) and BM (week 13) is shown. (B) Representative flow cytometry plots showing myeloid (CD11b and CD33) and lymphoid (CD19 and CD3) engraftment in the bone marrow.
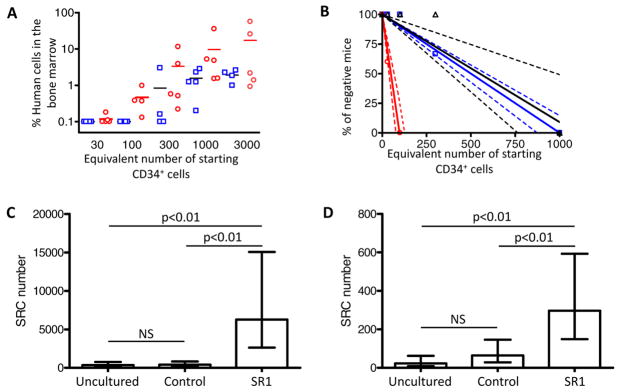
To calculate the SRC frequency of SR1 expanded cells a second engraftment experiment was performed. A fraction of the final culture, equivalent to between 30 and 3000 starting CB CD34+ cells expanded for 21 days with control conditions or SR1, were transplanted into NSG mice (Fig. 3A). Poisson statistics revealed a SRC frequency of 1/703 for uncultured cells, 1/597 per starting cell after cytokine expansion, and 1/40 per starting cell after expansion with SR1 (Fig. 3B). This represents a total SRC content of 356 in the 2.5 × 10⁵ CB CD34+ cells used to initiate the cultures, 403 SRC in control cultures, and 6283 SRC after culture with SR1 (Fig. 3C and table S5). The increase in NSG engraftment after culture with SR1 was reproducible over seven independent experiments (table S6). Calculation of the SRC numbers based on the number of cells injected after culture revealed that control cultures had a 1000-fold reduction in the SRC frequency but not total SRC content relative to fresh cells, likely reflecting that the majority of cells in these cultures are progenitor cells that have lost the ability to engraft NSG mice. Inclusion of SR1 diminished this effect and resulted in an 8-fold increase in the SRC frequency relative to control cultures. This result, together with the 2-fold increase in total cell number likely account for the 17-fold increase in SRC content.
Fig. 3.
Culture of CB-derived CD34+ cells with SR1 increases SRC numbers. (A) Mice were injected with a fraction of the final culture equivalent to the indicated number of starting CB CD34+ cells after culture for 21 days with control conditions (open blue squares) or SR1 [0.75 μM; (open red circles)]. The percentage of human CD45+ cells in the BM at 16 weeks is shown. Horizontial lines indictate the average of each group. (B) Linear regression analysis of data from 2A and 3A. Dotted lines represent the 95% confidence intervals. Shapes represent the percent of negative animals for each dose of cells (C) and secondary (D) SRC before and after culture of 2.5 × 10⁵ CB CD34+ cells was calculated using Poisson statistics applied to the data in table S5A.
To determine if SR1 expanded cells are capable of long term engraftment, bone marrow from primary mice was injected into secondary NSG mice and mice containing >0.1% human CD45+ cells in the BM 15 weeks after transplant were scored positive (see fig. S13 for examples of positive and negative animals). Poisson statistics revealed a secondary SRC frequency of 1/10,723 for uncultured cells, 1/3,749 for control cultures, and 1/841 for cells cultured with SR1 (Fig. 3D and table S5). Thus the secondary SRC content per 2.5 × 10⁵ CD34+ starting cells is 23 for uncultured cells; 64 for control cultured cells, and 297 for cells cultured with SR1 (a 12-fold increase in the number of secondary SRC as compared to input, Fig. 3D and table S5). The primary and secondary SRC content of control cultures was unchanged, consistent with the lack of clinical benefit following transplantation of cells expanded under similar conditions (13). These data demonstrate that culture with SR1 promotes the expansion of cells that retain multilineage long term engraftment.
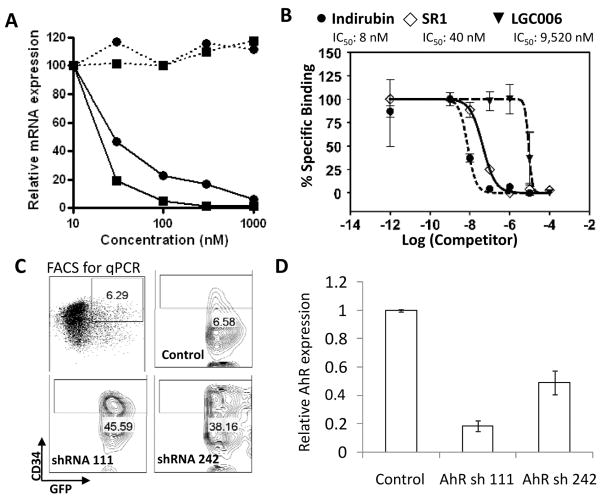
To identify the mechanism whereby SR1 increases engraftment potential of CB CD34+ cells, we profiled SR1 across 61 kinases. No inhibitory activity was found (table S7). Transcriptional profiling of SR1 and LGC006, a less potent SR1 analog (EC50 ~3 μM, Fig. 1B), revealed two genes that were significantly repressed by SR1 treatment and not affected by LGC006-cytochrome P450 1B1 (CYP1B1) and the aryl hydrocarbon receptor repressor (AHRR). Both are transcriptionally regulated by the aryl hydrocarbon receptor (AhR) (Fig. 4A and table S8), suggesting that SR1 could be acting as an antagonist of AhR signaling. To test this hypothesis, we determined the ability of SR1 to block induction of CYP1B1 mRNA by the AhR agonist dioxin (TCDD) in mPB CD34+ cells. SR1 dose-dependently inhibited the TCDD-induced increase in CYP1B1 mRNA indicating that SR1 can antagonize AhR signaling in CD34+ cells (fig. S14A). SR1 also abolished TCDD-induced AhR dependent transcription in cells expressing a human AhR dependent luciferase reporter gene (hDRE-luc)(14), demonstrating that SR1 is a potent AhR antagonist (IC50 = 127 nM, fig. S14B). SR1 only weakly inhibited TCDD-induced transcription in murine cells and had no activity on rat cells, suggesting that SR1 preferentially inhibits human AhR. This observation correlates with the lack of activity of SR1 on murine HSC, and may explain the species selectivity of SR1 (table S9). Two other AhR antagonists [alpha-naphthoflavone (15) and CH-223191(16)] were also tested and both led to dose dependent increases in the number of CD34+ cells (fig. S15).
Fig. 4.
SR1-induced CD34+ cell expansion acts by binding and antagonizing AhR. (A) Percent decrease in CYP1B1 (black squares) and AHRR (black circles) mRNA from mPB CD34+ cells treated with SR1 (solid lines) or LGC006 (dashed lines) for 24 h. (B) Quantification of AhR binding shown in fig. S16. (C) Phenotype of GFP+ cells 8 days after transduction with lentivirus expressing shRNAs targeting AhR. (D) Relative AhR mRNA expression in sorted CD34+GFP+ cells (box in C).
To elucidate whether the antagonizing effects of SR1 on AhR signaling are mediated by direct interaction with this nuclear receptor, we used a competitive binding assay between SR1 and AhR photoaffinity ligand (PAL) in liver cytosol isolated from hAhR transgenic mice (17). SR1 and the high affinity AhR agonist (Indirubin) both inhibited PAL binding (IC50 = 40 nM and 8 nM, respectively) whereas the inactive analogue LGC006 was much less effective [IC50 = 9520 nM; (Fig. 4B and fig. S16)]. These results support the conclusion that SR1-induced CD34+ cell expansion is mediated through direct binding and inhibition of the AhR.
To show a direct role for AhR in SR1-induced CD34+ cell expansion, CB CD34+ cells were infected with lentiviruses that express GFP and shRNAs targeting AhR. In the CD34+GFP+ cells, both shRNAs led to decreases in AhR mRNA and protein expression (Fig. 4, C and D, and fig. S17A). shRNA knockdown of AhR led to sustained CD34 expression during culture, similar to that observed with SR1 (Fig. 4C and fig. S17, B and C). To determine if SR1-induced CD34+ cell expansion requires inhibition of AhR activity, a constitutively active version of AhR lacking the ligand binding domain (CA-AhR) was expressed (18). SR1 failed to inhibit hDRE-luc activity of HepG2 cells expressing CA-AhR, but inhibited dixon-induced AhR activity in wild-type HepG2 cells and cells over-expressing WT-AhR (fig. S18A). Similarly, SR1 had no effect on CB CD34+ expressing CA-AhR (fig. S18B). Collectively, these data provide strong support that SR1increases the number of CB-CD34+ cells by direct binding and inhibition of the AhR.
Our data and that of others show that AhR is expressed in HSC (19). In addition to its role as a ligand-activated transcription factor responsible for the induction of drug-metabolizing enzymes, AhR has been implicated in pathways regulating hematopoiesis, including HES-1, c-Myc, C/EBP, PU.1, β-catenin, CXCR4, and Stat5 (20) dependent processes. Moreover, TCDD treatment of donor mice leads to a decrease in LSK reconstitution activity (21–22). These findings strongly implicate AhR in HSC biology, however future studies are required to define the molecular mechanisms involved.
One important question is if the increase in SRC numbers elicited by SR1 reflects expansion of HSC or indirect mechanisms, such as expansion of facilitator cells. The current data which show that SR1 increases phenotypic HSC numbers; SR1 and AhR knockdown maintain CD34 expression; and SR1 expands multilineage CFU are consistent with AhR antagonists acting to promote SRC numbers by preventing differentiation of HSC. However, the lack of a suitable in vivo transplantation assay capable of reading out the activity of single human HSCs makes it impossible to exclude alternative mechanisms. Better markers for human HSC, bioassays capable of reading out single human HSC, and clinical studies are required to address this important question.
The results herein complement previously reported efforts to either enhance the expansion of HSC [with Notch ligands, angiopoietins, copper chelators, glycogen synthase kinase 3β inhibitors, or the expression of HOX genes (3)]; or increase HSC homing [with prostaglandin E2 (23), inhibition of CD26 (10) or fucosylation (24)] to improve HSC transplant outcomes. To this end it will be of interest to explore the clinical potential of SR1, either by itself or in synergy with other agents, to improve outcomes and expand applications of autologous and allogeneic HSC transplantion.
Supplementary Material
Acknowledgments
We thank C. Trussell, D. Rines, and M. Hull for assistance with flow cytometry and screen development; J. E. Tellew, S. Pan, Y. Wan, and X. Wang for synthesis of LGC006; and J. Hogenesch for helpful discussions. A.E.B was funded by grants from CIRM and the Skaggs Institute for Chemical Biology. M.S.D. was funded by grants from National Institutes of Environmental Health Sciences (ES007685; ES04699). G.H.P. was funded by a grant from the National Institute of Health (NIH ES004869). SR1 is patented for applications related to HSC expansion.
Footnotes
References and Notes
- 1.Mimeault M, Hauke R, Batra SK. Clin Pharmacol Ther. 2007;82:252. doi: 10.1038/sj.clpt.6100301. [DOI] [PubMed] [Google Scholar]
- 2.Kondo M, et al. Annu Rev Immunol. 2003;21:759. doi: 10.1146/annurev.immunol.21.120601.141007. [DOI] [PubMed] [Google Scholar]
- 3.Hofmeister CC, Zhang J, Knight KL, Le P, Stiff PJ. Bone Marrow Transplant. 2007;39:11. doi: 10.1038/sj.bmt.1705538. [DOI] [PubMed] [Google Scholar]
- 4.Mogul MJ. Bone Marrow Transplant. 2000;25(suppl 2):S58. doi: 10.1038/sj.bmt.1702372. [DOI] [PubMed] [Google Scholar]
- 5.Brunstein CG, Setubal DC, Wagner JE. Br J Haematol. 2007;137:20. doi: 10.1111/j.1365-2141.2007.06521.x. [DOI] [PubMed] [Google Scholar]
- 6.Wagner JE, et al. Blood. 2002;100:1611. doi: 10.1182/blood-2002-01-0294. [DOI] [PubMed] [Google Scholar]
- 7.Smith AR, Wagner JE. Br J Haematol. 2009;147:246. doi: 10.1111/j.1365-2141.2009.07828.x. [DOI] [PMC free article] [PubMed] [Google Scholar]
- 8.Murray LJ, et al. Exp Hematol. 1999;27:1019. doi: 10.1016/s0301-472x(99)00031-4. [DOI] [PubMed] [Google Scholar]
- 9.Ratajczak MZ. Curr Opin Hematol. 2008;15:293. doi: 10.1097/MOH.0b013e328302c7ca. [DOI] [PubMed] [Google Scholar]
- 10.Campbell TB, Hangoc G, Liu Y, Pollok K, Broxmeyer HE. Stem Cells Dev. 2007;16:347. doi: 10.1089/scd.2007.9995. [DOI] [PubMed] [Google Scholar]
- 11.Ding S, Gray NS, Wu X, Ding Q, Schultz PG. J Am Chem Soc. 2002;124:1594. doi: 10.1021/ja0170302. [DOI] [PubMed] [Google Scholar]
- 12.Ito M, et al. Blood. 2002;100:3175. doi: 10.1182/blood-2001-12-0207. [DOI] [PubMed] [Google Scholar]
- 13.Kelly SS, Sola CB, de Lima M, Shpall E. Bone Marrow Transplant. 2009;44:673. doi: 10.1038/bmt.2009.284. [DOI] [PMC free article] [PubMed] [Google Scholar]
- 14.Garrison PM, et al. Fundam Appl Toxicol. 1996;30:194. doi: 10.1006/faat.1996.0056. [DOI] [PubMed] [Google Scholar]
- 15.Jang JY, et al. Reprod Toxicol. 2007;24:303. doi: 10.1016/j.reprotox.2007.08.002. [DOI] [PubMed] [Google Scholar]
- 16.Kim SH, et al. Mol Pharmacol. 2006;69:1871. doi: 10.1124/mol.105.021832. [DOI] [PubMed] [Google Scholar]
- 17.Flaveny CA, Murray IA, Chiaro CR, Perdew GH. Mol Pharmacol. 2009;75:1412. doi: 10.1124/mol.109.054825. [DOI] [PMC free article] [PubMed] [Google Scholar]
- 18.McGuire J, Okamoto K, Whitelaw ML, Tanaka H, Poellinger L. J Biol Chem. 2001;276:41841. doi: 10.1074/jbc.M105607200. [DOI] [PubMed] [Google Scholar]
- 19.Frericks M, Meissner M, Esser C. Toxicol Appl Pharmacol. 2007;220:320. doi: 10.1016/j.taap.2007.01.014. [DOI] [PubMed] [Google Scholar]
- 20.Singh KP, Casado FL, Opanashuk LA, Gasiewicz TA. Biochem Pharmacol. 2009;77:577. doi: 10.1016/j.bcp.2008.10.001. [DOI] [PMC free article] [PubMed] [Google Scholar]
- 21.Singh KP, Wyman A, Casado FL, Garrett RW, Gasiewicz TA. Carcinogenesis. 2009;30:11. doi: 10.1093/carcin/bgn224. [DOI] [PMC free article] [PubMed] [Google Scholar]
- 22.Sakai R, et al. Toxicol Sci. 2003;72:84. doi: 10.1093/toxsci/kfg002. [DOI] [PubMed] [Google Scholar]
- 23.North TE, et al. Nature. 2007;447:1007. doi: 10.1038/nature05883. [DOI] [PMC free article] [PubMed] [Google Scholar]
- 24.Xia L, McDaniel JM, Yago T, Doeden A, McEver RP. Blood. 2004;104:3091. doi: 10.1182/blood-2004-02-0650. [DOI] [PubMed] [Google Scholar]
Associated Data
This section collects any data citations, data availability statements, or supplementary materials included in this article.


