

Abstract
Structural chromosome aberrations are known hallmarks of many solid tumors. In the papillary form of thyroid cancer (PTC), for example, activation of the receptor tyrosine kinase (RTK) genes, RET and neurotrophic tyrosine kinase receptor type I (NTRK1) by intra- and interchromosomal rearrangements has been suggested as a cause of the disease. However, many phenotypically similar tumors do not carry an activated RET or NTRK-1 gene or express abnormal ret or NTRK-1 transcripts. Thus, we hypothesize that other cellular RTK-type genes are aberrantly expressed in these tumors. Using fluorescence in situ hybridization-based methods, we are studying karyotype changes in a relatively rare subgroup of PTCs, i.e., tumors that arose in children following the 1986 nuclear accident in Chernobyl, Ukraine. Here, we report our technical developments and progress in deciphering complex chromosome aberrations in case S48TK, an aggressively growing PTC cell line, which shows an unusual high number of unbalanced translocations.
Keywords: thyroid cancer, radiation, Chernobyl, chromosome aberration, translocation, fluorescence in situ hybridization (FISH), DNA probes, bacterial artificial chromosome
Introduction
Release of large quantities of 131I in the aftermath of the Chernobyl nuclear power plant accident in April 1986 led to an unprecedented exposure of thyroid tissues to radioiodine in the inhabitants of the nearby regions of the Ukraine, Belarus and Russia. Normally, iodine in the diet is absorbed in the intestine as inorganic iodide, concentrated by the thyroid gland and incorporated in precursors of thyroid hormones [1]. Within a few years following the accident, the incidence of childhood papillary thyroid carcinomas (chPTC; defined as PTC in patients under the age of 16 at the time of surgery) in regions near the accident site had increased dramatically. For example, in the most contaminated Gomel region, chPTC rates before the accident were about 0.5 cases/million children/year [2–3], but then rose to a tumor burden of approximately 100 cases/million children/year in 1994 [4–5].
Although rare in children, PTC is the most common cancer of the thyroid gland in adults [6–7]. Rearrangements of chromosomes 1 and 10 are common cytogenetic changes in PTC [8–10], while loss of heterozygosity (LOH) for loci on chromosome 3 had initially been reported only in follicular TC [11–12]. A correlation of alterations involving the chromosomal region 10q11 to thyroid tumorigenesis was supported by the frequent finding of a truncated RET proto-oncogene, which localizes to the same chromosomal band [13]. Reported aberrations range from unconfirmed small interstitial deletions to larger intra- and interchromosomal rearrangements and chromosome loss. While studies reported chromosomal changes in cases of adulthood PTC, there is only limited information regarding the cytogenetic alterations in chPTC [14 –16].
Currently, clinical and biological characteristics such as patient age, tumor size, extent, distant metastases, aneuploidy and cyclase activity are monitored to predict tumor behavior, but a molecular genetic marker is needed to preoperatively distinguish between less aggressive and more aggressive well-differentiated thyroid cancers [17]. The RET/PTC oncogene, an activated form of the RET proto-oncogene, which maps to chromosome 10q11.2 and encodes a transmembrane RTK gene, could serve as a molecular marker differentiating low from high risk papillary thyroid cancer [18,19]. Major types of RET rearrangements (termed RET/PTC1, RET/PTC2, RET/PTC3) show the tk domain of RET fused in frame with the 5' part of a constitutively expressed gene and thus producing a chimeric mRNA which is translated into a hybrid protein with kinase activity [20]. RET/PTC1 and RET/PTC3 are paracentric inversions on the long arm of chromosome 10, while RET/PTC2 is caused by a reciprocal translocation t(10;17)[10,11,18,21,22]. Additional variants of RET rearrangements have been described in individual cases, but in the three major types of rearrangements, the breakage within the RET gene was found in intron 11 upstream of the tk domain [22].
The human gene for NTRK1 encodes a signal transducing transmembrane receptor that is stimulated by nerve growth factor. This gene maps to chromosome 1 band q21–22 [23], and its expression in normal tissue is limited to neural-crest derived sensory neurons. Aberrant forms of NTRK1 created by in-frame fusion of its tk domain with 5’-sequences of the human non-muscular tropomyosin gene (TPM3) have been found in colon and thyroid carcinomas [16,24–26].
The key elements of thyroid tumorigenesis are still unknown. Recent reports suggesting that the aberrant expression of genes involved in apoptosis or cell proliferation may play an important role in the malignant transformation of benign thyroid neoplasms or the progression of well differentiated thyroid cancer to the much more aggressive anaplastic carcinomas still await confirmation in larger study cohorts [27,28].
On the other hand, activation and aberrant expression of RTK genes other than RET or NTRK1 could explain findings where many of the cases or individual cells in tumor cell cultures showed neither evidence of chromosomal rearrangements nor expression of the ret or NTRK1 oncogene [26,29,30].
There is growing evidence that small, ‘submicroscopic’ lesions lead to disease phenotypes and tumors [31,32]. Present techniques for karyotype analyses are based on Giemsa (G)-banding, whole chromosome painting (WCP) or Spectral Karyotyping (SKY). These techniques fail to detect deletions or translocations smaller than ~10 Mbp, i.e., roughly the size of a chromosome band. However, fluorescence in situ hybridization (FISH) with gene- or locus-specific probes is sensitive enough to tag specific DNA sequences in interphase or metaphase cells. Our approach combines the high specificity of bacterial artificial chromosome (BAC)-derived DNA probes with the sensitive single-cell detection capability of FISH, thus enabling the rapid and unambiguous detection of small translocations, duplications and inversions necessary to identify and characterize occult translocations in chPTC [33].
Materials and methods
Metaphase spreads were made from short-term cultures of lymphocytes from an anonymous normal male donor were grown for 72 h in RPMI 1640 (Invitrogen, Carlsbad, CA) 10% fetal bovine serum, 1% penicillin/streptomycin and 2% phytohaemagglutinin (PHA, HA-15; Abbott Molecular, Inc, Des Plaines, IL). Cells were blocked in mitosis by treatment with colcemid (0.12 μg/ml, Invitrogen, San Diego, CA) for 30 min. The tumorigenic cell line S48TK was prepared from a thyroid cancer that arose following the 1986 nuclear accident in Chernobyl, Ukraine [30]. At the time of exposure to elevated levels of radiation, the patient was 7 years old and had reached age 14 at the time of surgery at the Center for Thyroid Tumors in Minsk, Belarus [34]. The S48TK cells were kept in culture for several weeks as described [30,34], and blocked with colcemid (0.4–0.8 μg/ml) 1–2 hrs prior to harvest. All cells were pelleted and incubated in 75 mM KCl for 15 min at 37°C. The cells were then spun down, and approximately 107 cells were fixed in three changes of Carnoy’s fixative (acetic acid:methanol, 1:3 (vol.:vol.)). Finally, the cells were dropped on ethanol-cleaned glass slides and aged for a minimum of 1 week in ambient air at 20°C, sealed in plastic bags and stored at –20°C until used. Fluorescence in situ hybridization. Using information in publicly available databases (http://genome.ucsc.edu/ and http://www.ncbi.nlm.nih.gov/gquery/gquery.fcgi), we selected BAC clones for the long arm of chromosome 1 from the Roswell Park Cancer Institute (RPCI) library RP11 (Table 1). For DNA isolation and preparation of DNA probes from individual clones, BAC DNA was isolated from 10 ml bacterial overnight cultures containing 12.5 μg/ml chloramphenicol (Sigma, St. Louis, MO) using an alkaline lysis and 2-propanol DNA precipitation [23]. Briefly, cell pellets resuspended in 10 ml of phosphate-buffered saline (PBS) containing 50μg/ml lysozyme (Sigma) and lyzed in sodium hydroxide (0.2 N NaOH, 1 % SDS). After neutralization by addition of 3 M NaOAc, bacterial DNA was pelleted. The supernatant was transferred to clean tubes, and DNA was precipitated in 2-propanol, washed once with cold 70% ethanol, and resuspended in TE buffer (10 mM Tris-HCl, 1 mM EDTA, pH 8.0). Then, the DNA was extracted once with phenol:chloroform, precipitated again with 2-propanol, and resuspended in 20–40 μl sterile water. The DNA concentrations were determined using a TKO100 instrument and Hoechst 33342 fluorometry (Hoefer, San Francisco, CA) [23]. The BAC-derived DNA (typically 1–2 μl of DNA in a 10 μl reaction) was labeled via random priming following the instruction of the kit manufacturer (BioPrime Kit, Invitrogen) [35] incorporating biotin-14-dCTP (part of the BioPrime kit), digoxigenin-11-dUTP (dig-11-dUTP, Roche Molecular Biochemicals, Indianapolis, IN), fluorescein-12-dUTP (Roche Molecular Biochemicals), Cy5-dUTP (Amersham, Arlington Heights, IN) or Cy5.5-dCTP (Perkin Elmer, Wellesley, MA) [10,34,35].
Table 1.
Location of BACs, TMP3, and NTRK1 genes on chromosome 1.
| Region | Clone/Gene | Start point (bp)a | End point (bp) a | BAC/gene size (bp)b | Label |
|---|---|---|---|---|---|
| 1q21.1 | RP11–315I20 | 144149936 | 144341526 | 191590 | biotin |
| 1q21.3 | TPM3 | 152394404 | 152431233 | 36830 | --- |
| 1q22 | RP11–243J18 | 153894242 | 154001919 | 107678 | digoxigenin |
| 1q22 | NTRK1 | 155052166 | 155118266 | 66101 | --- |
| 1q22 | RP11–110J1 | 155238892 | 155295588 | 167292 | biotin |
Unique position information is estimated from the Human Genome Reference DNA Sequence, Mapviewer build 36.3 at http://www.ncbi.nlm.nih.gov/projects/mapview/.
The insert sizes were taken from information available at the NCBI Clone Registry at http://www.ncbi.nlm.nih.gov/genome/clone/clname.cgi?stype=Id&list=209311&TransHist=0
The clones we used to label specific regions of chromosome 9 were a subset of the Sanger Centre 1Mbp set [34,36]. A total of 150 BAC clones (50 and 100 clones for the short and long arms of chromosomes, respectively) were grown overnight in 2 ml LB medium plus chloramphenicol each 96-well in deep-well plates (Becton Dickinson, San Jose, CA) [34]. The preparation of DNA probes representing BAC pools was performed in the way described for single clones with the following modification: 1 ml from each culture was combined in the desired pool, the cells were spun down, resuspended in 10 ml PBS containing 50 μg/ml lysozyme, and DNA was isolated and labeled as described above. Prior to hybridization of DNA probes to S48TK cells, all probes were tested on normal male metaphase spreads to ensure sufficient signal strength, correct cytogenetic map positions and absence of chimerism.
For FISH, we combined 1 μl of each probe, 1–4μl of human COT-1 DNA (1 mg/ml, Invitrogen), 1 μl of salmon sperm DNA (10 mg/ml, Invitrogen) and 7 μl of a hybridization master mix (78.6% formamide (FA)(Invitrogen), 14.3% dextran sulfate in 1.43x SSC, pH 7.0 (20x SSC is 3 M sodium chloride, 300 mM tri-sodium citrate) [35]. If more than three probes were combined, we precipitated the probes in 2-propanol, and resuspended the pellet in 3 μl water prior to addition of COT-1 DNA and the hybridization master mix [34]. The mixture was denatured in a waterbath at 76°C for 10 min and incubated for 30 min at 37°C to pre-anneal blocking DNA with the probes. At this time, the slides were denatured for 4 min at 76°C in 70% formamide/2x SSC, pH 7.0, dehydrated in a 70%, 85%, 100% ethanol series for 2 min each step, and air dried. Ten microliters of the hybridization mixture was pipetted on to the cells, covered with a 22x22 mm2 coverslip and sealed with rubber cement. Following overnight hybridization at 37°C and coverslip removal, the slides were washed twice in 50% FA/2x SSC at 45°C for 10 min each followed by two washes in 2x SSC at 21°C. Cells were then incubated 5min in PNM (5% nonfat dry milk, 1% sodium azide in PN buffer (0.1 M Na phosphate buffer, pH 8.0, 1% Nonidet-P40 (Sigma))) at 21°C, before bound non-fluorescent probes were detected with fluorescein-conjugated avidin DCS (Vector, Burlingame, CA) or anti-digoxigenin-rhodamine (Roche) [23,35]. Finally, the slides were mounted in 4’,6-diamidino-2-phenyl-indole (DAPI) (0.5 μg/ml; Calbiochem, La Jolla, CA) in antifade solution [23]. Spectral Karyotyping analysis was performed with commercially available probes (Applied Spectral Imaging, Inc., Carlsbad, CA) following the manufacturer’s instructions [30,34]. Image acquisition and analysis. Fluorescence microscopy was performed on a Zeiss Axioskop microscope equipped with a filter sets for observation of Cy5/Cy5.5, Texas Red/rhodamine. FITC or DAPI (84000v2 Quad, ChromaTechnology, Brattleboro, VT). Images were collected using a CCD camera (VHS Vosskuehler, Osnabrueck, FRG) and processed using Adobe Photoshop® software (Adobe Inc., Mountain View, CA).
Results
Karyotype analysis cell line S48TK using G–banding or SKY had indicated numerous translocations among several complex translocations [30, 34](Fig. 1A-D). Our interest in rearrangements of the long arm of chromosome 1 was initiated by the observation that several derivative chromosomes carried chromosome 1-derived material, the proximal long arm of chromosome 1 harbors the NTRK1 genes and comparative genomic hybrid-dization (CGH) indicated extra copies of the proximal region of chromosome1q [34]. A first hybridization of BAC-derived DNA probes that flank the NTRK1 locus and cover a region of chromosome 1 from roughly 154 Mbp to 155 Mbp (Table 1) indicated two copies of a der(1) with a potentially truncated long arm. On both of these chromosomes, we observed one red and one green signal per chromatid without indication of a high level amplification of the region around 1q22 to which NTRK1 maps [23](Fig. 1E). The FISH signals were in close proximity and partially overlapping as one would expect from BAC probes that bind just 1.2 Mbp apart from each other (Table 1). Interestingly, both copies of the der(1) showed a reversed order of BAC probes RP11–243J18 (dig.-labeled, red fluorescent detection) and RP11–110J1 (biotin-labeled, green signals after avidin-FITC detection) on 1q (Table 1) with the green signal found more proximal that the red signals indicative for an inversion (Fig. 1E).
Fig. 1.
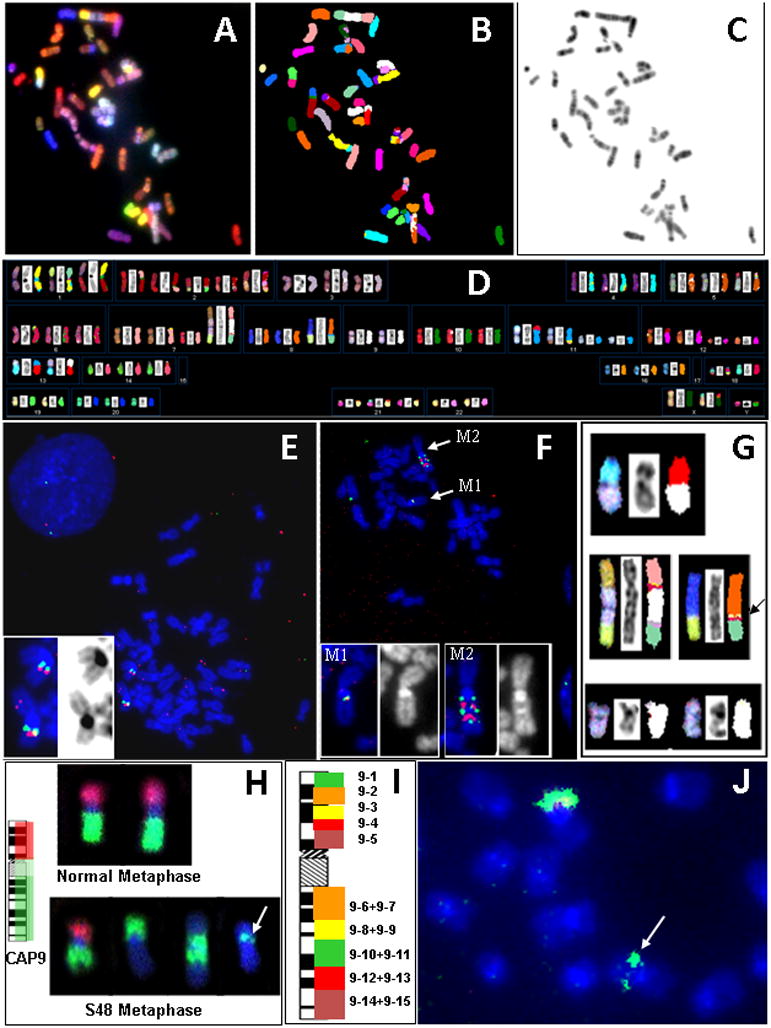
FISH-based analysis of chromosomal alterations in a case of post-Chernobyl childhood thyroid cancer. A)-D) SKY analysis reveals a large number of translocations most of which are unbalanced (A: pseudo-RGB image, B: chromosome classification image, C: inverted DAPI counterstain image, D: SKY karyotype table). E) Dual color FISH analysis of S48TK metaphase spreads with BACs flanking NTRK1. The insert shows enlarged images of two copies of a der(1) (left: pseudo-RGB composite of FISH signals and DAPI counterstain; right: the inverted DAPI picture). F) Analysis of S48TK metaphase spreads with BACs flanking TMP3. The inserts show enlarged images of the two marker chromosomes, M1 and M2 (left: pseudo-RGB composite of FISH signals and DAPI counterstain; right: the DAPI picture). G) Various abnormal chromosomes found in S48TK metaphase spreads carry material originating from chromosome 9 (shown in white in the classification images). These SKY images show the pseudo-RGB picture to the left, an inverted DAPI image in the middle and the corresponding classification images to the right. The arrow points at a small segment of chromosome 9 material inserted into a der(8)t(8;15) marker chromosome. H) Chromosome arm painting (CAP) probes delineate the short (red) and long (green) arm of chromosome 9 in normal metaphase chromosomes. In S48TK metaphase chromosomes, these probe pools highlight the chromosome 9-derived material on marker chromosomes. The arrow points to a small segment of chromosome 9q material on the der(8)t(8;15) marker chromosome. I) Schematic illustrating the use of pooled BAC probes each covering several megabases on chromosome 9 for mapping of translocation at the single band resolution. J) Pools (9–10 + 9–11) specifically bind to the small segment of interest (arrow). [The images shown in D) and G) - J) are reproduced from Weier et al. [34] with permission from S. Karger AG, Basel, CH.]
This result prompted an investigation whether the region of chromosome 1 between 144 Mbp and 154 Mbp, i.e., around TPM3, a reported fusion partner of NTRK1 in PTC, was also rearranged or not. We combined the same dig.-labeled probe RP11–243J18 with a biotinylated probe prepared from BAC RP11–315I20, a clone which on normal chromosomes 1 binds about 10 Mbp proximal of RP11–243J18. Hybridization of this probe combination to S48TK metaphase spreads showed signals on two marker chromosomes labeled M1 and M2 (Fig. 1F). The marker M1 showed overlapping red and green FISH signals, while marker M2 chromosome showed at least three green and two red hybridization domains per chromatid (Fig. 1F, top). The inserts in Figure 1F show enlarged FISH and DAPI pictures of the marker chromosomes, which may explain the CGH results reported earlier [34]. In summary, complex chromosomal changes found on the long arm of chromosome 1 in the chPTC cell line S48TK warrant a further, high resolution investigation of rearrangements that might have lead to the malignant transformation of the progenitors of these cells.
While oncogenic activation of tk genes from chromosome 1 or 10, i.e., NTRK1 or ret, respectively, has been reported, the literature does not indicated involvement of chromosome 9 in the pathogenesis of PTC. Cell line S48TK shows several marker chromosomes that carry chromosome 9-derived material among them a large der(7)t(7;9;15) (Fig. 1G). We were particularly interested in characterizing a small piece of chromosome 9 inserted into a der(8)t(8;15) marker chromosome (arrow in Fig. 1G)[34]. To rapidly determine the origin of this small insert, we decided to apply pools of BAC clones and combinations of pools, so-called ‘superpools’. All BACs were selected from the Sanger Center 1 Mbp set [36]. In total, we chose 50 clones that map to the short arm of chromosome 9, and 100 clones that map to the long arm. As depicted in Fig. 2, BAC clones were arrayed in 96-well microtiter plates so that the most distal clone on the short arm of chromosome 9 was placed in position A1 and each row contained between 8 and 11 clones that mapped into an interval of several megabasepairs [34]. To expedite the characterization of the small insert, we labeled the five pools that map to the short arm of chromosome 9 (pools 9–1 to 9–5) with digoxigenin. Pools that map to the long arm were combined in pairs and labeled with biotin (Table 2). All probes were then combined in one hybridization mixture. Hybridization of these chromosome 9 arm probes (CAP9) onto normal metaphase chromosomes showed the desired effect of painting the short and long arms in red and green, respectively (Fig. 1H). Hybridization of the CAP9 probe to S48TK metaphase spreads revealed 4 different types of chromosomes with material from chromosome 9, among them the marker with the small insert (arrow in Fig. 1H). Due to its green fluorescence, the insert was confirmed as being derived from chromosome 9q. When superpools for chromosome 9q were label with five different reporter molecules as shown schematically in Fig. 1I and hybridized to S48TK metaphase spreads, the small insert was identified by its green fluorescence as being the hybridization target of pools 9–10 + 9–11 (Fig. 1J, arrow). Thus, in only two overnight hybridizations, the origin of the small insert could be narrowed down from chromosome 9 (about 138 Mbp) to the long arm of chromosome 9 (about 93 Mbp) to a pair of BAC pools (12.7 Mbp). Hybridization of individual BAC clones will now allow to characterize the insert with a resolution of 30–50kb and identify candidate gene in this region.
Fig. 2.
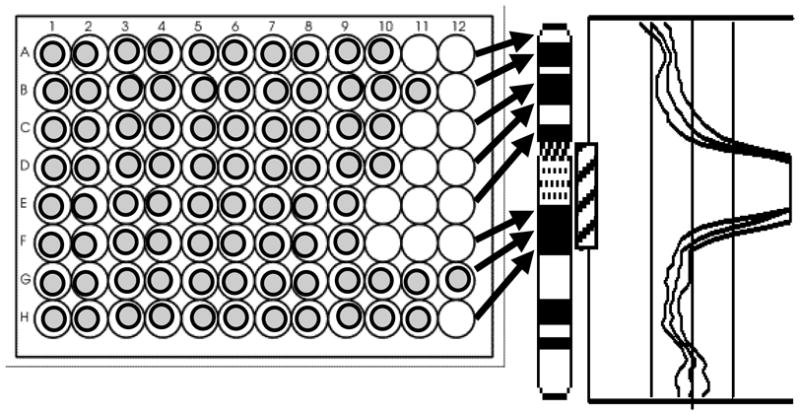
Schematic diagram of the BAC-FISH pooling strategy for delineation of chromosomal rearrangements on chromosome 9. Clones are arranged on 96-well plates such that each row contains clones which map within a region a few megabasepairs. Arrows point from rows on the plate to the target chromosome bands. The profiles on the right depict copy number changes along chromosome 9 in case S48TK, with a region of copy number overrepresentation indicated by a hatched box near the chromosome 9 ideogram.
Table 2.
BAC pool positions, sizes and labelsa
| Pool | Start [bp] | End [bp] | Size [Mbp] | CAP label |
|---|---|---|---|---|
| 9–1 | 991152 | 7418276 | 6.43 | digoxigenin |
| 9–2 | 7267081 | 14586697 | 7.32 | digoxigenin |
| 9–3 | 15219945 | 22579721 | 7.36 | digoxigenin |
| 9–4 | 23376562 | 29639053 | 6.26 | digoxigenin |
| 9–5 | 30199650 | 43076412 | 12.88 | digoxigenin |
| 9–6 + 9–7 | 68358409 | 83525574 | 14.56 | biotin |
| 9–8 + 9–9 | 84220295 | 95598231 | 10.8 | biotin |
| 9–10 + 9–11 | 96060259 | 109360971 | 12.71 | biotin |
| 9–12+ 9–13 | 109953950 | 121178266 | 11.23 | biotin |
| 9–14+ 9–15 | 121691418 | 138274031 | 16.11 | biotin |
Probes labeled with biotin or digoxigenin were detected with avidin-FITC and rhodamine-conjugated antibodies against digoxigenin, respectively [CAP: chromosome arm probe].
Discussion
The role of iodine deficiency or ionizing radiation in the genesis of thyroid tumors and the mechanisms underlying the progression of benign thyroid disease (for example, goiters or adenomas) to malignant carcinomas are vastly unknown. Specific rearrangements such as the ret/PTC oncogene or a TMP3-NTRK1 fusion gene product have been suggested as a cause of malignant transformation of thyroid epithelium, yet many tumors do not show either abnormality. Thus, there is an important need to screen PTC specimens for genetic or chromosomal abnormalities.
We believe that our BAC-FISH assays, expected to be an order of magnitude more sensitive that Giemsa (G)-banding karyotyping, will lead to the identification of genes in the breakpoint region(s) and help define chPTC-candidate genes for expression studies in normal and tumor tissue. To test this hypothesis, we have chosen two approaches that identify target regions of the human genome for subsequent high resolution studies using FISH or molecular methods such as reverse transcription PCR. The first set of experiments resembles a candidate gene approach in which abnormal chromosomes are identified by G-banding and/or SKY analysis of metaphase spreads [30], and BACs that bind at or near candidate genes such as the before-mentioned TMP3 or NTRK1 are selected from high complexity libraries. The second approach, which we applied to the characterization of translocated segments of chromosome 9 in the chPTC cell line S48TK, does not make any assumption regarding candidate genes. Instead, the chromosome under investigation is divided into increasingly smaller segments, each of which can be identified by specifically labeled BAC pools, down to the level of individual clones. Once a BAC clone is identified that binds near a breakpoint or spans it, a search of publicly available databases such as the draft sequence of the human genome may rapidly identify candidate genes in this region. However, caution in the interpretation of such mapping studies is advised, since cis-acting, regulatory elements may be tens of kilobases away from their target gene [37].
Historically, breakpoint mapping has been an iterative process based on the definition of the smallest interval between proximal and distal probes (see article by Lu et al. in this issue of Folia Histochemica et Cytobiologica)[38]. Our work presented here focuses on using BAC clones rather than yeast artificial chromosomes (YACs), because the BACs have a number of significant advantages such as a lesser rate of chimerism [39,40], faster growth or ease of DNA isolation [41]. Another aim of our study was to expedite the process of mapping translocation breakpoints by eliminating so-called hybridization failures through pooling of BAC clones [42,43].
Importantly, our pooling protocol for FISH probe preparation accelerates the delineation and fine mapping of translocation breakpoints without sacrificing resolution. The turnaround time for each cycle comprised of clone selection, FISH and image analysis using tumor metaphase samples can be as short as 3–4 days. Thus, with translocation breakpoints roughly determined by G-banding or SKY, large numbers of BACs can be pulled from in-house libraries, re-arrayed, grown and assembled in probe pools in a matter of days. As the chromosome 9-specific example in this paper shows, only a handful of overnight hybridizations are required to localize the breakpoint to a single pool and open the door to high resolution analysis using single BAC clones. Thus, the proposed BAC pooling strategy seems capable to provide breakpoint information as well as DNA probes suitable for metaphase or interphase cell analysis in only 2–3 weeks, a significant improvement over previous methods [44,45].
We believe, our approach reducing the overall costs of oncogene discovery projects will lead to accelerated cancer research. The ability to prepare customized, patient-specific DNA probes can also be of benefit to patients undergoing anti-cancer therapy by providing high quality reagents able to detect rare or residual cancer cells.
Acknowledgments
This work was supported in parts by NIH grants CA80792, CA88258, CA123370, and HD45736, and a grant from the Director, Office of Energy Research, Office of Health and Environmental Research, U.S. Department of Energy, under contract DE-AC02-05CH11231. JFW was supported in part by NIH grant HD41425 and a grant from the UC Discovery Program, which also supported AB. Ideograms were kindly provided by D. Adler, Ph.D., Dept. of Pathology, Univ. Washington. We acknowledge the support from staff at the Helmholtz Zentrum Muenchen providing metaphase spreads and G-banding data. We also like to express our thanks to the scientists at the Human Genome Center, California Institute of Technology, Pasadena, whose generosity made these studies possible.
Footnotes
Parts of this work have been presented at the 13th Congress of the International Federation of Societies for Histochemistry and Cytochemistry (ICHC2008), Medical University of Gdansk, Poland, August 27-30, 2008.
Disclaimer: This document was prepared as an account of work sponsored by the United States Government. While this document is believed to contain correct information, neither the United States Government nor any agency thereof, nor The Regents of the University of California, nor any of their employees, makes any warranty, express or implied, or assumes any legal responsibility for the accuracy, completeness, or usefulness of any information, apparatus, product, or process disclosed, or represents that its use would not infringe privately owned rights. Reference herein to any specific commercial product, process, or service by its trade name, trademark, manufacturer, or otherwise, does not necessarily constitute or imply its endorsement, recommendation, or favoring by the United States Government or any agency thereof, or The Regents of the University of California. The views and opinions of authors expressed herein do not necessarily state or reflect those of the United States Government or any agency thereof, or The Regents of the University of California.
References
- 1.Nagataki S, Ingbar SH. Autoregulation: effects of iodine. In: Braverman LE, Utiger RD, editors. Werner and Ingbar's: the Thyroid. Philadelphia: Lippincott Company; 1991. pp. 306–312. [Google Scholar]
- 2.Baverstock K, Egloff B, Pinchera A, Ruchti C, Williams D. Thyroid cancer after Chernobyl. Nature. 1992;359:21–22. doi: 10.1038/359021b0. [DOI] [PubMed] [Google Scholar]
- 3.Kazakov US, Demidchik EP, Astakhova LN. Thyroid cancer after Chernobyl. Nature. 1992;369:21. doi: 10.1038/359021a0. [DOI] [PubMed] [Google Scholar]
- 4.Gembicki M, Stozharov AN, Arinchin AN, Moschik KV, Petrenko S, Khmara IM, Baverstock KF. Iodine deficiency in Belarusian children as a possible factor stimulating the irradiation of the thyroid gland during the Chernobyl catastrophe. Environm Health Perspect. 1997;105:1487–1490. doi: 10.1289/ehp.97105s61487. [DOI] [PMC free article] [PubMed] [Google Scholar]
- 5.Nikiforov YE. Radiation-induced thyroid cancer: what we have learned from Chernobyl. Endocrine Path. 2006;17:307–318. doi: 10.1007/s12022-006-0001-5. [DOI] [PubMed] [Google Scholar]
- 6.Chang JKC. Papillary carcinoma of thyroid: Classical and variants. Histol Histopathol. 1990;5:241–257. [PubMed] [Google Scholar]
- 7.Farid NR, Shi Y, Zou M. Molecular basis of thyroid cancer. Endocrine Rev. 1994;15:202–232. doi: 10.1210/edrv-15-2-202. [DOI] [PubMed] [Google Scholar]
- 8.Bongarzone I, Pierotti MA, Monzini N, Mondellini P, Manenti G, Donghi R, Pilotti S, Grieco M, Santoro M, Fusco A, Vecchio G, Della Porta G. High frequency of activation of tyrosine kinase oncogenes in human papillary thyroid carcinoma. Oncogene. 1989;4:1457–1462. [PubMed] [Google Scholar]
- 9.Bongarzone I, Monzini N, Borrello MG, Carcano C, Ferraresi G, Arighi E, Mondellini P, Della Porta G, Pierotti MA. Molecular characterization of a thyroid tumor-specific transforming sequence formed by the fusion of ret tyrosine kinase and the regulatory subunit R1αof cyclic AMP-dependant protein kinase A. Mol Cell Biol. 1993;13:358–366. doi: 10.1128/mcb.13.1.358. [DOI] [PMC free article] [PubMed] [Google Scholar]
- 10.Jossart GH, Greulich KM, Siperstein AE, Duh Q, Clark OH, Weier H-UG. Molecular and cytogenetic characterization of a t(1;10;21) translocation in the human papillary thyroid cancer cell line TPC-1 expressing the ret/H4 chimeric transcript. Surgery. 1995;118:1018–1023. doi: 10.1016/s0039-6060(05)80108-4. [DOI] [PubMed] [Google Scholar]
- 11.Herrmann MA, Hay ID, Bartelt DH, Ritland SR, Dahl RJ, Grant CS, Jenkins RB. Cytogenetic and molecular genetic studies of follicular and papillary thyroid cancers. Journal Clinical Invest. 1991;88:1596–1604. doi: 10.1172/JCI115472. [DOI] [PMC free article] [PubMed] [Google Scholar]
- 12.Ward LS, Brenta G, Medvedovic M, Fagin JA. Studies of allelic loss in thyroid tumors reveal major differences in chromosomal instability between papillary and follicular carcinomas. J Clin Endocrinol Metabol. 1998;83:525–530. doi: 10.1210/jcem.83.2.4550. [DOI] [PubMed] [Google Scholar]
- 13.Pierotti MA, Santoro M, Jenkins RB, Sozzi G, Bongarzone I, Grieco M, Monzini N, Miozzo M, Herrmann MA, Fusco A, Hay ID, Della Porta G, Vecchio G. Characterization of an inversion on the long arm of chromosome 10 juxtaposing D10S170 and RET and creating the oncogenic sequence RET/TPC. Proc Natl Acad Sci USA. 1992;89:1616–1620. doi: 10.1073/pnas.89.5.1616. [DOI] [PMC free article] [PubMed] [Google Scholar]
- 14.Fugazzola L, Pilotti S, Pinchera A, Vorontsova TV, Mondellini P, Bargarzone I, Greco A, Astakhova L, Butti MG, Demidchik EP. Oncogenic rearrangements of the RET proto-oncogene in papillary thyroid carcinomas from children exposed to the Chernobyl nuclear accident. Cancer Res. 1995;55:5617–5620. [PubMed] [Google Scholar]
- 15.Nikiforov YE, Heffess CS, Korzenko AV, Fagin JA, Gnepp DR. Characteristics of follicular tumors and nonneoplastic thyroid lesions in children and adolescents exposed to radiation as a result of the Chernobyl disaster. Cancer. 1995;76:900–909. doi: 10.1002/1097-0142(19950901)76:5<900::aid-cncr2820760527>3.0.co;2-x. [DOI] [PubMed] [Google Scholar]
- 16.Beimfohr C, Klugbauer S, Demidchik EP, Lengfelder E, Rabes HM. NTRK1 rearrangement in papillary thyroid carcinomas of children after the Chernobyl reactor accident. Int J Cancer. 1999;80:842–847. doi: 10.1002/(sici)1097-0215(19990315)80:6<842::aid-ijc7>3.0.co;2-z. [DOI] [PubMed] [Google Scholar]
- 17.Jossart GH, Clark OH. Well-differentiated thyroid cancer. Curr Probl Surg. 1994;31:933–1012. doi: 10.1016/0011-3840(94)90063-9. [DOI] [PubMed] [Google Scholar]
- 18.Jhiang SM, Smanik PA, Mazzaferri EL. Development of a single-step duplex RT-PCR detecting different forms of ret activation, and identification of the third form of in vivo ret activation in human papillary thyroid carcinoma. Cancer Letters. 1994;78:69–76. doi: 10.1016/0304-3835(94)90033-7. [DOI] [PubMed] [Google Scholar]
- 19.Jhiang M, Mazzaferri EL. The ret/PTC oncogene in papillary thyroid carcinoma. J Lab Clin Med. 1994;123:331–337. [PubMed] [Google Scholar]
- 20.Fabien N, Paulin C, Santoro M, Berger N, Grieco M, Galvain D, Barbier Y, Dubois PM, Fusco A. Detection of RET oncogene activation in human papillary thyroid carcinomas by in situ hybridisation. Br J Cancer. 1992;66:1094–1098. doi: 10.1038/bjc.1992.416. [DOI] [PMC free article] [PubMed] [Google Scholar]
- 21.Sozzi G, Bongarzone I, Miozzo M, Borrello MG, Butti MG, Pilotti S, Della Porta G, Pierotti MA. A t(10;17) translocation creates the RET/PTC2 chimeric transforming sequence in papillary thyroid carcinoma. Genes Chrom Cancer. 1994;9:244–250. doi: 10.1002/gcc.2870090404. [DOI] [PubMed] [Google Scholar]
- 22.Santoro M, Dathan NA, Berlingieri MT, Bongarzone I, Paulin C, Grieco M, Pierotti MA, Vecchio G, Fusco A. Molecular characterization of RET/PTC3; a novel rearranged version of the RET proto-oncogene in a human thyroid papillary carcinoma. Oncogene. 1994;9:509–516. [PubMed] [Google Scholar]
- 23.Weier HUG, Rhein AP, Shadravan F, Collins C, Polikoff D. Rapid physical mapping of the human trk proto-oncogene (NTRK1) gene to human chromosome 1q21–22 by P1 clone selection, fluorescence in situ hybridization (FISH) and computer-assisted microscopy. Genomics. 1995;26:390–393. doi: 10.1016/0888-7543(95)80226-c. [DOI] [PubMed] [Google Scholar]
- 24.Martin-Zanca D, Hughes SH, Barbacid M. A human oncogene formed by the fusion of a truncated tropomyosin and protein tyrosine kinase sequences. Nature. 1986;319:743–748. doi: 10.1038/319743a0. [DOI] [PubMed] [Google Scholar]
- 25.Coulier F, Martin-Zanca D, Ernst M, Barbacid M. Mechanism of activation of the human trk oncogene. Mol Cell Biol. 1989;9:15–23. doi: 10.1128/mcb.9.1.15. [DOI] [PMC free article] [PubMed] [Google Scholar]
- 26.Bounacer A, Schlumberger M, Wicker R, Du-Villard JA, Caillou B, Sarasin A, Suarez HG. Search for NTRK1 proto-oncogene rearrangements in human thyroid tumours originating after therapeutic radiation. Brit J Cancer. 2000;82:308–314. doi: 10.1054/bjoc.1999.0920. [DOI] [PMC free article] [PubMed] [Google Scholar]
- 27.Rzeszutko M, Rzeszutko W, Dziegiel P, Balcerzak W, Kaliszewski K, Bolanowski M. Expression of FAS/APO 1/CD 95 in thyroid tumors. Folia Histochem Cytobiol. 2007;45:87–91. [PubMed] [Google Scholar]
- 28.Ziad EA, Ruchala M, Breborowicz J, Gembicki M, Sowinski J, Grzymislawski M. Immunoexpression of TTF-1 and Ki-67 in a coexistent anaplastic and follicular thyroid cancer with rare long-life surviving. Folia Histochem Cytobiol. 2008;46:461–464. doi: 10.2478/v10042-008-0071-y. [DOI] [PubMed] [Google Scholar]
- 29.Pisarchik AV, Ermak G, Demidchik EP, Mikhalevich LS, Kartel NA, Figge J. Low prevalence of the ret/PTC3r1 rearrangement in a series of papillary thyroid carcinomas presenting in Belarus ten years post-Chernobyl. Thyroid. 1998;8:1003–1006. doi: 10.1089/thy.1998.8.1003. [DOI] [PubMed] [Google Scholar]
- 30.Zitzelsberger HF, Lehmann L, Hieber L, Weier HUG, Janish C, Fung J, Negele T, Spelsberg F, Lengfelder E, Demidchik E, Salassidis K, Kellerer AM, Werner M, Bauchinger M. Cytogenetic changes in radiation-induced carcinomas of the thyroid. Cancer Res. 1999;59:135–140. [PubMed] [Google Scholar]
- 31.Delabar JM, Sinet PM, Chadefaux B, Nicole A, Gegonne A, Stehelin D, Fridlansky F, Creau-Goldberg N, Turleau C, de Grouchy J. Submicroscopic duplication of chromosome 21 and trisomy 21 phenotype (Down syndrome) Hum Genet. 1987;76:225–229. doi: 10.1007/BF00283612. [DOI] [PubMed] [Google Scholar]
- 32.Gessler M, Poustka A, Cavenee W, Neve RL, Orkin SH, Bruns GA. Homozygous deletion in Wilms tumours of a zinc-finger gene identified by chromosome jumping. Nature. 1990;343:774–778. doi: 10.1038/343774a0. [DOI] [PubMed] [Google Scholar]
- 33.Weier HU. Cryptic translocations demystified: BAC-FISH assays resolve complex karyotypes in failed human reproduction and cancer. Folia Histochem Cytobiol. 2008;46:S5–S6. [Google Scholar]
- 34.Weier H-UG, Tuton TB, Ito Y, Chu LW, Lu CM, Baumgartner A, Zitzelsberger HF, Weier JF. Molecular cytogenetic characterization of chromosome 9-derived material in a human thyroid cancer cell line. Cytogenet Genome Res. 2006;114:284–291. doi: 10.1159/000094215. [DOI] [PubMed] [Google Scholar]
- 35.Lu CM, Wang M, Greulich-Bode K, Weier JF, Weier HUG. Quantitative DNA fiber mapping. In: Liehr T, editor. Springer FISH Lab Manual. Heidelberg, FRG: Springer Verlag; 2008. pp. 269–291. [Google Scholar]
- 36.Fiegler H, Carr P, Douglas EJ, et al. DNA microarrays for comparative genomic hybridization based on DOP-PCR amplification of BAC and PAC clones. Genes Chromosomes Cancer. 2003;36:361–374. doi: 10.1002/gcc.10155. [DOI] [PubMed] [Google Scholar]
- 37.Duell T, Nielsen LB, Jones A, Young SG, Weier H-UG. Construction of two near-kilobase resolution restriction maps of the 5′ regulatory region of the human apolipoprotein B gene by Quantitative DNA Fiber Mapping (QDFM) Cytogenet Cell Genet. 1998;79:64–70. doi: 10.1159/000134685. [DOI] [PubMed] [Google Scholar]
- 38.Lu C-M, Kwan J, Weier JF, Baumgartner A, Wang M, Escudero T, Munné S, Weier HUG. Rapid mapping of chromosomal breakpoints: from blood to BAC in 20 days. Folia Histochemica et Cytobiologica. 2009 doi: 10.2478/v10042-009-0067-2. (submitted) [DOI] [PMC free article] [PubMed] [Google Scholar]
- 39.Shizuya H, Birren B, Kim UJ, Mancino V, Slepak T, Tachiiri Y, Simon M. Cloning and stable maintenance of 300-kilobase-pair fragments of human DNA in Escheri-chia coli using an F-factor-based vector. Proc Natl Acad Sci USA. 1992;89:8794–8797. doi: 10.1073/pnas.89.18.8794. [DOI] [PMC free article] [PubMed] [Google Scholar]
- 40.Osoegawa K, Mammoser AG, Wu C, Frengen E, Zeng C, Catanese JJ, de Jong PJ. A bacterial artificial chromosome library for sequencing the complete human genome. Genome Res. 2001;11:483–496. doi: 10.1101/gr.169601. [DOI] [PMC free article] [PubMed] [Google Scholar]
- 41.Liehr T, Weise A, Heller A, Starke H, Mrasek K, Kuechler A, Weier HUG, Claussen U. Multicolor chromosome banding (MCB) with YAC/BAC-based probes and region-specific microdissection DNA libraries. Cytogenet Genome Res. 2002;97:43–50. doi: 10.1159/000064043. [DOI] [PubMed] [Google Scholar]
- 42.Lu C-M, Kwan J, Baumgartner A, Weier JF, Wang M, Escudero T, Munné S, Zitzelsberger HF, Weier HUG. DNA probe pooling for rapid delineation of chromosomal breakpoints. J Histochem Cytochem. 2009 doi: 10.1369/jhc.2009.953638. (published online 02-16-09) [DOI] [PMC free article] [PubMed] [Google Scholar]
- 43.Munné S, Grifo J, Cohen J, Weier H-UG. Mosaicism and aneuploidy in arrested human preimplantation embryos: a multiple probe fluorescence in situ hybridization (FISH) study. Am J Hum Genet. 1994;55:150–159. [PMC free article] [PubMed] [Google Scholar]
- 44.Cassel MJ, Munné S, Fung J, Weier H-UG. Carrier-specific breakpoint-spanning DNA probes for pre-implantation genetic diagnosis [PGD] in interphase cells. Hum Reprod. 1997;12:101–109. doi: 10.1093/humrep/12.9.2019. [DOI] [PubMed] [Google Scholar]
- 45.Fung J, Munné S, Weier H-UG. Detection of chromosome translocation products in single interphase cell nuclei. In: Darzynkiewicz Z, Chrissman HA, Robinson JP, editors. Methods in Cell Biology. Part B. 3. Vol. 64. San Diego: Academic Press; 2001. pp. 98–117. Cytometry. [DOI] [PubMed] [Google Scholar]