Abstract
Class Ia phosphoinositide (PI) 3-kinases are heterodimers composed of a regulatory and a catalytic subunit and are essential for the metabolic actions of insulin. In addition to p85α and p85β, insulin-sensitive tissues such as fat, muscle, and liver express the splice variants of the pik3r1 gene, p50α and p55α. Το define the role of these variants, we have created mice with a deletion of p50α and p55α by using homologous recombination. These mice are viable, grow normally, and maintain normal blood glucose levels but have lower fasting insulin levels. Results of an insulin tolerance test indicate that p50α/p55α knockout mice have enhanced insulin sensitivity in vivo, and there is an increase in insulin-stimulated glucose transport in isolated extensor digitorum longus muscle tissues and adipocytes. In muscle, loss of p50α/p55α results in reduced levels of insulin-stimulated insulin receptor substrate 1 (IRS-1) and phosphotyrosine-associated PI 3-kinase but enhanced levels of IRS-2-associated PI 3-kinase and Akt activation, whereas in adipocytes levels of both insulin-stimulated PI 3-kinase and Akt are unchanged. Despite this, adipocytes of the knockout mice are smaller and have increased glucose uptake with altered glucose metabolic pathways. When treated with gold thioglucose, p50α/p55α knockout mice become hyperphagic like their wild-type littermates. However, they accumulate less fat and become mildly less hyperglycemic and markedly less hyperinsulinemic. Taken together, these data indicate that p50α and p55α play an important role in insulin signaling and action, especially in lipid and glucose metabolism.
Class Ia phosphoinositide (PI) 3-kinases play an essential role in insulin stimulation of glucose transport and metabolism, protein and lipid synthesis, and cell growth and differentiation (4, 8, 13). The class Ia PI 3-kinases are heterodimers consisting of one regulatory and one catalytic subunit, each of which occurs in multiple isoforms. The family of the regulatory subunits includes p85α and its truncated splice variants p50α and p55α, as well as p85β and p55γ. The family of the catalytic subunits includes p110α, p110β, and p110δ (16).
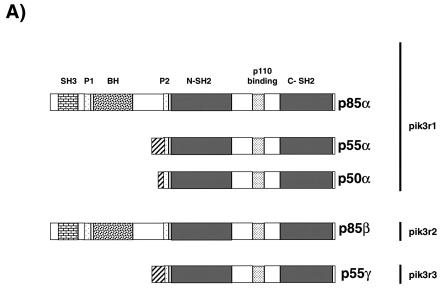
The regulatory subunits p85α, p50α, and p55α are all encoded by the pik3r1 gene and have identical C-terminal regions that include one proline-rich domain and two SH2 domains flanking the p110 binding site. These three regulatory subunits, however, differ in their N termini. p85α has a large N terminus containing one SH3 domain, a second proline-rich region, and a BCR homology domain; p55α has only a unique 34-amino-acid extension in its place; and p50α has an even shorter 6-amino-acid extension (1, 6, 10, 12). The gene product of the p85β gene is structurally similar to p85α, while that of the p55γ gene is similar to p55α (16).
The regulatory subunits of class Ia PI 3-kinase appear to play three important functional roles. They confer stability on the catalytic subunits, induce lipid kinase activity upon insulin stimulation (24), and in the basal state inhibit, to various degrees, the catalytic activity of the p110 subunits (18). Members of the regulatory subunit family also have distinct, but overlapping, tissue distributions. p85α and p85β are ubiquitously expressed (14), while p55γ is expressed mainly in brain (15). p50α and/or p55α is present in insulin-sensitive tissues including fat, muscle, liver, and brain (1, 10, 12). The unique structural domains of these regulatory subunits and their differential abundances in the tissues suggest that they may serve unique purposes and are not entirely redundant. Indeed, mice with a knockout of the full-length p85α exhibit an up-regulation of the splice variants p50α and p55α in muscle and fat tissues and have increased insulin sensitivity, suggesting that these variants are important signaling molecules for insulin action (17). By contrast, mice with complete deletion of p85α and its short splice variants p50α and p55α die perinatally with liver necrosis and enlarged muscle fibers (7). To directly assess the functions of p50α and p55α, we have created mice with a selective knockout of p50α and p55α. We find that the p50α/p55α knockout mice exhibit improved insulin sensitivity, lower fat masses, and protection against obesity-induced insulin resistance.
MATERIALS AND METHODS
Generation of p50α/p55α knockout mice.
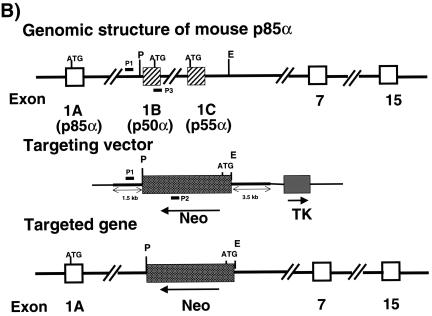
Mouse genomic clones containing exons 1B and 1C and their intervening intron as well as a 5′ 1.5-kb flanking sequence and a 3′ 3.5-kb flanking sequence were obtained by screening a 129-mouse genomic DNA library. The targeting construct was made in the pPNT vector by replacing the central PstI-Eco N1 genomic fragment encompassing exons 1B and 1C and the intron in between with an inverted neomycin cassette and retaining the 5′ and 3′ flanking regions for homologous recombination. The targeting construct also contained a thymidine kinase gene to facilitate selection for homologous recombination. The targeting vector was linearized and electroporated into J1 embryonic stem (ES) cells. Recombinant ES cell lines were screened by PCR with the following primer set: primer 1, 5′ CCC CCT TAC AAT GCC CTT CTC A 3′; primer 2, 5′ GGC TGA CCG CTT CCT CGT GCT TTA C 3′; and primer 3, 5′ TGC CAG TAT CCC ACA GAG AAA A 3′. Primers 1 and 2 were specific for the targeted allele, and primers 1 and 3 were specific for the endogenous allele. Positive p50α/p55α+/− ES clones were injected into C57BL/6/J blastocysts, which generated chimeric mice. Male chimeras were mated with C57BL/6/J females to produce p50α/p55α+/− offspring, which were intercrossed to produce p50α/p55α−/− mice. Animal experiments were carried out in compliance with institutional guidelines.
Metabolic measurements.
Randomly fed or fasting (12 to 14 h) mice were analyzed as indicated. Blood glucose levels were assayed with a glucometer (One Touch II; Lifescan Inc., Milipitas, Calif.). Serum insulin and leptin levels were measured by enzyme-linked immunosorbent assay with mouse insulin and leptin (Crystal Chem Inc., Chicago, Ill.), respectively, as standards. Serum triglyceride and glycerol levels were measured by the GPO-Trinder colorimetric enzyme assay (Sigma). Serum free fatty acid (FFA) levels were measured by an enzymatic colorimetric method (Wako Chemicals, Richmond, Va.). t test was used for statistical analysis.
Insulin and glucose tolerance test.
An insulin tolerance test was performed on fed mice by injecting human insulin (Eli Lilly Corp., Indianapolis, Ind.) intraperitoneally at a dose of 0.75 U/kg of body weight and determining blood glucose values at 0, 15, 30, and 60 min postinjection. A glucose tolerance test was performed on fasting (12 to 14 h) mice by injecting d-glucose intraperitoneally at a dose of 2 g/kg of body weight and determining blood glucose levels at 0, 15, 30, 60, and 120 min postinjection.
In vivo insulin stimulation and analysis of insulin signaling.
Six-month-old male mice fasted overnight and were anesthetized with pentobarbital and injected in the inferior venae cavae with 5 U of regular human insulin (Eli Lilly Corp.). Five minutes later, mouse tissues were harvested and frozen in liquid nitrogen. Immunoprecipitation and immunoblotting of insulin signaling molecules were performed on tissue homogenates prepared with ice-cold homogenization buffer containing 20 mM Tris-HCl (pH 7.4), 10 mM sodium vanadate, 50 mM sodium pyrophosphate, 100 mM sodium fluoride, 10 mM EDTA, 10 mM EGTA, 2 mM phenylmethylsulfonyl fluoride, 2 μM pepstatin A, 10 μg of aprotinin/ml, and 10 μM leupeptin. For immunoblotting, primary antibodies were used as indicated, followed by a horseradish peroxidase-conjugated secondary antibody (Pierce). All the Western blots were developed with ECL reagents (Amersham).
PI 3-kinase assay.
The immunoprecipitates from cell lysates were prepared with anti-phosphotyrosine 20 (PY 20; Santa Cruz), anti-insulin receptor substrate 1 (IRS-1; Santa Cruz), or anti-IRS-2 (Upstate Biotechnology), washed three times with homogenization buffer and twice with PI 3-kinase reaction buffer (20 mM Tris-HCl [pH 7.4], 100 mM NaCl, 0.5 mM EGTA), and suspended in 50 μl of PI 3-kinase reaction buffer containing 0.1 mg of PI (Avanti Polar Lipids)/ml. The reactions were performed and the phosphorylated lipids were separated by thin-layer chromatography as previously described (20).
Akt assay.
Tissue homogenates were subjected to immunoprecipitation with anti-Akt (Santa Cruz) followed by an in vitro kinase assay with crosstide as previously described (20). Briefly, the immunoprecipitates were washed and resuspended in 50 mM Tris-HCl (pH 7.5), 10 mM MgCl2, and 1 mM dithiothreitol. The kinase reaction was initiated by adding 20 μM ATP, 5 μCi of [γ-32P]ATP, and 5 μg of crosstide at room temperature. The reaction was terminated 20 min later by spotting an aliquot of the reaction mixture onto squares of P-81 paper and washing it with 0.5% phosphoric acid. Akt activity was quantified by measuring the retained radioactivity.
Isolation and characterization of adipocytes.
Animals were sacrificed, and epididymal fat pads were removed. Adipocytes were isolated by collagenase (1 mg/ml) digestion. Aliquots of adipocytes were fixed with osmic acid, and cells were counted in a Coulter counter (5). Adipocyte size was determined by dividing the lipid content of the cell suspension by the number of cells (5). For assessment of glucose transport, isolated adipocytes were stimulated with 80 nM insulin for 30 min and then incubated for 30 min with 3 μM U-[14C]glucose as previously described (18). For determination of PI 3-kinase and Akt activity, isolated adipocytes were stimulated with 80 nM insulin for 5 min, collected by dinonylphthalate floatation, and subjected to protein extraction as described earlier.
Determination of three different pathways of glucose metabolism was performed by using a 10% isolated fat cell suspension in the presence of 5 mM glucose containing 3 μM U-[14C]glucose. Glucose incorporated into triglycerides and CO2 was measured after 1 h of incubation in the absence or presence of 80 nM insulin as previously described (19). Glucose incorporated into lactate was measured after 1 h of incubation and after separation of lactate from glucose by using anion exchange columns (AG1-X8 resin; Bio-Rad).
Isolation and glucose transport in EDL and soleus muscles.
Mice fasted overnight before they were sacrificed, and the soleus and extensor digitorum longus (EDL) muscles were removed. Uptake of 2-deoxy-d-[1,2-3H]glucose was measured in the presence or absence of 100 nM insulin as previously described (3).
Determination of body composition and food intake and GTG treatment.
To determine body composition, mouse carcasses, upon removal of their gastrointestinal food contents, were weighed and digested in alcohol: 30% potassium hydroxide (2:1) at 60°C. Body lipid (triglyceride) content was determined by enzymatic measurement of glycerol (Sigma). To determine daily food intake, fresh normal chow of exact weight was provided to singly housed mice. The remainder of the chow was weighed the next day, and the difference was calculated as daily food intake. This process was repeated for the following 2 to 4 consecutive days. The average daily food intake was used for the final result. Gold thioglucose (GTG; Schering-Plough, Kenilworth, N.J.) administration was conducted by injecting 2-month-old mice intraperitoneally with a single dose of 0.5 mg of GTG/g of body weight in saline. Age-matched control mice were injected with saline only.
RESULTS
Generation of p50α/p55α knockout mice.
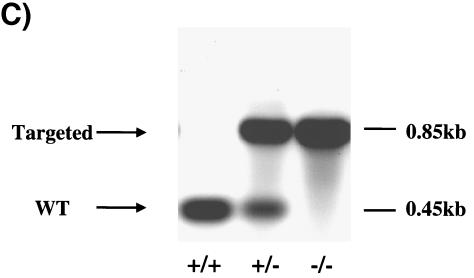
The PI 3-kinase regulatory subunit p85α and its two short splice variants p50α and p55α share a common C-terminal region transcribed by exons 7 through 15 that includes a proline-rich domain, a p110 catalytic subunit binding site, and two SH2 domains (Fig. 1A and B). Exon 1B and exon 1C are the respective upstream coding sequences for p50α and p55α, generating 6- and 34-amino-acid N-terminal short extensions. p85α utilizes exons 1 through 6 to code for its much larger N terminus, which contains one SH3 domain, a second proline-rich domain, and a BCR homology domain. By silencing exons 1B and 1C with conventional gene deletion methodology as described in Materials and Methods, we generated p50α/p55α homozygous knockout mice. They were genotyped by PCR (Fig. 1C), and the absence of expression of p50α and p55α was confirmed by Western blotting by using an anti-p85α pan antibody raised against the common N-SH2 domain (Fig. 2).
FIG. 1.
Gene targeting of the p50α/p55α locus. (A) Protein structures of the class Ia PI 3-kinase regulatory subunits. SH, Src homology; P, proline-rich region; BH, BCR homology. (B) Genomic structure of the mouse pik3r1 gene (top), targeting vector (middle), and targeted locus after homologous recombination (bottom). P, PstI; E, Eco N1; Neo, neomycin cassette; TK, thymidine kinase. P1, P2, and P3 are primers for genotyping. (C) PCR genotyping of tail DNA identifying wild-type (+/+), p50α/p55α+/−, and p50α/p55α−/− mice.
FIG. 2.
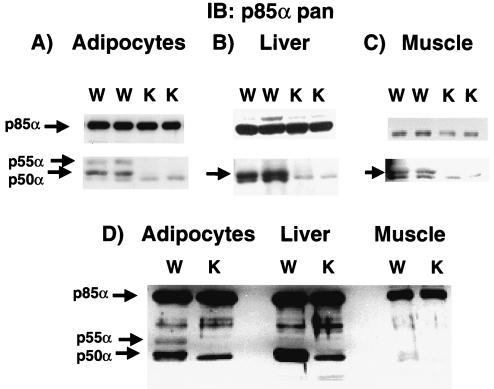
Tissue expression of p50α and p55α in wild-type mice and evidence of deletion in p50α/p55α knockout mice. Isolated adipocytes (A), livers (B), muscle extracts (C), and a combination of equal amounts of these tissues (D) prepared from wild-type (W) and knockout (K) mice were subjected to Western immunoblotting (IB) with anti-p85α pan antisera (Upstate Biotechnology, Inc.) raised against the common N-SH2 domain of p85α, p55α, and p50α.
In wild-type mice, the expression of both p50α and p55α was apparent in isolated adipocytes (Fig. 2A). In livers and muscles, however, only p50α expression was detected (Fig. 2B and C). As expected, neither p50α nor p55α was present in the corresponding tissues from p50α/p55α knockout mice. p85α protein levels remained unchanged in the knockout adipocytes and livers, whereas they decreased by 30% on average (P < 0.05) in the knockout muscles (Fig. 2A to C). To make a cross-tissue comparison of relative levels of expression of p85α, p50α, and p55α, we performed similar anti-p85α pan Western blottings with equal amounts of the above-mentioned tissue extracts (Fig. 2D). In order to visualize all the isoforms on the same blot, the p50α bands present in the wild-type adipocytes and livers and the p85α bands in all the samples were overly exposed since the isoforms showed significant disparity in signal intensities across the tissues. Nonetheless, it is apparent that the level of expression of p85α per unit of protein mass was lower in muscles than in adipocytes and livers. The level of p50α expression, on the other hand, was higher in adipocytes and livers than in muscles of the wild-type animals. p50α/p55α knockout mice were generated at the expected Mendelian frequency, indicating that deletion of p50α/p55α did not have a deleterious effect on animal viability. Moreover, during the first 6 months of life on a normal chow diet, both male and female knockout mice showed normal growth and weight gain indistinguishable from those of their wild-type littermates (data not shown).
Elevated insulin sensitivity in p50α/p55α knockout mice.
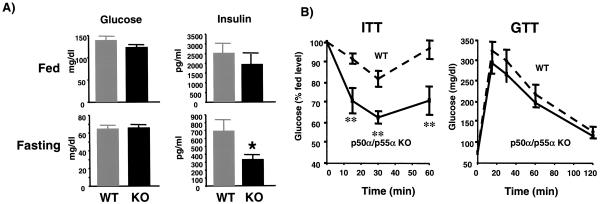
PI 3-kinase is essential for insulin-stimulated glucose transport and metabolism (4, 8, 13). To determine the impact of the deletion of p50α/p55α on glucose homeostasis, we measured blood glucose and insulin levels of the knockout and wild-type control mice in both randomly fed and fasting states. The glucose and insulin concentrations in fed mice and the glucose levels in fasting mice were not statistically different between the knockout and wild-type mice (Fig. 3A). In the fasting state, however, the knockout mice had significantly lower serum insulin concentrations (wild-type mice, 699 ± 138 pg/ml; knockout mice, 334 ± 55 pg/ml; P < 0.05) (Fig. 3A, bottom right panel), suggesting that the knockout mice had increased insulin sensitivity. Consistent with this notion, during the insulin tolerance test insulin had a greater glucose-lowering effect in the knockout mice than in the wild-type controls (Fig. 3B, left panel). On the other hand, the knockout and wild-type mice showed similar responses during the glucose tolerance test (Fig. 3B, right panel).
FIG. 3.
Increased in vivo insulin sensitivity in p50α/p55α knockout mice. (A) Glucose and insulin concentrations in randomly fed and fasting mice. Blood glucose (left panels) and insulin (right panels) concentrations were determined by tail bleeding in 5-month-old mice. Experimental groups consisted of 10 animals each. Values depict means ± standard errors of the means (SEM) (*, P < 0.05). WT, wild-type mice; KO, knockout mice. (B) Results of insulin tolerance tests (ITT) (left panel) and glucose tolerance tests (GTT) (right panel) for wild-type (WT) and p50α/p55α knockout (p50α/p55α KO) mice. Insulin and glucose tolerance tests were performed on 6-month-old mice with 0.75 U of insulin/kg of body weight and 2 g of glucose/kg of body weight, respectively. Each experimental group consisted of 10 animals. Values represent means ± SEM (**, P < 0.01).
Elevated glucose uptake and metabolism in muscle and fat tissues in p50α/p55α knockout mice.
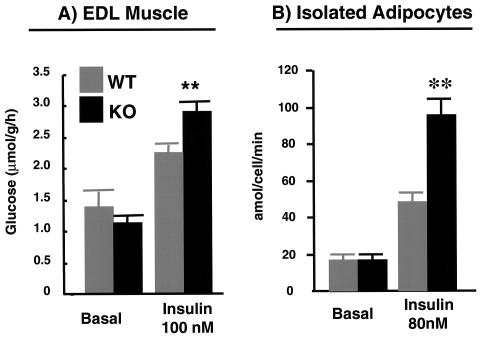
To determine the mechanism of improved insulin sensitivity in p50α/p55α knockout mice, we isolated EDL and soleus muscles and assessed their insulin-stimulated glucose uptake in vitro (Fig. 4). Although we did not observe any difference between the knockouts and wild types in either basal or insulin-stimulated glucose uptake in soleus muscles (data not shown), EDL muscles from the knockout mice exhibited significantly greater glucose uptake than their wild-type counterparts following insulin stimulation (Fig. 4A). Likewise, p50α/p55α knockout adipocytes had normal basal levels of glucose uptake, but their insulin-stimulated glucose uptake was double that of the wild-type cells (Fig. 4B).
FIG. 4.
Glucose transport in EDL muscles and isolated adipocytes. EDL muscle strips (A) and adipocytes (B) were isolated from wild-type (WT) and p50α/p55α−/− (KO) mice, and glucose transport activities were determined without (basal) or with insulin at the indicated concentrations. Four to six independent observations were made under each condition. Results shown are means ± SEM (**, P < 0.01).
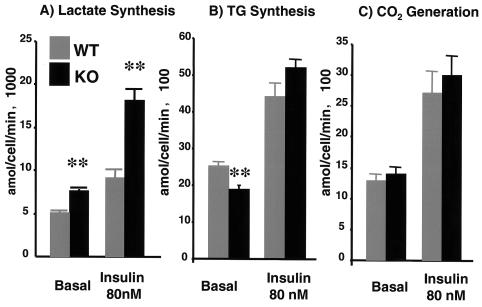
In addition to the increase in glucose uptake, adipocytes from p50α/p55α knockout mice showed altered glucose metabolism. Adipocytes from the knockout mice exhibited more robust glucose incorporation into lactate in both basal and insulin-stimulated states (Fig. 5A). By contrast, basal lipogenesis in the knockout adipocytes was slightly but significantly lower and insulin-stimulated lipogenesis was normal (Fig. 5B). Knockout and wild-type adipocytes showed no significant difference in basal and insulin-stimulated glucose oxidation levels (Fig. 5C). Taken together, these data indicate that in adipose tissues and EDL muscles of p50α/p55α knockout mice there is enhanced glucose uptake and in adipose tissues it is associated with altered glucose metabolism.
FIG. 5.
Breakdown of glucose metabolism into different pathways by using isolated adipocytes. Metabolism of glucose into lactate (A), triglyceride (TG) (B), and CO2 (C) was measured in isolated adipocytes from 4-month-old wild-type (WT) and p50α/p55α−/− (KO) mice without (basal) or with 80 nM insulin. Four independent observations were made under each condition. Results shown are means ± SEM (**, P < 0.01).
Insulin signaling in muscles and isolated adipocytes of p50α/p55α knockout mice.
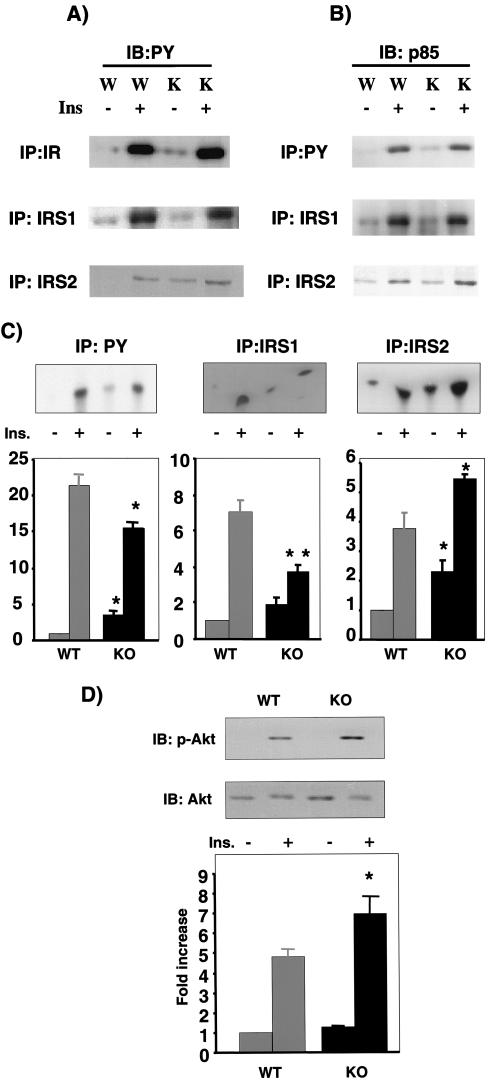
In an attempt to ascertain the molecular mechanism for enhanced glucose transport and metabolism in muscle and adipose tissues, we examined the early events linked to glucose transport, including protein tyrosine phosphorylation and activation of the PI 3-kinase/Akt pathway. In muscle, insulin stimulation resulted in comparable levels of tyrosine phosphorylation of the insulin receptor and IRS-1. In contrast, both basal and insulin-stimulated levels of IRS-2 tyrosine phosphorylation were elevated (Fig. 6A). Total IRS-1 and IRS-2 protein levels were largely unchanged in the p50α/p55α knockout muscle (data not shown). Levels of PY-associated p85α in the basal state were higher in the knockout muscle, and they were unchanged in the insulin-stimulated state (Fig. 6B, top panel). Basal and insulin-stimulated p85α association with IRS-1 was mostly unaffected by the deletion of p50α/p55α (Fig. 6B, middle panel). In contrast, levels of p85α associated with IRS-2 were enhanced under both basal and insulin-stimulated conditions (Fig. 6B, bottom panel), correlating with enhanced IRS-2 tyrosine phosphorylation. Total PY-associated PI 3-kinase activity in the basal state was significantly elevated in the knockout muscle by about threefold. Insulin-stimulated total PI 3-kinase activity, on the other hand, was reduced by 25% (21.5- ± 1.34-fold in wild-type tissue versus 15.6- ± 0.95-fold in knockout tissue over the wild-type basal activity; P < 0.05) (Fig. 6C, left panel). More detailed analysis of PI 3-kinase activation indicated that while the level of IRS-1-associated PI 3-kinase in the basal state remained largely unchanged, it was significantly reduced by 48% (7.1- ± 1.1-fold in wild-type tissue versus 3.7- ± 0.4-fold in knockout tissue over the wild-type basal level; P < 0.05) in the insulin-stimulated state in the knockout muscle (Fig. 6C, middle panel). By contrast, the level of IRS-2-associated PI 3-kinase was significantly enhanced in both basal (1-fold in wild-type tissue versus 2.3- ± 0.3-fold in knockout tissue over the wild-type basal level; P < 0.05) and insulin-stimulated (3.7- ± 1.0-fold in wild-type tissue versus 5.5- ± 0.1-fold in knockout tissue over the wild-type basal level; P < 0.05) states in the knockout muscle (Fig. 6C, right panel). Insulin-stimulated Akt phosphorylation was enhanced, and Akt kinase activity was increased by approximately 40% in the p50α/p55α knockout muscle (4.8- ± 0.4-fold in wild-type tissue versus 6.9- ± 0.9-fold in knockout tissue over the wild-type basal level; P < 0.05) (Fig. 6D). In isolated p50α/p55α knockout adipocytes, however, both basal and insulin-stimulated total PI 3-kinase activity and Akt phosphorylation and activation remained unaffected (data not shown).
FIG. 6.
Insulin signaling in muscles of wild-type (W) and p50α/p55α knockout (K) mice. Mice were injected with saline (−) or 5 U of insulin (+) via inferior venae cavae as described in Materials and Methods. (A) Muscle extracts were prepared and immunoprecipitated (IP) with anti-insulin receptor (IR; Santa Cruz), anti-IRS-1 (Santa Cruz), or anti-IRS-2 (Upstate Biotechnology) antibody. The immunoprecipitates were subjected to anti-PY (Transduction Laboratory) Western immunoblotting (IB). Ins, insulin. (B) Muscle extracts were immunoprecipitated with anti-PY (Santa Cruz), anti-IRS-1, or anti-IRS-2 antibody. The immunoprecipitates were subjected to anti-p85α pan (Upstate Biotechnology) Western immunoblotting. (C) Aliquots of the immunoprecipitates described in the legend to panel B were subjected to a PI 3-kinase assay. WT, wild-type mice; KO, knockout mice. (D) Muscle extracts were subjected to anti-phospho-Akt (Ser473) and anti-Akt (Cell Signaling Technology, Inc.) Western immunoblotting and an Akt in vitro kinase assay. The graphs in panels C and D depict the average activities in three to four animals of each genotype and condition. Results shown are means ± SEM (*, P < 0.05).
Reduced epididymal fat pad masses and fat cell lipid contents in p50α/p55α knockout mice.
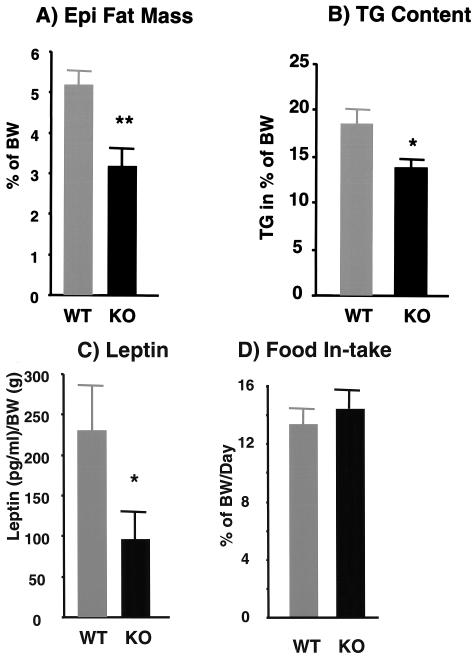
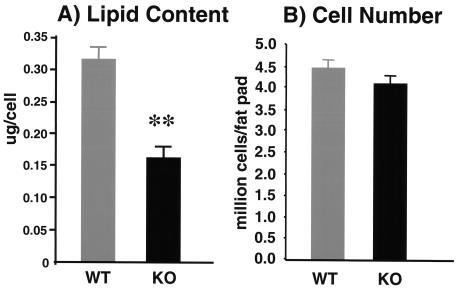
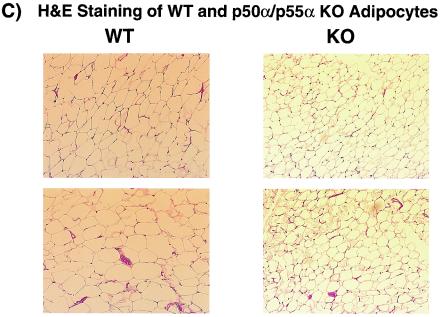
Reduced adiposity is associated with insulin sensitivity. Although p50α/p55α knockout mice and their wild-type counterparts had similar body weights, the knockout mice had a reduction of about 40% in the sizes of their fat pads (wild-type mice, 5.2% ± 0.34% of body weight; knockout mice, 3.20% ± 0.35% of body weight; P < 0.01) (Fig. 7A). Total body triglyceride levels were reduced by 25% (wild-type mice, 18.5% ± 1.5%; knockout mice, 13.8% ± 0.9%; P < 0.05) (Fig. 7B). Consistent with the reduced fat pad masses, fasting p50α/p55α knockout mice had 58% lower serum leptin levels (wild-type mice, 231 ± 60 pg/ml/g of body weight; knockout mice, 96 ± 34 pg/ml/g of body weight; P < 0.05) (Fig. 7C). This occurred with no significant change in food intake (Fig. 7D) or in levels of triglyceride, FFA, and glycerol in sera of fasting mice (Table 1). More detailed examination of isolated p50α/p55α knockout adipocytes revealed that they had lower lipid contents (wild-type adipocytes, 0.30 ± 0.02 μg/cell; knockout adipocytes, 0.17 ± 0.01 μg/cell; P < 0.01), i.e., smaller sizes (Fig. 8A), with no significant change in cell number (Fig. 8B). Hematoxylin and eosin staining of adipocytes confirmed that p50α/p55α knockout fat cells were indeed markedly smaller (Fig. 8C). The knockout and wild-type adipocytes, however, had similar levels of proteins GLUT4 and PPARγ (data not shown), suggesting that they did not differ in differentiation.
FIG. 7.
Epididymal (Epi) fat pad masses (n, 9 wild-type [WT] and 10 knockout [KO] mice) (A), total body triglyceride (TG) contents (n, 10 in each group) (B), serum leptin levels in fasting mice (n, 10 in each group) (C), and daily food intake (n, 10 wild-type and 6 knockout mice) (D) in 5-month-old wild-type and p50α/p55α knockout mice. All the measurements were normalized to body weights (BW) of individual mice, and the values are expressed as means ± SEM (*, P < 0.05; **, P < 0.01).
TABLE 1.
Levels of triglyceride, FFA, and Glycerol in fasting 4-month-old wild-type and p50α/p55α knockout micea
| Mouse group (n = 10) | Level of:
|
||
|---|---|---|---|
| TG (mg/dl) | FFA (mM) | Glycerol (mg/dl) | |
| WT | 49.9 ± 12.2 | 1.19 ± 0.08 | 44.2 ± 2.2 |
| KO | 49.9 ± 10.0 | 1.03 ± 0.02 | 40.6 ± 2.9 |
Abbreviations: WT, wild type; KO, knockout; TG, triglyceride.
FIG. 8.
Lipid contents (n, nine in each group) (A), cell numbers (n, nine wild-type and eight knockout mice) (B), and hematoxylin and eosin (H&E) staining (C) of isolated adipocytes from 5-month-old wild-type (WT) and p50α/p55α knockout (KO) mice. Values in panels A and B are expressed as means ± SEM (**, P < 0.01). In panel C, each field is a representative hematoxylin-and-eosin-stained image from a separate animal of the indicated genotype.
Resistance to obesity-induced hyperinsulinemia in p50α/p55α knockout mice.
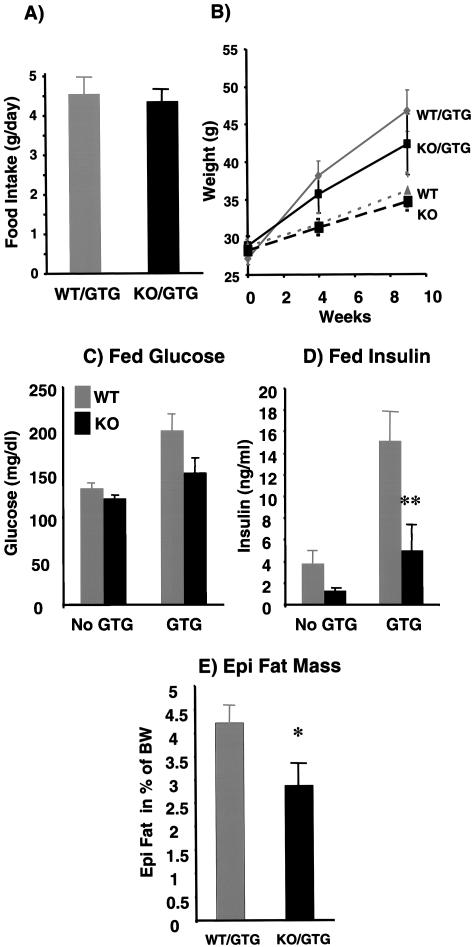
The hypothalamic toxin GTG induces hyperphagia and obesity and, as a result, insulin resistance in mice (2, 9). GTG-treated knockout mice and the wild-type control mice were similarly hyperphagic as indicated by daily food intake (Fig. 9A). The GTG-treated p50α/p55α knockout mice tended to diverge from the GTG-treated wild-type mice toward slower weight gain with time (Fig. 9B); however, this difference did not reach statistical significance during our study. Eight weeks after GTG injection, both the fed knockout and wild-type mice exhibited increases in glucose levels compared to their nontreated counterparts (Fig. 9C). The mean glucose levels of the GTG-treated knockout mice were mildly lower than those of the GTG-treated wild-type controls. More significantly, the insulin levels of fed GTG-treated knockout mice were substantially below those of the GTG-treated wild-type animals (15.2 ± 2.6 ng/ml for wild-type mice versus 5.0 ± 2.3 ng/ml for knockout mice; P < 0.01) (Fig. 9D). In addition, the GTG-treated knockout mice accumulated less epididymal fat than the GTG-treated wild-type mice (4.2% ± 0.4% of body weight for wild-type mice versus 2.9% ± 0.5% of body weight for knockout mice; P < 0.05) (Fig. 9E). Taken together, these data indicate that the p50α/p55α knockout mice were relatively protected against obesity-induced hyperinsulinemia and remained more insulin sensitive despite a hyperphagic challenge. These data also suggest that p50α and p55α are involved in regulating lipid synthesis and accumulation.
FIG. 9.
Effects of GTG on wild-type (WT) and p50α/p55α knockout (KO) mice. (A) Two-month-old wild-type (n = 9) and knockout (n = 9) mice were injected with 0.5 mg of GTG/g of body weight. Daily food intakes of GTG-treated wild-type and knockout mice were measured 6 weeks after injection. (B) Body weights of GTG-injected (n, nine in each group) and saline-injected control (n, six wild-type and nine knockout) mice were monitored for up to 9 weeks postinjection. (C and D) Glucose and insulin concentrations of fed mice were determined with GTG-injected mice and saline-injected control mice 8 weeks after GTG injection (**, P < 0.01). (E) Epididymal (Epi) fat pad masses normalized to body weights (BW) of the GTG-treated wild-type and knockout mice were determined 10 weeks after injection (*, P < 0.05). All values are expressed as means ± SEM.
DISCUSSION
Class Ia PI 3-kinases are heterodimers comprising a regulatory subunit and a catalytic subunit, each of which occurs in multiple isoforms. They are p85α, p85β, p50α, p55α, and p55γ for the regulatory subunits and p110α, p110β, and p110δ for the catalytic subunits (16). The class Ia PI 3-kinases mediate the actions of many hormones and growth factors and play a central role in the metabolic actions of insulin.
Although p85α and its splice variants p50α and p55α share common domains at their C termini, they differ in biochemical and signaling properties (20). For example, p50α and p55α have stronger affinity for p110, and p85α and p50α are more efficient than p55α in binding to tyrosine-phosphorylated IRS proteins. p85α and p55α, but not p50α, have a direct inhibitory effect on the p110α catalytic subunit, probably through an allosteric mechanism. Thus, overexpression of p85α and p55α, but not that of p50α, results in reduction of insulin-stimulated PY-associated PI 3-kinase, Akt, and p70S6 kinase activation and in inhibition of insulin-stimulated glucose transport. In addition, the in vivo stability of the p85α/IRS-1 protein complex differs from that of the p50α/IRS-1 protein complex (17). Furthermore, the unique N termini of p50α and p55α may target these subunits to distinct intracellular loci and allow them to mediate distinct subsets of PI 3-kinase-dependent signaling events. This notion is supported by the observation that, unlike p85α and p50α, p55α associates with microtubules as a result of the interaction between its N-terminal 34-amino-acid unique extension and tubulin (11). In addition, its unique N terminus allows p55α to interact with the tumor suppressor protein Rb and colocalize with it in the nuclei of certain cancer cells (23). Proteins specifically interacting with the unique N terminus of p50α, however, have yet to be identified.
Recent studies of the full-length-p85α-specific and p85α/p50α/p55α knockout mice have shed light on the functional specificity of p85α and its splice variants (7, 17). The full-length-p85α-specific knockout mice are hypoglycemic and very insulin sensitive and exhibit more active glucose transport in fat and muscle tissues, despite an impairment of insulin-stimulated PI 3-kinase activation. The lack of p85α expression leads to an up-regulation of p50α and p55α in fat and muscle tissues and enhanced and prolonged elevation of levels of insulin-stimulated PIP3 (phosphatidylinositol 3,4,5-trisphosphate) in adipocytes. This suggests that p50α and/or p55α is more effective than p85α in maintaining PIP3 stability and enhancing insulin signaling (20-22). When all of the products of the pik3r1 gene are deleted, the knockout mice die perinatally from such prominent defects as liver and brown fat necrosis, chylous ascites, and calcification of cardiac tissues. Within their short life spans, p85α/p55α/p50α knockout mice are hypoglycemic and hypoinsulinemic. Taken together, the data from these knockout studies suggest that p50α and p55α may play additional roles in glucose homeostasis and insulin signaling and are essential for animal survival.
To directly determine the functions of the p85α splice variants, we generated and characterized p50α/p55α knockout mice. These mice are viable and grow normally. p85α expression shows no change in liver and fat tissues of the knockout mice, and it is surprisingly reduced in muscle tissues. Thus, p50α and p55α are not required for survival, at least if the long form of p85α remains intact. p50α/p55α knockout mice, however, are more insulin sensitive as manifested by the significantly lower insulin levels in the fasting state and their improved insulin tolerance. This is associated with an increase in insulin-stimulated glucose transport in both isolated EDL muscles and isolated adipocytes from p50α/p55α knockout mice. It is unclear why there is no change in glucose uptake in soleus muscles. Relative balance between p85α and p50α in these two muscle types may contribute to this difference, as we observed that p85α is more abundant in the soleus muscles than in the EDL muscles of both the wild-type and knockout mice whereas p50α expression levels are comparable between the two muscle types (data not shown). In adipocytes, there is also an alteration of glucose metabolic pathways, resulting in more robust lactate synthesis and decreased basal lipogenesis. Consistent with this finding, adipocytes in p50α/p55α knockout mice are smaller in size and have lower lipid contents with no change in cell number, resulting in smaller epididymal fat pad masses.
Similar to what has been observed in p85β knockout mice (22), deletion of p50α/p55α also leads to enhanced IRS-2-associated PI 3-kinase activity and insulin activation of Akt in muscle. IRS-1-associated and total PY-associated PI 3-kinase activities, on the other hand, are significantly decreased. Total IRS-1 and IRS-2 protein levels in the knockout muscle are largely unchanged. Because IRS-1 is the dominant IRS protein in muscle, it is not surprising that insulin-stimulated IRS-1-associated PI 3-kinase levels and total PY-associated PI 3-kinase levels change in the same direction in the knockout muscle. Increased basal IRS-2 tyrosine phosphorylation and its associated PI 3-kinase activity, on the other hand, correlate with the higher basal total PI 3-kinase activity. p50α is the major short splice variant detected in muscle, and it exhibits the strongest associated PI 3-kinase activity among the three p85α isoforms upon insulin stimulation (12, 20). The decrease in total insulin-stimulated PI 3-kinase activity in p50α/p55α-deficient muscle suggests that under normal conditions coupling of the p50α-p110 dimer to tyrosine-phosphorylated IRS proteins contributes significantly to overall insulin-stimulated PI 3-kinase activity in muscle. It may also suggest that following insulin stimulation the amount of the p85α-p110 heterodimer available to bind to tyrosine-phosphorylated IRS proteins in the knockout muscle may become limited due to a reduction of the total pool of p85α and extra IRS docking sites vacated by the p50α-p110 heterodimer. Of course, this relative shortage of the p85α-p110 heterodimer created by these two factors may be alleviated to a certain degree by a more efficient coupling of p85α to p110 in the knockout tissue as discussed in the following.
Enhanced insulin-stimulated IRS-2-associated PI 3-kinase levels may be a contributor to increased Akt activation in the p50α/p55α knockout muscle. Another contributor may be a shift in the molecular balance between the p85α monomer and the p85α-p110 heterodimer. It was shown previously that in wild-type tissues the p85 subunit is more abundant than p110 and that the excess of the p85α and p55α monomers somehow leads to degradation of PIP3, probably through activation of lipid phosphatases, and inhibition of insulin activation of Akt (20, 21). Increased insulin-stimulated Akt activity in p50α/p55α-deficient muscle is consistent with these findings, as the loss of p50α resulted in more p85α-p110 dimer formation and fewer p85α monomers. The reduction in the total p85α protein level in the knockout muscle would help shift the balance even further, analogous to what has been observed in p85α/p50α/p55α heterozygous knockout cells (21). By coimmunoprecipitation, we indeed observed increased association of p85α with p110 in the p50α/p55α knockout muscle (data not shown).
Although both p50α and p55α are expressed in the wild-type adipocytes, neither PI 3-kinase nor Akt activity is affected in the p50α/p55α knockout cells. This tissue-specific effect of the p50α/p55α deletion on PI 3-kinase and Akt is in contrast to that of the p85α deletion, which results in a reduction of total PI 3-kinase activity in both muscle and adipocytes (17). One likely reason for the difference may be that p85α is the overwhelmingly dominant isoform, usually accounting for 70 to 80% of the total pool of the PI 3-kinase regulatory subunit (21, 22). On the other hand, similar tissue-selective up-regulation of Akt activity was observed in mice lacking p85β, which is another minor isoform of the regulatory subunit (22). Taking these findings together, we speculate that when the deleted regulatory isoform is normally minor in abundance, other factors, such as relative balance between it and other regulatory isoforms, intensity of insulin stimulation and resulting relative balance between the total PI 3-kinase heterodimers and phosphorylated IRS docking sites, and compensation by known p85 or unidentified p85-like molecules, may coordinately determine which tissue would be impacted in its PI 3-kinase and/or Akt activity. Increased insulin-stimulated glucose uptake without change in PI 3-kinase and Akt in the p50α/p55α knockout adipocytes is interesting, and we believe that a certain p50α/p55α-mediated, non-PI 3-kinase-dependent pathway(s) may be involved in regulating insulin sensitivity. We are currently investigating the pathway(s) to gain insights into unique functions of these splice variants.
The leanness and increased insulin sensitivity of p50α/p55α knockout mice are also manifested in their resistance to obesity-induced hyperglycemia and hyperinsulinemia following GTG injection. Although there is no difference in food intake following GTG injection, the GTG-treated knockout mice have reduced epididymal fat pad masses. Although increased insulin sensitivity is seen in other p85 knockout models (17, 22), such phenotypic changes as reduced adipocyte lipid contents and fat pad masses are either not present or not yet reported in those models and therefore may be unique to the p50α/p55α knockout mice.
Taken together, these findings suggest that p50α and p55α play important roles in metabolic signaling and may be new drug targets for obesity-induced insulin resistance. Defining the precise pathways uniquely mediated by these regulatory subunit isoforms remains an important area for further study.
Acknowledgments
We owe our gratitude to Beth Fletcher, Rebecca Quinn, Kelaine Chalkey, Katie Gartrell, and Laureen Mazzolla for their excellent technical assistance.
This work was supported by NIH grant DK55545-04 to C. R. Kahn and an American Diabetes Association Mentor-based fellowship to D. Chen.
REFERENCES
- 1.Antonetti, D. A., P. Algenstaedt, and C. R. Kahn. 1996. Insulin receptor substrate 1 binds two novel splice variants of the regulatory subunit of phosphatidylinositol 3-kinase in muscle and brain. Mol. Cell. Biol. 16:2195-2203. [DOI] [PMC free article] [PubMed] [Google Scholar]
- 2.Bergen, H. T., N. Monkman, and C. V. Mobbs. 1996. Injection with gold thioglucose impairs sensitivity to glucose: evidence that glucose-responsive neurons are important for long-term regulation of body weight. Brain Res. 734:332-336. [PubMed] [Google Scholar]
- 3.Bruning, J. C., M. D. Michael, J. N. Winnay, T. Hayashi, D. Horsch, D. Accili, L. J. Goodyear, and C. R. Kahn. 1998. A muscle-specific insulin receptor knockout exhibits features of the metabolic syndrome of NIDDM without altering glucose tolerance. Mol. Cell 2:559-569. [DOI] [PubMed] [Google Scholar]
- 4.Cheatham, B., C. J. Vlahos, L. Cheatham, L. Wang, J. Blenis, and C. R. Kahn. 1994. Phosphatidylinositol 3-kinase activation is required for insulin stimulation of pp70 S6 kinase, DNA synthesis, and glucose transporter translocation. Mol. Cell. Biol. 14:4902-4911. [DOI] [PMC free article] [PubMed] [Google Scholar]
- 5.Cushman, S. W., and L. B. Salans. 1978. Determinations of adipose cell size and number in suspensions of isolated rat and human adipose cells. J. Lipid Res. 19:269-273. [PubMed] [Google Scholar]
- 6.Fruman, D. A., L. C. Cantley, and C. L. Carpenter. 1996. Structural organization and alternative splicing of the murine phosphoinositide 3-kinase p85 alpha gene. Genomics 37:113-121. [DOI] [PubMed] [Google Scholar]
- 7.Fruman, D. A., F. Mauvais-Jarvis, D. A. Pollard, C. M. Yballe, D. Brazil, R. T. Bronson, C. R. Kahn, and L. C. Cantley. 2000. Hypoglycaemia, liver necrosis and perinatal death in mice lacking all isoforms of phosphoinositide 3-kinase p85 alpha. Nat. Genet. 26:379-382. [DOI] [PubMed] [Google Scholar]
- 8.Hara, K., K. Yonezawa, H. Sakaue, A. Ando, K. Kotani, T. Kitamura, Y. Kitamura, H. Ueda, L. Stephens, T. R. Jackson, et al. 1994. 1-Phosphatidylinositol 3-kinase activity is required for insulin-stimulated glucose transport but not for RAS activation in CHO cells. Proc. Natl. Acad. Sci. USA 91:7415-7419. [DOI] [PMC free article] [PubMed] [Google Scholar]
- 9.Heydrick, S. J., N. Gautier, C. Olichon-Berthe, E. Van Obberghen, and Y. Le Marchand-Brustel. 1995. Early alteration of insulin stimulation of PI 3-kinase in muscle and adipocyte from gold thioglucose obese mice. Am. J. Physiol. 268:E604-E12. [DOI] [PubMed] [Google Scholar]
- 10.Inukai, K., M. Anai, E. Van Breda, T. Hosaka, H. Katagiri, M. Funaki, Y. Fukushima, T. Ogihara, Y. Yazaki, M. Kikuchi, Y. Oka, and T. Asano. 1996. A novel 55-kDa regulatory subunit for phosphatidylinositol 3-kinase structurally similar to p55PIK is generated by alternative splicing of the p85alpha gene. J. Biol. Chem. 271:5317-5320. [DOI] [PubMed] [Google Scholar]
- 11.Inukai, K., M. Funaki, M. Nawano, H. Katagiri, T. Ogihara, M. Anai, Y. Onishi, H. Sakoda, H. Ono, Y. Fukushima, M. Kikuchi, Y. Oka, and T. Asano. 2000. The N-terminal 34 residues of the 55 kDa regulatory subunits of phosphoinositide 3-kinase interact with tubulin. Biochem. J. 346:483-489. [PMC free article] [PubMed] [Google Scholar]
- 12.Inukai, K., M. Funaki, T. Ogihara, H. Katagiri, A. Kanda, M. Anai, Y. Fukushima, T. Hosaka, M. Suzuki, B. C. Shin, K. Takata, Y. Yazaki, M. Kikuchi, Y. Oka, and T. Asano. 1997. p85alpha gene generates three isoforms of regulatory subunit for phosphatidylinositol 3-kinase (PI 3-Kinase), p50alpha, p55alpha, and p85alpha, with different PI 3-kinase activity elevating responses to insulin. J. Biol. Chem. 272:7873-7882. [DOI] [PubMed] [Google Scholar]
- 13.Okada, T., Y. Kawano, T. Sakakibara, O. Hazeki, and M. Ui. 1994. Essential role of phosphatidylinositol 3-kinase in insulin-induced glucose transport and antilipolysis in rat adipocytes. Studies with a selective inhibitor wortmannin. J. Biol. Chem. 269:3568-3573. [PubMed] [Google Scholar]
- 14.Otsu, M., I. Hiles, I. Gout, M. J. Fry, F. Ruiz-Larrea, G. Panayotou, A. Thompson, R. Dhand, J. Hsuan, N. Totty, et al. 1991. Characterization of two 85 kd proteins that associate with receptor tyrosine kinases, middle-T/pp60c-src complexes, and PI 3-kinase. Cell 65:91-104. [DOI] [PubMed] [Google Scholar]
- 15.Pons, S., T. Asano, E. Glasheen, M. Miralpeix, Y. Zhang, T. L. Fisher, M. G. Myers, Jr., X. J. Sun, and M. F. White. 1995. The structure and function of p55PIK reveal a new regulatory subunit for phosphatidylinositol 3-kinase. Mol. Cell. Biol. 15:4453-4465. [DOI] [PMC free article] [PubMed] [Google Scholar]
- 16.Shepherd, P. R., D. J. Withers, and K. Siddle. 1998. Phosphoinositide 3-kinase: the key switch mechanism in insulin signalling. Biochem. J. 333:471-490. [DOI] [PMC free article] [PubMed] [Google Scholar]
- 17.Terauchi, Y., Y. Tsuji, S. Satoh, H. Minoura, K. Murakami, A. Okuno, K. Inukai, T. Asano, Y. Kaburagi, K. Ueki, H. Nakajima, T. Hanafusa, Y. Matsuzawa, H. Sekihara, Y. Yin, J. C. Barrett, H. Oda, T. Ishikawa, Y. Akanuma, I. Komuro, M. Suzuki, K. Yamamura, T. Kodama, H. Suzuki, T. Kadowaki, et al. 1999. Increased insulin sensitivity and hypoglycaemia in mice lacking the p85 alpha subunit of phosphoinositide 3-kinase. Nat. Genet. 21:230-235. [DOI] [PubMed] [Google Scholar]
- 18.Tozzo, E., L. Gnudi, and B. B. Kahn. 1997. Amelioration of insulin resistance in streptozotocin diabetic mice by transgenic overexpression of GLUT4 driven by an adipose-specific promoter. Endocrinology 138:1604-1611. [DOI] [PubMed] [Google Scholar]
- 19.Tozzo, E., P. R. Shepherd, L. Gnudi, and B. B. Kahn. 1995. Transgenic GLUT-4 overexpression in fat enhances glucose metabolism: preferential effect on fatty acid synthesis. Am. J. Physiol. 268:E956-E964. [DOI] [PubMed] [Google Scholar]
- 20.Ueki, K., P. Algenstaedt, F. Mauvais-Jarvis, and C. R. Kahn. 2000. Positive and negative regulation of phosphoinositide 3-kinase-dependent signaling pathways by three different gene products of the p85alpha regulatory subunit. Mol. Cell. Biol. 20:8035-8046. [DOI] [PMC free article] [PubMed] [Google Scholar]
- 21.Ueki, K., D. A. Fruman, S. M. Brachmann, Y. H. Tseng, L. C. Cantley, and C. R. Kahn. 2002. Molecular balance between the regulatory and catalytic subunits of phosphoinositide 3-kinase regulates cell signaling and survival. Mol. Cell. Biol. 22:965-977. [DOI] [PMC free article] [PubMed] [Google Scholar]
- 22.Ueki, K., C. M. Yballe, S. M. Brachmann, D. Vicent, J. M. Watt, C. R. Kahn, and L. C. Cantley. 2002. Increased insulin sensitivity in mice lacking p85beta subunit of phosphoinositide 3-kinase. Proc. Natl. Acad. Sci. USA 99:419-424. [DOI] [PMC free article] [PubMed] [Google Scholar]
- 23.Xia, X., A. Cheng, D. Akinmade, and A. W. Hamburger. 2003. The N-terminal 24 amino acids of the p55 gamma regulatory subunit of phosphoinositide 3-kinase binds Rb and induces cell cycle arrest. Mol. Cell. Biol. 23:1717-1725. [DOI] [PMC free article] [PubMed] [Google Scholar]
- 24.Yu, J., Y. Zhang, J. McIlroy, T. Rordorf-Nikolic, G. A. Orr, and J. M. Backer. 1998. Regulation of the p85/p110 phosphatidylinositol 3′-kinase: stabilization and inhibition of the p110alpha catalytic subunit by the p85 regulatory subunit. Mol. Cell. Biol. 18:1379-1387. [DOI] [PMC free article] [PubMed] [Google Scholar]


