

Abstract
Structural chromosome aberrations are known hallmarks of many solid tumors. In the papillary form of thyroid cancer (PTC), for example, activation of the receptor tyrosine kinase (RTK) genes, ret or the neurotrophic tyrosine kinase receptor type I (NTRK1) by intra- or interchromosomal rearrangements have been suggested as a cause of the disease. The 1986 accident at the nuclear power plant in Chernobyl, Ukraine, led to the uncontrolled release of high levels of radioisotopes. Ten years later, the incidence of childhood papillary thyroid cancer (chPTC) near Chernobyl had risen by two orders of magnitude. Tumors removed from some of these patients showed aberrant expression of the ret RTK gene due to a ret/PTC1 or ret/PTC3 rearrangement involving chromosome 10. However, many cultured chPTC cells show a normal G-banded karyotype and no ret rearrangement. We hypothesize that the “ret-negative“ tumors inappropriately express a different oncogene or have lost function of a tumor suppressor as a result of chromosomal rearrangements, and decided to apply molecular and cytogenetic methods to search for potentially oncogenic chromosomal rearrangements in Chernobyl chPTC cases. Knowledge of the kind of genetic alterations may facilitate the early detection and staging of chPTC as well as provide guidance for therapeutic intervention.
Keywords: thyroid cancer, radiation, Chernobyl, gene expression, chromosome aberration, translocation
INTRODUCTION
The incidence of papillary thyroid carcinoma (PTC) (1) increases significantly after exposure of the head and neck region to ionizing radiation, yet the precise mechanisms involved in malignant transformation of thyroid epithelium are unknown (2). In 1986, an accident at the nuclear power plant in Chernobyl, Ukraine, led to the release of high levels of radioisotopes. Ten years later, the incidence of childhood papillary thyroid cancer (chPTC) near Chernobyl which averaged about 1 tumor incidence per 106 children per year prior to 1986 had risen by 2 orders of magnitude, most likely as a consequence of increased exposure to ionizing radiation (3-5).
The routes and mechanisms by which radiation generated these additional thyroid cancers remain mysterious. More than 15 years ago, we began to archive thyroid tumor tissues from patients who underwent thyroidectomy after living in regions exposed to high levels of radioactive fall-out from the power plant accident, among them 214 specimens from children (6). Several tumors from this collection aberrantly expressed ret tyrosine kinase (tk) transcripts due to a chromosomal rearrangements involving chromosome 10.
The ret/PTC oncogene is an activated form of the ret proto-oncogene, which maps to chromosome 10q11.2 and encodes a transmembrane RTK gene (7-8). Major types of ret activations such as ret/PTC1, ret/PTC2, or ret/PTC3 showed a rearrangements with one breakpoint in the relatively large intron 11 of RET and the downstream portion of the gene with its entire tk domain fused in frame with the 5′-part of a constitutively expressed gene (Fig.1A). The products of such, sometimes complex rearrangements which may involve more than two chromosomes produce a processed chimeric mRNA which leads to a hybrid protein with full tk activity, but loss of the ligand binding domain as well as trans-membrane regions (9).
Fig. 1.

The three major forms of ret activation by chromosomal rearrangement. A) The translocation breakpoint in the ret gene is between the transmembrane domain (TM) and the tyrosine kinase domain (TK). The tk domain is then fused in frame to an expressed sequence (H4, R1∞ or RFG/ele1). B) The ret/PTC1 translocation is a paracentric inversion fusing the 5′-end of ret to H4(D10S170) which is located more distal on the long arm of chromosome 10 (12).
The ret/PTC1 (Fig.1B) and ret/PTC3 oncogenes are caused by paracentric inversions on the long arm of chromosome 10 (9-10), while ret/PTC2 is caused by a reciprocal translocation t(10;17) (11). A common feature of activating rearrangements, the breakage of the ret gene within intron 11 upstream of the tk domain led us to propose a simple in situ hybridization protocol with breakpoint-flanking DNA probes for the rapid detection of rearrangements in single interphase cells (12). Application of this or a similar detection scheme has helped investigators so far to identify up to 15 different rearrangements of ret, with most of them in rather small patient cohorts (13-14).
However, a shortfall of some of the published FISH-based assays for detection of ret rearrangements in interphase cells is the low specificity of ‘probe overlap’ assays using probe or probe contigs which leave a gap between the 5′-end and the 3′-end of ret. An example of such incomplete coverage of the region of interest is the BAC-based approach described by Chen et al. Even when probes map only a few tens of kb apart, chromatin structure or decondensation combined with the effects of sample preparation may let the FISH signals appear separated by microns and being counted erroneously as ret rearrangements.
In addition, many chPTC tumors have phenotypes not attributable to aberrant ret expression or noticeable rearrangements of chromosome 10. Instead, most cells showed a normal G-banded karyotype. Moreover, even within a ret-positive chPTC tumor as determined by reverse transcript PCR (rt-PCR) analysis, not all cells express ret or contain a rearranged chromosome 10.
The human gene for NTRK1 encodes a signal transducing transmembrane neurotrophic receptor that is stimulated by nerve growth factor. This gene maps to chromosome 1 band q21-22 (15), and its expression in normal tissue is limited to neural-crest derived sensory neurons (16). Aberrant forms of NTRK1 are created by in-frame fusion of its tk domain with 5′-sequences of the human non-muscular tropomyosin gene (TPM3) have been found in colon and thyroid carcinomas (16-19). Like NTRK1, TPM3 also maps to chromosome 1q. We previously described some of our cytogenetic studies of chromosome 1 rearrangements in PTC (12, 20-21), and in this communication we will touch only briefly on these relatively rare changes involving the long arm of chromosome 1 in chPTC (18-19).
We hypothesize that classes of ret/PTC- or NTRK1 activation-negative tumors exist that inappropriately express a different oncogene or have lost function of a tumor suppressor as a result of chromosomal rearrangements. We also believe knowledge of the kind of genetic alterations leading to PTC may facilitate the early detection and staging of tumors as well as provide guidance for therapeutic intervention.
To further our goals, we followed two independent approaches: first, we applied an rt-PCR assay with mixed-based oligonucleotide primers for conserved regions of tk genes followed by product cloning and sequencing to generate a global overview of tk expression in four tumor specimens. Our second, FISH-based approach for karyotype analysis combines the high specificity of bacterial artificial chromosome (BAC)-derived DNA probes with the sensitive single-cell detection capability of FISH, thus enabling the rapid and unambiguous detection of small translocations, duplications and inversions necessary to identify and characterize occult translocations in PTC (21-22).
MATERIALS AND METHODS
Cell and tissue samples
Primary cell cultures and cell lines were prepared from PTC cases that arose following the 1986 nuclear accident in Chernobyl, Ukraine, and sporadic PTC cases as described (6). The case S48TK found particular interest due to its large number of unbalanced translocations. For gene expression studies, cells were seeded on cleaned, autoclaved glass slides and allowed to grow to 25-35% confluency, before they were fixed with 4% paraformaldehyde for 5 min and stored in 50% methanol.
Metaphase spreads were prepared from short-term cultures of lymphocytes from an anonymous normal male donor grown for 72 h in RPMI 1640 (Invitrogen, Carlsbad, CA) 10% fetal bovine serum, 1% penicillin/streptomycin and 2% phytohaemagglutinin (PHA, HA-15; Abbott Molecular, Inc, Des Plaines, IL) (23). Cells were blocked in mitosis by treatment with colcemid (0.12 μg/ml, Invitrogen, San Diego, CA) for 30 min. All cells were pelleted and incubated in 75 mM KCl for 15 min at 37°C. The cells were then spun down, and approximately 107 cells were fixed in three changes of acetic acid:methanol fixative (1:3, vol.:vol.). Finally, the cells were dropped on ethanol-cleaned glass slides and aged for a minimum of 1 week in ambient air at 20°C, sealed in plastic bags and stored at −20°C until used.
Molecular cloning of tyrosine kinase (tk) genes expressed in PTCs
We followed an RT-PCR approach with mixed base primers to identify expressed tk genes in PTC specimens and constructed cDNA libraries containing the catalytic domains of tk genes. The cDNA was prepared from tumor tissues by RNA isolation followed by oligo-dT primed reverse transcription. PCR amplification was then performed for 35 cycles using mixed base primers that bind to the conserved sequences of domains VII and IX of the tyrosine kinase genes (F-TYRK: 5′-GGGCGTCAGAARRTNRSNGAYTTYGG-3′; R-TYRK: 5′-GCGCGGGCCCRWANSHCCANACRTCNSA-3′) (23). Each cycle consisted of a denaturation step of 30 sec at 94°C, primer annealing at 53°C for 60 sec and primer extension for 120 sec at 72°C. Most PCR products appeared as a single broad band of the expected size (~160-170 bp). Reamplification of the PCR products with modified F-TYRK/R-TYRK primers designed to include deoxy-UMP residues and a Not1 restriction site at their respective 5′ends (F-TYRKU: 5′-CUACUACUACUAGCGGCCGCAARRTNRSNGAYTTYGG-3′; R-TYRK: 5′-CAUCAUCAUCAUGCGGCCGCCCRWANSHCCANACRTCNS-3′) resulted in PCR products of the expected size (about 190 bp) suitable for treatment with uracil DNA glycosylase (UDG) and cloning into pAMP1 (Gibco/LTI). Prior to UDG-treatment and annealing to the vector, PCR products were heated at 60°C for 10 min, placed on ice and purified (Biospin 30 column, Biorad, Hercules, CA) to remove nontemplate-derived products. Transformation was performed using MAX Efficiency DH5α competent cells (Gibco/LTI, Gaitherburg, MD). Cells were incubated overnight at 37°C on LB plates containing 100 μg/ml ampicillin, 50 μg/ml X-gal and 1 mM IPTG (Gibco/LTI).
The DNA from clones with 125-190 bp inserts was extracted and blotted on a Zeta-Probe nylon membrane (Biorad). The filters were screened with α(32P)dCTP-labeled probes prepared from known tk genes, such as previously sequenced tk-fragments. Only clones that did not hybridize with any of the known probes were sequenced. Dideoxysequencing using ABI instruments and fluorescent primers was performed at the University of California, Berkeley, Biochemical Core Facility on a recharge base.
Fluorescence in situ hybridization
All FISH experiments followed our previously published protocols (12, 15, 21). For initial screening of S48TK metaphases, we selected six BAC clones for the chromosome 9 from the Roswell Park Cancer Institute (RPCI) library RP11 (Table 1) using information in publicly available databases (http://genome.ucsc.edu/ and http://www.ncbi.nlm.nih.gov/gquery/gquery.fcgi) (25). For DNA isolation and preparation of DNA probes from individual clones, BAC DNA was isolated from 10 ml bacterial overnight cultures containing 12.5 μg/ml chloramphenicol (Sigma, St. Louis, MO) using an alkaline lysis protocol and precipitation in 2-propanol DNA (15, 20, 24). Then, the DNA was extracted once with phenol: chloroform, precipitated again with 2-propanol, and resuspended in 20-40 μl sterile water. The DNA concentrations were determined using a TKO100 instrument and Hoechst 33342 fluorometry (Hoefer, San Francisco, CA). The BAC-derived DNA (typically 1-2 μl of DNA in a 10 μl reaction) was labeled via random priming following the instruction of the kit manufacturer (BioPrime Kit, Invitrogen) incorporating biotin-14-dCTP (part of the BioPrime kit), digoxigenin-11-dUTP (dig-11-dUTP, Roche Molecular Biochemicals, Indianapolis, IN), fluorescein-12-dUTP (Roche Molecular Biochemicals), Cy5-dUTP (Amersham, Arlington Heights, IN) or Cy5.5-dCTP (Perkin Elmer, Wellesley, MA) (22) (Table 1).
Table 1.
Location of single BAC clones on chromosome 9
| Region | BAC clone | Start point (kb)a | End point (kb)a | BAC/gene size (bp)b |
|---|---|---|---|---|
| 9p21 | RP11-149I2 | 21,850 | 22,045 | 101,155 |
| 9p21 | RP11-57P14 | 27,143 | 27,313 | 101,445 |
| 9q13-q21 | RP11-386J22 | 72,040 | 72,220 | 182,427 |
| 9q21.13 | RP11-151D14 | 74,825 | 74,675 | 136,895 |
| 9q22-q31 | RP11-91D7 | 100,825 | 100,993 | 168,199 |
| 9q31.1 | RP11-413C10 | 106,405 | 106,587 | 182,012 |
Unique position information was estimated from the Human Genome Reference DNA Sequence, Mapviewer build 36.3 at http://www.ncbi.nlm.nih.gov/projects/mapview/
The insert sizes were taken from information available at the NCBI Clone Registry at http://www.ncbi.nlm.nih.gov/genome/clone/clname.cgi?stype=Id&list=209311&TransHist=0
The clones used to label specific regions of chromosome 9 were a subset of the Sanger Institute 1Mbp set (22, 26). A total of 150 BAC clones (50 and 100 clones for the short and long arms of chromosome 9, respectively) were grown overnight in 2 ml LB medium plus chloramphenicol each in 96-well plates (Becton Dickinson, San Jose, CA). The preparation of DNA probes representing BAC pools was performed in the way described for single clones with the following modification: 1 ml from each culture was combined in the desired pool, the cells were spun down, resuspended in 10 ml PBS containing 50 μg/ml lysozyme, and DNA was isolated and labeled as described above. Prior to hybridization of DNA probes to S48TK cells, all probes were tested on normal male metaphase spreads to ensure sufficient signal strength, and correct cytogenetic map positions (Table 2).
Table 2.
BAC pools for chromosome 9, their start and end positions as well as insert sizesa
| Pool | Clone | Start [bp] | End [bp] | Size [Mbp] |
|---|---|---|---|---|
| 9-1 | GS1-77L23 | 222308 | 336203 | 113895 |
| 9-1 | RP11-147I11 | 991152 | 1101150 | 109998 |
| 9-1 | RP11-66M18 | 1340595 | 1488472 | 147877 |
| 9-1 | RP11-48M17 | 2136364 | 2296360 | 159996 |
| 9-1 | RP11-320E16 | 2521111 | 2521805 | 694 |
| 9-1 | RP11-509J21 | 3533199 | 3696631 | 163432 |
| 9-1 | RP11-125K10 | 4819733 | 4991796 | 172063 |
| 9-1 | RP11-509D8 | 4911574 | 5121406 | 209832 |
| 9-1 | RP11-218I7 | 5993718 | 6146499 | 152781 |
| 9-1 | RP11-106A1 | 6566990 | 6567805 | 815 |
| 9-1 | RP11-283F6 | 7267032 | 7418276 | 151244 |
| 9-2 | RP11-283F6 | 7267081 | 7418295 | 151214 |
| 9-2 | RP11-29B9 | 7904520 | 8056890 | 152370 |
| 9-2 | RP11-175E13 | 8398615 | 8557610 | 158995 |
| 9-2 | RP11-527D15 | 9657611 | 9823754 | 166143 |
| 9-2 | RP11-19G1 | 9932073 | 10130653 | 198580 |
| 9-2 | RP11-23D5 | 11170428 | 11341967 | 171539 |
| 9-2 | RP11-352F21 | 11389658 | 11588107 | 198449 |
| 9-2 | RP11-446F13 | 12225005 | 12396287 | 171282 |
| 9-2 | RP11-187K14 | 12819715 | 13004078 | 184363 |
| 9-2 | RP11-413D24 | 13729630 | 13912935 | 183305 |
| 9-2 | RP11-408A13 | 14419816 | 14586697 | 166881 |
| 9-3 | RP11-490C5 | 15219945 | 15401987 | 182042 |
| 9-3 | RP11-109M15 | 16141186 | 16325481 | 184295 |
| 9-3 | RP11-132E11 | 16987010 | 17148443 | 161433 |
| 9-3 | RP11-123J20 | 17839221 | 18013839 | 174618 |
| 9-3 | RP11-503K16 | 18579957 | 18743091 | 163134 |
| 9-3 | RP11-513M16 | 19310518 | 19506748 | 196230 |
| 9-3 | RP11-15P13 | 20172465 | 20351121 | 178656 |
| 9-3 | RP11-113D19 | 21157685 | 21158452 | 767 |
| 9-3 | RP11-149I2 | 21851433 | 22046818 | 195385 |
| 9-3 | RP11-11J1 | 22479595 | 22579721 | 100126 |
| 9-4 | RP11-495L19 | 23376562 | 23557443 | 180881 |
| 9-4 | RP11-33K8 | 24090721 | 24243438 | 152717 |
| 9-4 | RP11-468C2 | 24877888 | 25069382 | 191494 |
| 9-4 | RP11-33G16 | 25690187 | 25853227 | 163040 |
| 9-4 | RP11-5P15 | 26681234 | 26681720 | 486 |
| 9-4 | RP11-27J8 | 27417088 | 27590261 | 173173 |
| 9-4 | RP11-20P5 | 28027075 | 28204449 | 177374 |
| 9-4 | RP11-264J11 | 28840514 | 28840768 | 254 |
| 9-4 | RP11-383F6 | 29089125 | 29250390 | 161265 |
| 9-4 | RP11-48L13 | 29493271 | 29639053 | 145782 |
| 9-5 | RP11-2G13 | 30199650 | 30364698 | 165048 |
| 9-5 | RP11-573M23 | 34323596 | 34407345 | 83749 |
| 9-5 | RP11-395N21 | 35284076 | 35428177 | 144101 |
| 9-5 | RP11-421H8 | 36088495 | 36279930 | 191435 |
| 9-5 | RP11-220I1 | 37065972 | 37242474 | 176502 |
| 9-5 | RP11-113O24 | 38261089 | 38427295 | 166206 |
| 9-5 | RP11-138L21 | 39175643 | 39294206 | 118563 |
| 9-5 | RP11-38P6 | 42614658 | 42703483 | 88825 |
| 9-5 | RP11-111G23 | 42933608 | 43076412 | 142804 |
| 9-6 | RP11-274B18 | 68358409 | 68528389 | 169980 |
| 9-6 | RP11-265B8 | 68778953 | 68779698 | 745 |
| 9-6 | RP11-109D9 | 69487306 | 69676572 | 189266 |
| 9-6 | RP11-141J10 | 70528528 | 70677340 | 148812 |
| 9-6 | RP11-563H8 | 71314567 | 71465298 | 150731 |
| 9-6 | RP11-429L21 | 72321408 | 72481088 | 159680 |
| 9-6 | RP11-71A24 | 72848317 | 73017346 | 169029 |
| 9-6 | RP11-401G5 | 73624112 | 73796829 | 172717 |
| 9-6 | RP11-66O21 | 75439414 | 75440255 | 841 |
| 9-6 | RP11-422N19 | 76090213 | 76253493 | 163280 |
| 9-7 | RP11-490H9 | 76861448 | 77031282 | 169834 |
| 9-7 | RP11-336N8 | 77969998 | 77970521 | 523 |
| 9-7 | RP11-174K23 | 78534808 | 78716286 | 181478 |
| 9-7 | RP11-362L2 | 79355248 | 79356032 | 784 |
| 9-7 | RP11-280K20 | 80042734 | 80187829 | 145095 |
| 9-7 | RP11-384P5 | 80182461 | 80364063 | 181602 |
| 9-7 | RP11-66D1 | 80991481 | 81138354 | 146873 |
| 9-7 | RP11-432M2 | 82008792 | 82208346 | 199554 |
| 9-7 | RP11-541F16 | 82662629 | 82822736 | 160107 |
| 9-7 | RP11-439A18 | 83330646 | 83525574 | 194928 |
| 9-8 | RP11-292F10 | 83899162 | 83988222 | 89060 |
| 9-8 | RP11-59M22 | 84220295 | 84377175 | 156880 |
| 9-8 | RP11-172F7 | 85287618 | 85288314 | 696 |
| 9-8 | RP11-280P22 | 85960413 | 86094507 | 134094 |
| 9-8 | RP11-276H19 | 86827154 | 86980390 | 153236 |
| 9-8 | RP11-423O13 | 86923188 | 87098245 | 175057 |
| 9-8 | RP11-40C6 | 87248292 | 87415074 | 166782 |
| 9-8 | RP11-249H20 | 87325937 | 87486007 | 160070 |
| 9-8 | RP11-65B23 | 87486049 | 87654534 | 168485 |
| 9-8 | RP11-345K9 | 87869665 | 88066130 | 196465 |
| 9-9 | RP11-176L21 | 88644066 | 88799441 | 155375 |
| 9-9 | RP11-8B23 | 89927165 | 89927994 | 829 |
| 9-9 | RP11-555F9 | 90225650 | 90402024 | 176374 |
| 9-9 | RP11-440G5 | 91210454 | 91381302 | 170848 |
| 9-9 | RP11-19J3 | 92321634 | 92489352 | 167718 |
| 9-9 | RP11-30L4 | 93288305 | 93459139 | 170834 |
| 9-9 | RP11-333I7 | 94415600 | 94590889 | 175289 |
| 9-9 | RP11-279I21 | 94473904 | 94655715 | 181811 |
| 9-9 | RP11-435O5 | 95213051 | 95402627 | 189576 |
| 9-9 | RP11-160D19 | 95433765 | 95598231 | 164466 |
| 9-10 | RP11-240L7 | 96060259 | 96229878 | 169619 |
| 9-10 | RP11-23J9 | 97120587 | 97286003 | 165416 |
| 9-10 | RP11-23B15 | 97623563 | 97784334 | 160771 |
| 9-10 | RP11-92C4 | 98644256 | 98794171 | 149915 |
| 9-10 | RP11-192E23 | 98744783 | 98745226 | 443 |
| 9-10 | RP11-96L7 | 98922778 | 99098674 | 175896 |
| 9-10 | RP11-547C13 | 99270898 | 99449952 | 179054 |
| 9-10 | RP11-463M14 | 99548194 | 99709828 | 161634 |
| 9-10 | RP11-463M14 | 99548222 | 99709762 | 161540 |
| 9-10 | RP11-208F1 | 100050139 | 100197864 | 147725 |
| 9-11 | RP11-80H12 | 100788649 | 100957646 | 168997 |
| 9-11 | RP11-75J9 | 101521451 | 101680519 | 159068 |
| 9-11 | RP11-318L4 | 103254007 | 103418980 | 164973 |
| 9-11 | RP11-185E13 | 103623573 | 103794095 | 170522 |
| 9-11 | RP11-31J20 | 104568352 | 104754723 | 186371 |
| 9-11 | RP11-287A8 | 105223738 | 105396654 | 172916 |
| 9-11 | RP11-540H22 | 106247901 | 106435604 | 187703 |
| 9-11 | RP11-438P9 | 107357324 | 107357981 | 657 |
| 9-11 | RP11-400A24 | 108279653 | 108468171 | 188518 |
| 9-11 | RP11-388N6 | 109146376 | 109360971 | 214595 |
| 9-12 | RP11-470J20 | 109953950 | 110131864 | 177914 |
| 9-12 | RP11-202G18 | 110955506 | 111132187 | 176681 |
| 9-12 | RP11-570D4 | 111731038 | 111917067 | 186029 |
| 9-12 | RP11-88M9 | 112540764 | 112727061 | 186297 |
| 9-12 | RP11-534I8 | 113659179 | 113845753 | 186574 |
| 9-12 | RP11-78H18 | 114647112 | 114805811 | 158699 |
| 9-12 | RP11-279J9 | 114917908 | 115093107 | 175199 |
| 9-12 | RP11-445L6 | 114960260 | 115162581 | 202321 |
| 9-12 | RP11-445L6 | 114981548 | 115162653 | 181105 |
| 9-12 | RP11-382H18 | 115128372 | 115297394 | 169022 |
| 9-13 | RP11-404K23 | 115288454 | 115472575 | 184121 |
| 9-13 | RP11-58C3 | 115951715 | 116121055 | 169340 |
| 9-13 | RP11-67K19 | 116408159 | 116563591 | 155432 |
| 9-13 | RP11-388N2 | 117294858 | 117470365 | 175507 |
| 9-13 | RP11-451E16 | 118116160 | 118310814 | 194654 |
| 9-13 | RP11-574M5 | 118953289 | 119134969 | 181680 |
| 9-13 | RP11-28O4 | 119071486 | 119072140 | 654 |
| 9-13 | RP11-360A18 | 119775925 | 119958173 | 182248 |
| 9-13 | RP11-165P4 | 120891105 | 121069469 | 178364 |
| 9-13 | RP11-477J21 | 120973024 | 121178266 | 205242 |
| 9-14 | RP11-429D3 | 121691418 | 121864392 | 172974 |
| 9-14 | RP11-137O6 | 122808959 | 122994424 | 185465 |
| 9-14 | RP11-417B4 | 123491878 | 123688856 | 196978 |
| 9-14 | RP11-101K10 | 124167663 | 124330481 | 162818 |
| 9-14 | RP11-269P11 | 125271849 | 125447742 | 175893 |
| 9-14 | RP11-205K6 | 126296031 | 126460599 | 164568 |
| 9-14 | RP11-373J8 | 127282486 | 127499995 | 217509 |
| 9-14 | RP11-545E17 | 128541257 | 128707904 | 166647 |
| 9-14 | RP11-202H3 | 129858645 | 130045763 | 187118 |
| 9-15 | RP11-57C19 | 130510169 | 130683466 | 173297 |
| 9-15 | RP11-83J21 | 130670998 | 130857947 | 186949 |
| 9-15 | RP11-143H20 | 130881497 | 131058128 | 176631 |
| 9-15 | RP11-5N16 | 132007228 | 132007771 | 543 |
| 9-15 | RP11-295G24 | 132650995 | 132860166 | 209171 |
| 9-15 | RP11-153P4 | 133571331 | 133750415 | 179084 |
| 9-15 | RP11-399H11 | 135198232 | 135419560 | 221328 |
| 9-15 | RP11-83N9 | 136207935 | 136362829 | 154894 |
| 9-15 | RP11-417A4 | 137679200 | 137871989 | 192789 |
| 9-15 | GS1-135I17 | 138168343 | 138274031 | 105688 |
All information was provided by the Welcome Trust Sanger Centre.
Our FISH protocols were based on separate denaturation of probes and DNA targets (22). Briefly, we combined 1 μl of each probe (typically 20-300 ng of labeled DNA), 1-4 μl of human COT-1™ DNA (1 mg/ml, Invitrogen), 1 μl of salmon sperm (SS) DNA (10 mg/ml, Invitrogen) and 7 μl of a hybridization master mix so that the final mixture contained 55% formamide (FA)(Invitrogen), 10% dextran sulfate in 2x SSC, pH 7.0 (20x SSC is 3 M sodium chloride, 300 mM tri-sodium citrate) (21, 24). If more than three probes were combined, we precipitated the probes, SS DNA and COT-1™ DNA in 2-propanol, and resuspended the pellet in 3 μl water prior to addition of and the hybridization master mix. The mixture was denatured at 76°C for 10 min and incubated for 30 min at 37°C to pre-anneal blocking DNA with probes. At this time, the slides were denatured for 4 min at 76°C in 70% FA/2x SSC, pH 7.0, dehydrated in a 70%, 85%, 100% ethanol series for 2 min each step, and air dried. Ten microliters of the hybridization mixture was pipetted on to the cells, covered with a 22×22 mm2 coverslip and sealed with rubber cement. Hybridization of a cDNA probe prepared by random priming of DNA isolated from the IMAGE Consortium cDNA clone ID 49318 (Research Genetics, Huntsville, AL) containing the NTRK1 cDNA followed the above protocol, except that paraformaldehyde-fixed cells were attached to slides.
Following overnight hybridization at 37°C, the slides were washed two or three times in 50% FA/2x SSC at 45°C for 10 min each followed by two washes in 2x SSC at 21°C on a shaking platform. Cells were then incubated 5 min in PNM (5% nonfat dry milk, 1% sodium azide in PN buffer (0.1 M Na phosphate buffer, pH 8.0, 1% Nonidet-P40 (Sigma))) at 21°C, before bound non-fluorescent probes were detected with fluorescein-conjugated avidin DCS (Vector, Burlingame, CA) or anti-digoxigenin-rhodamine (Roche). Finally, the slides were mounted in 4,6-diamidino-2-phenylindole (DAPI) (0.5 μg/ml; Calbiochem, La Jolla, CA) in antifade solution (24). Spectral Karyotyping analysis was performed with commercially available probes (Applied Spectral Imaging, Inc., Carlsbad, CA) and an SD200 Cytogenetics workstation (ASI) following the manufacturer’s instructions (6, 22).
Image acquisition and analysis
Fluorescence microscopy was performed on a Zeiss Axioskop microscope equipped with filter sets (single or triple color or 84000v2 Quad, ChromaTechnology, Brattleboro, VT) for observation of Cy5, Cy5.5, Texas Red, Cy3.5/rhodamine, FITC, DAPI. Images were collected using a CCD camera (VHS Vosskuehler, Osnabrueck, FRG) and processed using Adobe Photoshop® software (Adobe Inc., Mountain View, CA).
Mouse xenografts
Fifty thousand S48TK cells suspended in 50 μl of type I collagen gel were grafted beneath the kidney capsule of athymic mice. After 2 weeks, the mice were euthanized and tumor tissues were harvested. Prostate cancer cells lines were used as positive controls. All animal protocols were reviewed and approved by the Institutional Animal Care and Use Committee (IACUC), Vanderbilt University (protocol # M/01/312).
RESULTS
Molecular profiling of tk genes expressed in PTCs
We analyzed a total of 795 recombinant clones with 473 of them partially sequenced and complete sequences obtained from 441 clones. DNA sequences were analyzed using the programs FASTA, BLASTX and BEAUTY to identify clones that contained known tyrosine kinase genes. In total, we identified 44 different tyrosine kinase genes among 441 sequences. In addition, 81 clones contained inserts that did not possess sufficient homology (>70%) to be assigned to known tk genes. However, simulated transcription using the computer program DNA STRIDER generated bona fide tk gene-like amino acid sequences in 35 cases. DNA sequence alignments were performed using the ‘ClustalW Multiple Sequence Alignment Program’ and the ‘HUSAR’ program package (DKFZ, Heidelberg) to determine the relationship among these sequences. At least three transcripts were cloned for which STRIDER suggested tk- like amino acid sequences, but genes could be identified by BLAST. About 10% of the sequenced clones (i.e., 46 sequences) appeared to contain PCR or cloning artifacts. Raw sequences were used to select clones for pre-screening.
Case S50TK exemplifies the efficiency of our approach. Pre-screening of the first set of clones with 10 previously identified transcripts under normal stringency was only somewhat sufficient to identify previously characterized insert sequences and sequencing demonstrated the presence of ABL, UFO and FLG transcripts. The second cycle testing an additional 172 recombinant clones showed a significant number of BRK transcripts, a gene reported to be over-expressed in breast cancers and melanomas (27). When a third cycle involving the analysis of 96 more clones from case S50TK included BRK among 19 different probes in prescreening, 40 clones were selected for sequencing leading to 11 (~27 %) additional tk sequences with no BLAST hits. The list of tk genes identified by the expression profiling contained several sequences reported to have transforming activity, such as C-MER/mertk, UFO/AXL and BRK (27-28) (Table 3). However, no ret transcripts were found. Furthermore, since the rt-PCR assays generated only one tk-tag-per-transcript, they could not discriminate between wild-type and mutated genes.
Table 3.
Identification of TK genes expressed in PTC tissues
| Case | Patient age/gender |
Clones analyzed/ sequenced |
Tyrosine kinase genes (Number of identical clones)* |
Prescreen |
|---|---|---|---|---|
| S42TK | 37/male | 33/31 | C-ABL(1), C-YES(1), ECK(1), FLG(1), FYN (7), JAK1 (1), MKK3(1), NET(1), PDGF(1), SRC (1), V-ABL(1),UFO(11), not tk gene (3) |
None |
| S42TK | 37/male | 33/18 | C-SYN(5), FLG(2), JAK1(2), MKK3(3), PDGF(1), unidentified (2), not tk gene (3) |
4 Probes: C-ABL, FLG, NET, UFO |
| S47TK | 13/female | 90/76 | C-SYN(1), C-YES(1), FER(1), FYN(10), HLA-A(1), JAK1(2), MKK3(24), NET(1), PDGF(5), SRC(2), UFO(14), V-ABL(4), unidentified (4), not tk gene (6) |
None |
| S47TK | 13/female | 18/9 | C-SYN(4), EGF(2), JAK1 (1), MKK3(2) unidentified (0), |
4 Probes: C-ABL, FLG, NET, UFO |
| S50TK | 16/female | 72/68 | CLK3(1), C-ABL(1), C-SYN(3), C-YES(1), ECK(1), FAK2/PYK2(2), FLG(3), HEK8(1), HSBITPTK(2), HSIGFERR(2), HUMTYRKIN(3), JAK1(3), JAK3(3), KIAA0204(1), LCK(1), MEK(1), MKK3(4), MLK(2), SRC(1), TYK2(2), TYRO3(3), UFO(7), V-ABL(4), unidentified (8), not tk gene (8) |
10 Probes: C-ABL, C-YES, ECK, FLG, FYN, JAK1, MKK3, NET, PDGF, UFO |
| S50TK | 16/female | 172/85 | BRK(16), C-MER(4), FAK2/PYK2(1), FGR(1), HEK8(5), HSBITBTK(1), HSIGFIRR(1), HSLK/KIAA0204(1), HSU07349(1), HUMPKSCD(1), HUMTYRKIN(8), IRR(1), LCK(1), MEK3(2), MLK(3), NTK16/JAK3(3), PYK2(2), SPRK(1), TEK(1), TIE(2), TYK2(5), TYRO3(6), UFO(2), V-ABL(1), unidentified (8), not tk gene (7) |
12 Probes: C-ABL, C-SYN, C-YES, ECK, FLG, FYN, JAK1, MKK3, NET, PDGF, UFO, V-ABL |
| S50TK | 16/female | 96/40 | C-FMS(1), C-MER(1), C-SRC(2), EPH(3), FGR(1), HEK8(3), HSBITPTK(1), HSIGFIRR(1), HUMP4K(1), LCK(1), LYN(1), MLK3(2), PYK2/FAK2(1), TIE(1), TYK2(1), TYRO3(1), V-ABL/ARG(1), unidentified(11), not tk gene (6) |
19 Probes: BRK,C- ABL,C-SYN,C- YES,ECK,FER,FLG, FYN,HLA-A,JAK1, JAK3, MEK, MKK3, NET, PDGF, PYK2/FAK2, TYRO3P, UFO, V- ABL/ARG |
| S145TK | 23/female | 55/20 | C-FMS(1), C-MER(4),JAK1(2),LYN(1),MET(1), PYK2/FAK2(2),RON(1),TIE (2),TYK(1),TYRO3(1) ,UFO/AXL(1),V-ABL/ARG(1), Unidentified(1), not tk gene (1) |
10 Probes: C-ABL, C- YES, ECK, FLG, FYN, JAK1, MKK3, NET, PDGF, UFO |
Unidentified: no BLAST hits in Genbank; not TK gene: other type of DNA sequence (repeat etc.)
At this point, we decided to apply molecular cytogenetic techniques to search for activating rearrangements. Case S48TK seemed to be an interesting candidate for this type of investigation due to its large number of chromosomal rearrangements.
Karyotype analysis
By G-banding (data not shown) or SKY analysis (Fig. 2A), the cell line S48TK had shown numerous translocations among them several complex translocations including two marker chromosomes, m1 and m2, that carried chromosome 9 derived material (6, 20, 22). Our SKY analysis suggested that m1 is the product of a t(7;9;15), while m2 might have been the results of insertion of chromosome 9 material into a der(8)t(8;15) (Fig. 2A).
Fig. 2.
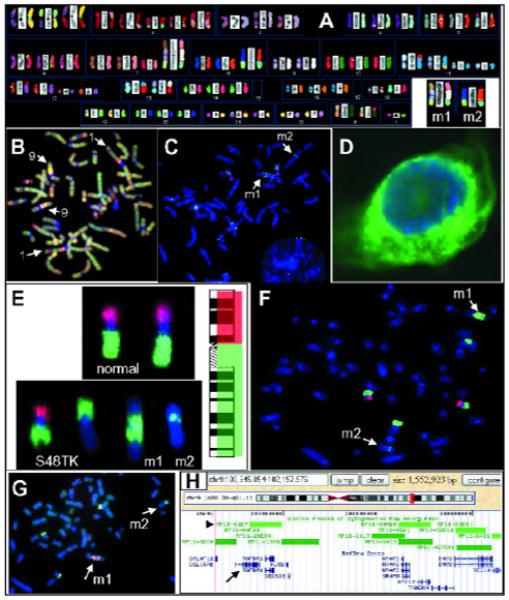
FISH analysis of the PTC cell line S48TK. A) The SKY analysis demonstrated several rearranged chromosomes. The insert in the lower right corner shows the two complex marker chromosomes (m1, m2), which we analyzed. B) The results of CGH analysis suggest copy number changes along chromosomes 1 and 9. C) Hybridization of individual BAC-derived DNA probes suggests that markers m1 and m2 do not contain a significant portion of the short arm of chromosome 9, but gene duplication on m1. D) The in situ hybridization of a cDNA probe for NTRK-1 shows strong signals in the cytoplasm of S48TK cells. E-G) Our BAC-FISH approach to find occult translocations, rapidly characterize markers and delineate breakpoint regions. E) BAC clones were pooled such that all probes mapping to either the short or long arm of chromosome 9 were labeled with the same reporter molecule. F) Very clean hybridizations to S48TK metaphase cells support the notion that markers m1 and m2 carry only chromosome 9 material, which stems from the long arm. G) Hybridization of differently-labeled probes from the region at the interphase of pools 9-10 and 9-11 demonstrated signals of these BAC probes on m1 and well as m2. H) In silico analysis. The region apparently translocated to m2 is shown in the viewer of the UCSC Genome Browser window (25).
In addition, our interest in rearrangements of the long arm of chromosome 1 was initiated by the observation that several derivative chromosomes carried chromosome 1-derived material. The proximal long arm of chromosome 1 harbors the NTRK1 and TPM3 genes, and comparative genomic hybridization (CGH) indicated extra copies of the proximal region of chromosome1q besides an amplification on 9q (Fig. 2B). A preliminary molecular cytogenetic analysis of rearrangements involving the long arm of chromosome 1 in cell line S48TK has been published recently (20). Hybridization of BAC probes that bound either proximal or distal of the two candidate genes NTRK1 and TPM3 could demonstrate two marker chromosomes, one that appear to carry an inversion of the critical region between 144 Mbp and 155 Mbp, while the second marker chromosome showed hybridization pattern indicative of multiple copies of the same region (20). Further fine mapping and delineation of the chromosome 1-specific breakpoints has been initiated. Hybridization of a biotinylated cDNA probe for NTRK1 showed strong, most cytoplasmic signals in S48TK cells grown on slides (Fig. 2D), which supports the hypothesis that rearrangements in this cell line led to abnormal NTRK1 expression.
An initial hybridization used of six arbitrarily chosen BAC-derived DNA probes that cluster pairwise in three locations: on the short arm of chromosome 9 at 9p21 roughly between 21.850 Mbp and 27.313 Mbp (visualized in red), the proximal long arm of chromosome 9 around or the distal long arm of chromosome 9 (both loci detected with avidin-FITC, green fluorescence) (Table 1). The FISH results (Fig. 2C) indicated two copies of a der(9) with material from 9p as well as 9q indicated by the presence of one red and two green signal domains representing the locus under test on the short and long arm of chromosome 9, respectively. Besides highlighting a der(?)t(?;9), which carried chromosome 9 material, this hybridization experiment also delivered first clues about the composition of the marker chromosomes, m1 and m2 (Fig. 2C, arrows). As the metaphase spread in Fig. 2C shows, the marker m2 contained only DNA from one of the loci on chromosome 9q (only 1 pair of green signal domains), while the metaphase chromosome m1 showed four pairs of signals indicative of a duplicated region containing both regions from 9q13-21 and 9q22-31 (Table 1).
The hybridization of locus-specific BAC probes and observation of green FISH signals on the marker chromosomes presented strong evidence for the presence of DNA from chromosome 9q on markers m1 and m2 (Fig. 2A), but a more systematic approach was needed to delineate the breakpoints, and eventually identify genes with altered expression at or near the translocation breakpoints. We decided to cover the entire euchromatic part of human chromosome 9 with BAC probes that bind on average every 600-700 kb apart. From the Sanger Center BAC 1Mbp set (26), we selected 50 clones that map to the short arm of chromosome 9, and 100 clones that map to the long arm (Table 2). The 150 BAC clones were arrayed in 96-well microtiter plates so that the most distal clone on the short arm of chromosome 9 was placed in position A1 and each row (also called ‘pool’) contained between 8 and 11 clones that mapped into an interval of several megabasepairs (22). Two 96-well plates were sufficient to hold all 150 clones. To expedite the characterization of the marker chromosomes, we labeled the five pools that map to the short arm of chromosome 9 (Table 2, pools 9-1 to 9-5) with digoxigenin. Pools 9-6 to 9-15 that map to the long arm were combined and labeled with biotin. All probes were then combined in one hybridization mixture. Hybridization of these chromosome 9 arm-specific probes onto normal metaphase chromosomes showed the desired effect of painting the short and long arms in red and green, respectively (Fig. 2E, top), while hybridization of the same probes to S48TK metaphase spreads revealed four different types of chromosomes with material from chromosome 9, among them the markers m1 and m2 (arrow in Fig. 2E, bottom). Again, the FISH results suggested that the markers m1 and m2 contained no material derived from chromosome 9p. A representative result of FISH analysis of a S48TK metaphase spread is shown in Fig. 2F. Hybridization of individual pools allowed us to narrow the chromosome 9 material on m2 to DNA from pools 9-10 and 9-11 (not shown) (22). Thus, in only two overnight hybridizations, the origin of the small insert could be narrowed down from chromosome 9 (about 138 Mbp) to the long arm of chromosome 9 (about 93 Mbp) to a pair of BAC pools (12.7 Mbp).
To characterize the marker chromosomes with even higher resolution, we selected four BAC clones from the interface between pools 9-10 and 9-11. The DNAs isolated from clones RP11-96L7 and RP11-547C13 covering the area from 98.923 Mb to 99.450 Mb (Table 2) were labeled with biotin and detected with avidin-FITC (green). The DNAs isolated from clones RP11-463M14 and RP11-208F1 covering the area from 99.548 Mb to 100.198 Mb (Table 2) were labeled with digoxigenin and detected with anti-digoxigenin antibodies conjugated to rhodamine (red). Marker m2 showed a single green domain, while marker m1 showed more than 2 domains that had bound red as well as green probes (Fig. 2G). Thus, the chromosomal region amplified on marker m1 seems to be larger than the chromosome 9-derived fragment on marker m2. The next step in our investigation will be the characterization of expressed sequences in the interval flanked by clones RP11-96L7 and RP11-208F1, which requires integration of information from slightly different databases namely the Sanger Center BAC database, the NIH/NCBI Human Genome map and the information available through the www interface at the University of California, Santa Cruz, (UCSC) Genome Browser (25). A first look at the region chromosome 9:100.645-102.198 Mb on the UCSC Genome browser showed that the transforming growth factor beta receptor 1 (TGFBR1) (Fig. 2H, arrow) gene maps to this region as well as BAC clone RP11-91D7 (Fig. 2H, arrow), which we had hybridized initially.
Our mouse xenograft studies underlined the aggressive growth behavior of S48TK cells. Twenty kidney capsule xenografts of S48TK formed 20 rapidly growing tumors (100%) in athymic mice, while a parallel xenograft of TPC-1 cells (12) failed to grow.
DISCUSSION
Driven by a desire to understand how human cancer is linked to radiation, we decided to investigate the chromosomal and genetic changes in thyroid cancer tissues obtained from a special cohort of patients: children who lived in regions contaminated by the 1986 nuclear accident in Chernobyl, Ukraine. There have been speculations about the role of iodine deficiency or ionizing radiation in the genesis of thyroid tumors, but the precise mechanisms underlying the progression of normal thyroid epithelium to benign thyroid disease (for example, goiters or adenomas) to carcinomas or a direct malignant transformation of normal epithelium are unknown. Specific chromosomal rearrangements such as the ret/PTC oncogenes or a TMP3-NTRK1 fusion gene product have been suggested as a cause of malignant transformation of thyroid epithelium, yet many tumors do not show either abnormality.
Recent reports suggested that the aberrant expression of genes involved in apoptosis or cell proliferation may play an important role in the malignant transformation of benign thyroid neoplasms or the progression of well differentiated thyroid cancer to the much more aggressive anaplastic carcinomas (29-31). This and other interesting observations involving tyrosine kinase genes such as the family of Aurora kinases or a Polo1-like kinase in this transformation still await confirmation in larger study cohorts (32-33).
When we began our studies on chPTC specimens, we ask whether 1. the cell lines form tumors in nude mice, 2. the cells express tk genes in a way that might explain their phenotype, and 3. whether the analysis of metaphase spreads will reveal chromosomal changes that provide leads to the identification of activated oncogenes. Certainly, cell line S48TK forms aggressively growing tumors, is aneuploid and carries multiple translocations. Thus, S48TK appears to be an interesting cellular system to study genetic changes and their consequences in radiation-related PTC.
Our expression profiling of tk genes generated a wealth of information about expressed tk genes and signaling cascades that are involved in the transmission of extracellular proliferation and differentiation signals to their intracellular targets including the mitogen-activated protein kinase (MAPK) pathway (34). But expression profiling hardly gets to the root of the problem, i.e., which cis- or trans-acting factor is responsible for abnormal expression. Another shortfall of RNA expression profiling of cells cultured in vitro is the fact that results are easily affected by culture conditions, which, in a similar fashion, is also true for profiling growth factors in serum before or after physical exercise (35). Thus, if one assumes that misrepaired, radiation-induced double-strand DNA breaks initiated the post-Chernobyl thyroid cancer cases, a molecular cytogenetic search for chromosomal alterations appears to be a more promising route to identification of the genetic changes underlying chPTC, and ultimately devising strategies for molecular intervention of the disease (33, 36).
Routine laboratory techniques for karyotype analyses are based on Giemsa (G)-banding, whole chromosome painting (WCP) or Spectral Karyotyping (SKY). These techniques are likely to fail to detect deletions or translocations smaller than ~10 Mbp, i.e., roughly the size of a chromosome band. However, fluorescence in situ hybridization (FISH) with locus-specific DNA probes is sensitive enough to tag specific DNA sequences in interphase or metaphase cells. Our FISH-based approach for karyotype analysis combines the high specificity of bacterial artificial chromosome (BAC)-derived DNA probes with the sensitive single-cell detection capability of FISH, thus enabling the rapid and unambiguous detection of small translocations, duplications and inversions necessary to identify and characterize occult translocations in chPTC (20).
For more than a decade, our laboratories have been involved in the preparation of breakpoint-specific probes and assays (12, 37-40). Initially, we used probes prepared from yeast artificial chromosome (YAC) clones, and it took on average 8-10 week to prepare probes suitable for interphase analysis (37). The availability of annotated BAC libraries has greatly facilitated the task of breakpoint mapping, so that breakpoint-spanning or -flanking BAC clones can often been isolated in less than 3 weeks (41).
A straightforward application of in situ hybridization experiments using BAC pools for decreasing sizes of genomic intervals rapidly led to the identification of TGFRB1 as a candidate kinase in the development or progression of PTC. The precise role of TGFBR1 in chPTC progression and contributions from other members of the TGF-beta family of growth factors and receptors, which are involved in many cellular processes such as proliferation and apoptosis (42-43), will require further investigations.
Acknowledgements
This work was supported in parts by NIH grants CA80792, CA88258, CA123370, and HD45736, and a grant from the Director, Office of Energy Research, Office of Health and Environmental Research, U.S. Department of Energy, under contract DE-AC02-05CH11231. JFW was supported in part by NIH grant HD41425 and a grant from the UC Discovery Program, which also supported AB. We gratefully acknowledge the support from staff and students at LBNL and the Helmholtz Zentrum Muenchen. We also like to express our thanks to the scientists at the Human Genome Center, California Institute of Technology, Pasadena, and the Wellcome Trust Sanger Institute, Cambridge, UK, especially the Chromosome 9 Mapping Group, whose generosity made these studies possible.
Parts of this work have been presented at the 13th Congress of the International Federation of Societies for Histochemistry and Cytochemistry (ICHC2008), Medical University of Gdansk, Poland, August 27-30, 2008.
Footnotes
Disclaimer: This document was prepared as an account of work sponsored by the United States Government. While this document is believed to contain correct information, neither the United States Government nor any agency thereof, nor The Regents of the University of California, nor any of their employees, makes any warranty, express or implied, or assumes any legal responsibility for the accuracy, completeness, or usefulness of any information, apparatus, product, or process disclosed, or represents that its use would not infringe privately owned rights. Reference herein to any specific commercial product, process, or service by its trade name, trademark, manufacturer, or otherwise, does not necessarily constitute or imply its endorsement, recommendation, or favoring by the United States Government or any agency thereof, or The Regents of the University of California. The views and opinions of authors expressed herein do not necessarily state or reflect those of the United States Government or any agency thereof, or The Regents of the University of California.
Conflict of interests: None declared.
REFERENCES
- 1.Chang JKC. Papillary carcinoma of thyroid: classical and variants. Histol Histopathol. 1990;5:241–257. [PubMed] [Google Scholar]
- 2.Farid NR, Shi Y, Zou M. Molecular basis of thyroid cancer. Endocrine Rev. 1994;15:202–232. doi: 10.1210/edrv-15-2-202. [DOI] [PubMed] [Google Scholar]
- 3.Baverstock K, Egloff B, Pinchera A, Ruchti C, Williams D. Thyroid cancer after Chernobyl. Nature. 1992;359:21–22. doi: 10.1038/359021b0. [DOI] [PubMed] [Google Scholar]
- 4.Kazakov US, Demidchik EP, Astakhova LN. Thyroid cancer after Chernobyl. Nature. 1992;369:21. doi: 10.1038/359021a0. [DOI] [PubMed] [Google Scholar]
- 5.Nikiforov YE. Radiation-induced thyroid cancer: what we have learned from Chernobyl. Endocrine Pathol. 2006;17:307–318. doi: 10.1007/s12022-006-0001-5. [DOI] [PubMed] [Google Scholar]
- 6.Zitzelsberger HF, Lehmann L, Hieber L, et al. Cytogenetic changes in radiation-induced carcinomas of the thyroid. Cancer Res. 1999;59:135–140. [PubMed] [Google Scholar]
- 7.Bongarzone I, Pierotti MA, Monzini N, et al. High frequency of activation of tyrosine kinase oncogenes in human papillary thyroid carcinoma. Oncogene. 1989;4:1457–1462. [PubMed] [Google Scholar]
- 8.Jhiang M, Mazzaferri EL. The ret/PTC oncogene in papillary thyroid carcinoma. J Lab Clin Med. 1994;123:331–337. [PubMed] [Google Scholar]
- 9.Pierotti MA, Santoro M, Jenkins RB, et al. Characterization of an inversion on the long arm of chromosome 10 juxtaposing D10S170 and RET and creating the oncogenic sequence RET/TPC. Proc Natl Acad Sci USA. 1992;89:1616–1620. doi: 10.1073/pnas.89.5.1616. [DOI] [PMC free article] [PubMed] [Google Scholar]
- 10.Jhiang SM, Smanik PA, Mazzaferri EL. Development of a single-step duplex RT-PCR detecting different forms of ret activation, and identification of the third form of in vivo ret activation in human papillary thyroid carcinoma. Cancer Lett. 1994;78:69–76. doi: 10.1016/0304-3835(94)90033-7. [DOI] [PubMed] [Google Scholar]
- 11.Sozzi G, Bongarzone I, Miozzo M, et al. A t(10;17) translocation creates the RET/PTC2 chimeric transforming sequence in papillary thyroid carcinoma. Genes Chrom Cancer. 1994;9:244–250. doi: 10.1002/gcc.2870090404. [DOI] [PubMed] [Google Scholar]
- 12.Jossart GH, Greulich KM, Siperstein AE, et al. Molecular and cytogenetic characterization of a t(1;10;21) translocation in the human papillary thyroid cancer cell line TPC-1 expressing the ret/H4 chimeric transcript. Surgery. 1995;118:1018–1023. doi: 10.1016/s0039-6060(05)80108-4. [DOI] [PubMed] [Google Scholar]
- 13.Cinti R, Yin L, Ilc K, et al. RET rearrangements in papillary thyroid carcinomas and adenomas detected by interphase FISH. Cytogenet Cell Genet. 2000;88:56–61. doi: 10.1159/000015485. [DOI] [PubMed] [Google Scholar]
- 14.Chen F, Clark DP, Hawkins AL, Morsberger LA, Griffin CA. A break-apart fluorescence in situ hybridization assay for detecting RET translocations in papillary thyroid carcinoma. Cancer Genet Cytogenet. 2007;178:128–134. doi: 10.1016/j.cancergencyto.2007.07.006. [DOI] [PubMed] [Google Scholar]
- 15.Weier HUG, Rhein AP, Shadravan F, Collins C, Polikoff D. Rapid physical mapping of the human trk proto-oncogene (NTRK1) gene to human chromosome 1q21-22 by P1 clone selection, fluorescence in situ hybridization (FISH) and computer-assisted microscopy. Genomics. 1995;26:390–393. doi: 10.1016/0888-7543(95)80226-c. [DOI] [PubMed] [Google Scholar]
- 16.Martin-Zanca D, Hughes SH, Barbacid M. A human oncogene formed by the fusion of a truncated tropomyosin and protein tyrosine kinase sequences. Nature. 1986;319:743–748. doi: 10.1038/319743a0. [DOI] [PubMed] [Google Scholar]
- 17.Coulier F, Martin-Zanca D, Ernst M, Barbacid M. Mechanism of activation of the human trk oncogene. Mol Cell Biol. 1989;9:15–23. doi: 10.1128/mcb.9.1.15. [DOI] [PMC free article] [PubMed] [Google Scholar]
- 18.Beimfohr C, Klugbauer S, Demidchik EP, Lengfelder E, Rabes HM. NTRK1 re-arrangement in papillary thyroid carcinomas of children after the Chernobyl reactor accident. Int J Cancer. 1999;80:842–847. doi: 10.1002/(sici)1097-0215(19990315)80:6<842::aid-ijc7>3.0.co;2-z. [DOI] [PubMed] [Google Scholar]
- 19.Bounacer A, Schlumberger M, Wicker R, et al. Search for NTRK1 proto-oncogene rearrangements in human thyroid tumours originating after therapeutic radiation. Brit J Cancer. 2000;82:308–314. doi: 10.1054/bjoc.1999.0920. [DOI] [PMC free article] [PubMed] [Google Scholar]
- 20.Kwan J, Baumgartner A, Lu C-M, et al. BAC-FISH assays delineate complex chromosomal rearrangements in a case of post-Chernobyl childhood thyroid cancer. Folia Histochem Cytobiol. 2009;47:135–144. doi: 10.2478/v10042-009-0044-9. [DOI] [PMC free article] [PubMed] [Google Scholar]
- 21.Lu C-M, Kwan J, Baumgartner A, et al. DNA probe pooling for rapid delineation of chromosomal breakpoints. J Histochem Cytochem. 2009;57:587–597. doi: 10.1369/jhc.2009.953638. [DOI] [PMC free article] [PubMed] [Google Scholar]
- 22.Weier H-UG, Tuton TB, Ito Y, et al. Molecular cytogenetic characterization of chromosome 9-derived material in a human thyroid cancer cell line. Cytogenet Genome Res. 2006;114:284–291. doi: 10.1159/000094215. [DOI] [PubMed] [Google Scholar]
- 23.Hanks SK, Quinn AM, Hunter T. The protein kinase family: conserved features and deduced phylogeny of the catalytic domains. Science. 1988;241:42–52. doi: 10.1126/science.3291115. [DOI] [PubMed] [Google Scholar]
- 24.Lu CM, Wang M, Greulich-Bode K, Weier JF, Weier HUG. Quantitative DNA fiber mapping. In: Liehr T, editor. Springer FISH Lab Manual. Springer Verlag; Heidelberg: 2008. pp. 269–291. [Google Scholar]
- 25.Kent WJ, Sugnet CW, Furey TS, et al. The human genome browser at UCSC. Genome Res. 2002;12:996–1006. doi: 10.1101/gr.229102. [DOI] [PMC free article] [PubMed] [Google Scholar]
- 26.Fiegler H, Carr P, Douglas EJ, et al. DNA microarrays for comparative genomic hybridization based on DOP-PCR amplification of BAC and PAC clones. Genes Chromosomes Cancer. 2003;36:361–374. doi: 10.1002/gcc.10155. [DOI] [PubMed] [Google Scholar]
- 27.Barker KT, Jackson LE, Crompton MR. BRK tyrosine kinase expression in a high proportion of human breast carcinomas. Oncogene. 1997;15:799–805. doi: 10.1038/sj.onc.1201241. [DOI] [PubMed] [Google Scholar]
- 28.Weier HUG, Fung J, Lersch RA. Assignment of protooncogene MERTK (aka c-mer) to human chromosome 2q14.1 by in situ hybridization. Cytogenet Cell Genet. 1999;84:91–92. doi: 10.1159/000015223. [DOI] [PubMed] [Google Scholar]
- 29.Rzeszutko M, Rzeszutko W, Dziegiel P, Balcerzak W, Kaliszewski K, Bolanowski M. Expression of FAS/APO 1/CD 95 in thyroid tumors. Folia Histochem Cytobiol. 2007;45:87–91. [PubMed] [Google Scholar]
- 30.Ziad EA, Ruchala M, Breborowicz J, Gembicki M, Sowinski J, Grzymislawski M. Immunoexpression of TTF-1 and Ki-67 in a coexistent anaplastic and follicular thyroid cancer with rare long-life surviving. Folia Histochem Cytobiol. 2008;46:461–464. doi: 10.2478/v10042-008-0071-y. [DOI] [PubMed] [Google Scholar]
- 31.Nikiforov YE. Genetic alterations involved in the transition from well-differentiated to poorly differentiated and anaplastic thyroid carcinomas. Endocr Pathol. 2004;15:319–327. doi: 10.1385/ep:15:4:319. [DOI] [PubMed] [Google Scholar]
- 32.Nikiforov YE. Editorial: Anaplastic carcinoma of the thyroid-will Aurora B light a path for treatment? J Clin Endocrin Metabol. 2005;90:1243–1245. doi: 10.1210/jc.2004-2478. [DOI] [PubMed] [Google Scholar]
- 33.Nappi TC, Salerno P, Zitzelsberger H, Carlomagno F, Salvatore G, Santoro M. Identification of Polo-like Kinase 1 as a potential therapeutic target in anaplastic thyroid carcinoma. Cancer Res. 2009;69:1916–1923. doi: 10.1158/0008-5472.CAN-08-1693. [DOI] [PubMed] [Google Scholar]
- 34.Daniluk J, Dabrowski A. The effect of concomitant stimulation with cholecystokinin and epidermal growth factor on extracellular signal-regulated kinase (ERK) activity in pancreatic acinar cells. J Physiol Pharmacol. 2007;58:441–453. [PubMed] [Google Scholar]
- 35.Czarkowska-Paczek B, Bartlomiejczyk I, Przybylski J. The serum levels of growth factors: PDGF, TGF-beta and VEGF are increased after strenuous physical exercise. J Physiol Pharmacol. 2006;57:189–197. [PubMed] [Google Scholar]
- 36.Allgayer H, Fulda S. An introduction to molecular targeted therapy of cancer. Adv Med Sci. 2008;53:130–138. doi: 10.2478/v10039-008-0025-9. [DOI] [PubMed] [Google Scholar]
- 37.Fung J, Munne S, Duell T, Weier HUG. Rapid cloning of translocation breakpoints: from blood to YAC in 50 days. J Biochem Mol Biol Biophys. 1998;1:181–192. [Google Scholar]
- 38.Munne S, Fung J, Cassel MJ, Marquez C, Weier HUG. Preimplantation genetic analysis of translocations: case-specific probes for interphase cell analysis. Hum Genet. 1998;102:663–674. doi: 10.1007/s004390050759. [DOI] [PubMed] [Google Scholar]
- 39.Fung J, Weier HUG, Goldberg JD, Pedersen RA. Chromosome enumeration in interphase amniocytes using Spectral Imaging. Hum Genetics. 2000;107:615–622. doi: 10.1007/s004390000416. [DOI] [PubMed] [Google Scholar]
- 40.Fung J, Munne S, Weier H-UG. Detection of chromosome translocation products in single interphase cell nuclei. In: Darzynkiewicz Z, Chrissman HA, Robinson JP, editors. Methods in Cell Biology. Vol. 64. Academic Press; San Diego: 2001. pp. 98–117. Part B, Cytometry. [DOI] [PubMed] [Google Scholar]
- 41.Lu C-M, Kwan J, Weier JF, et al. Rapid mapping of chromosomal breakpoints: from blood to BAC in 20 days. Folia Histochem Cytobiol. 2009 doi: 10.2478/v10042-009-0067-2. in press. [DOI] [PMC free article] [PubMed] [Google Scholar]
- 42.Motyl T, Gajkowska B, Zarzynska J, Gajewska M, Lamparska-Przybysz M. Apoptosis and autophagy in mammary gland remodeling and breast cancer chemotherapy. J Physiol Pharmacol. 2006;57(Suppl 7):17–32. [PubMed] [Google Scholar]
- 43.Godlewski MM, Hallay N, Bierla JB, Zabielski R. Molecular mechanism of programmed cell death in the gut epithelium of neonatal piglets. J Physiol Pharmacol. 2007;58(Suppl 3):97–113. [PubMed] [Google Scholar]