
Figure 5.
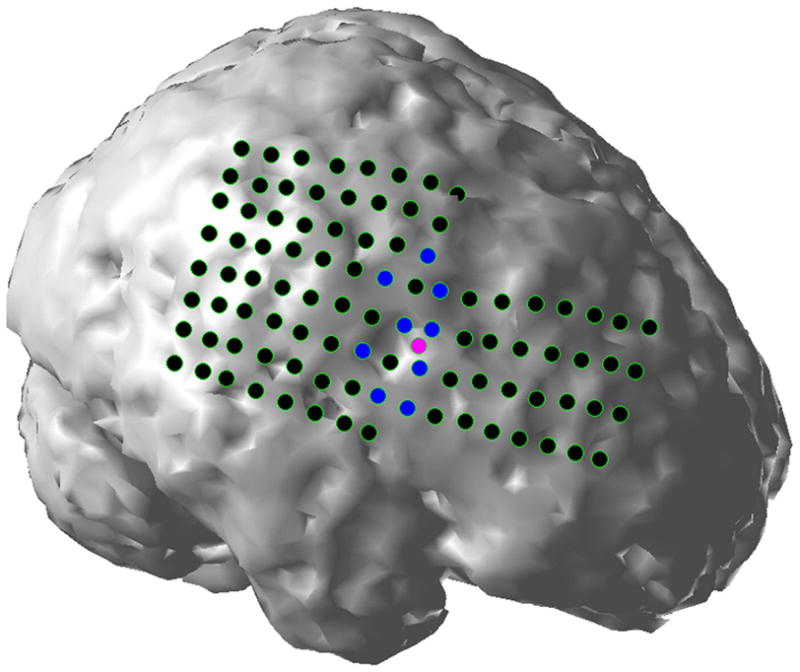
Quantitative evaluation of the CPI analysis of interictal spikes in patient #1. Black dots represent intracranial subdural electrodes, blue dots ictal onset zones identified by ECoG ictal recordings, and pink dots cortical sites with maximum estimated potential amplitude.