Abstract
Theaflavin-2 (TF-2), a major component of black tea extract, induces apoptosis of human colon cancer cells and suppresses serum-induced COX-2 expression [1]. Here, we explored the mechanisms for activation of apoptosis, evaluated the impact on inflammatory genes in a broader panel of cells and tested whether topical anti-inflammatory effects could be observed in vivo. TF-2 triggered apoptosis in five other transformed cancer cell lines, inducing cell shrinkage, membrane blebbing, and mitochondrial clustering within 3 h of treatment. Among a set of pro-apoptotic genes, TF-2 quickly induced the up-regulation of P53 and BAX, suggesting mitochondria as the primary target. Using a cell model for inflammatory response, we showed that TF-2 suppressed the TPA-induced COX-2 gene expression, and also down-regulated TNF-α, iNOS, ICAM-1, and NFκB. A reporter gene assay showed that TF-2 down-regulated COX-2 at the transcriptional level. We also demonstrated that TF-2 exhibited anti-inflammatory activity in two mouse models of inflammation. Topical application with TF-2 significantly reduced ear edema and produced a pattern of gene down-regulation similar to that observed in the cell model. These results suggest that the anti-inflammatory and pro-apoptotic activity of TF-2 may be exploited therapeutically in cancer and other diseases associated with inflammation.
Keywords: apoptosis, cyclooxygenase-2, inflammation, mitochondria, theaflavin
1. Introduction
Theaflavins derived from black tea exhibit a number of anti-cancer effects in cell culture and animal models. These effects include induction of apoptosis, cell cycle arrest, and suppression of inflammation [2-5]. Importantly, theaflavins potently induce apoptotic cell death and cell cycle arrest in tumor cells but not in their normal cell counterparts [1, 6]. Anti-cancer effects have been observed in vitro for each of the theaflavin isoforms: TF-2 [1, 2, 7-9], TF-3 [2, 7, 9] and TF-1 [8]. However, the molecular mechanisms underlying these effects have not been clarified. Specific inhibition of the G-protein signaling pathway through RGS contributes to anti-mitogenic effects [10]. Antioxidative properties of theaflavins reflected in prevention of pro-carcinogenic lipid peroxidation, lipoprotein oxidation, and DNA damage and mutation [3, 5] may impact other pathways related to oxidative stress (OS). OS is linked to inflammation through pro-oxidant cytokines and leukocytes which release inflammatory mediators (ROS, NO, prostaglandins, leukotrienes, thromboxanes) that cause symptoms of inflammation [11, 12]. Persistent inflammation plays a major role in carcinogenesis [11-13]. Cytokines, in particular TNF-α and IL-1β, are critical in the induction of the inflammatory response by activating nuclear factor kappa B (NFκB) and initiating the inflammation cascade through different pathways [11, 12, 14, 15]. COX-2 has become an important pharmacological target for cancer treatment, [12, 13, 16, 17] and previous studies indicated that TF-2 suppresses serum-induced COX-2 gene expression in Caco-2 cells [1].
The importance of apoptosis in chemoprevention or chemotherapy is apparent, as a defect in apoptotic mechanisms is recognized as an important cause of carcinogenesis [18]. The intrinsic mitochondrial-mediated apoptotic signaling may evolve through the impact of P53 affecting the pro/anti apoptotic protein ratio (Bax/Bcl-2) causing permeabilization of mitochondria. Cytochrome c release and formation of the supramolecular complex with Apaf-1, dATP and procaspase 9, termed the apoptosome, triggers activation of caspase 3. Induction of chromatin condensation, DNA fragmentation, cell shrinkage, blebbing, and formation of apoptotic bodies then ultimately leads to cell death [18-20]. Black tea extract or theaflavins induced apoptosis in different cancer cell lines and tumor cells in mice [2, 3, 5, 6]. We aimed to elucidate the molecular mechanism by which TF-2 modulates the apoptotic signaling pathway.
The in vitro and in vivo studies presented here demonstrate that TF-2 triggers apoptosis through the mitochondrial signaling pathway and inhibits expression of key genes involved in the inflammation cascade. Inhibition of edema formation correlated to attenuation of COX-2 expression and promoter analysis revealed modulation of NFκB, AP-1, CREB, and/or NF-Il-6 (C/EBP).
2. Materials and Methods
2.1. Materials and Chemicals
Dulbecco's modified Eagle's medium (DMEM) and fetal bovine serum (FBS) were obtained from Gibco BRL (Gaithersburg, MD). For RNA isolation, RNeasy™ Total RNA Kit (Qiagen, Chatsworth, CA) was used. Oligo-dT, dNTPs, Superscript™ II reverse transcriptase were purchased from Invitrogen Life Technologies (Baltimore, MD). The GFP-plasmid (pEGFP-1) was from Clontech (Palo Alto, CA). BglII, HindIII, and ligase were purchased from Qiagen (Chatsworth, CA). The transfection reagent (LipofectAMINE-2000) was from Invitrogen Life Technologies (Baltimore, MD). TF-2, a mixture of theaflavin-3-monogallate and theaflavin-3′-monogallate isomers, was isolated and purified from black tea powder as described previously [21], dissolved in deionized water at a stock concentration of 100 mM and stored at -80°C until use. Other chemicals were purchased from Sigma (St. Louis, MO).
2.2. Cell culture and treatment
WI38VA (CCL-75.1, human SV-40-transformed lung fibroblasts), HeLa (CCL-2, human cervix cancer cells), Caco-2 (HTB-37, human colon cancer cells), HT-29 (HTB-38, human colon cancer cells), MG-63 (CRL-1427, human osteosarcoma cells), and CF21.T (CRL-6220, canine connective tissue cancer cells) were obtained from the American Type Culture Collection (Rockville, MD). Cells were cultured in DMEM with 10% FBS at 37°C in a humidified, 10% CO2 atmosphere. Cells were subcultured in culture flasks (Falcon, Becton-Dickinson, Franklin Lakes, NJ) and passaged every 3 days. Before experiments, cells were seeded in 60 mm, 35 mm culture dishes or 24-well plates (Falcon, Becton-Dickinson, Franklin Lakes, NJ) as indicated for the different assays. TF-2 in water was applied to the medium to achieve the indicated final concentrations.
2.3. Cellular proliferation assays and morphological analysis
Cell proliferation was measured by the MTT (3(4,5-dimethylthiazol-2-yl)-2,5-diphenyl-tetrazolium-bromide) method after treatment in 24-well plates for 5 days. The MTT-assay measures mitochondrial damage based on conversion of the tetrazolium salt MTT to blue formazan by mitochondrial dehydrogenase [22]. In view of the concern that MTT may yield false-positive results for certain cell types when treated with flavonoids or polyphenols [23], proliferation data were verified by crystal violet dye staining and cell counting [24]. Color development was documented by a scanner (UMAX, Astra 2200). For morphological analysis, cells were treated in 35 mm cell culture dishes for 5 days, imaged with phase contrast light microscopy and documented with a digital camera system (MDS 120, Kodak, Emeryville, CA).
2.4. DNA fragmentation assay
After treatment in 60 mm culture dishes, cells were harvested and resuspended in 500 μl of lysis buffer (0.5% (w/v) sodium lauryl sarkosinate + 10 mM EDTA + 0.5 mg/ml proteinase K + 0.1 mg/ml RNase A in 50 mM Tris-Base, pH 8.0). After incubation for 40 min at 37°C, proteins were precipitated in 1 M NaCl at 4°C for 1 h, followed by centrifugation (10,000 × g for 10 min). DNA from the supernatant was then extracted with a phenol/chloroform/isopropanol mixture (25 : 24: 1 (vol/vol/vol), pH 8.0), precipitated in ethanol (70%), and dried in a Speed Vac. DNA pellets were resuspended in water (20 μl) and 10 μl of DNA laddering loading buffer (1% low-gelling temperature agarose (w/v) + 0.25% bromphenol blue (w/v) + 40% sucrose in 10 ml EDTA, pH 8.0) previously heated to 100°C. Samples were loaded onto a 2% agarose gel, solidified for 1 h, separated by electrophoresis, stained with ethidium bromide, and visualized under UV illumination.
2.5. Rhodamine 123 fluorescence assay
Mitochondrial morphology was analyzed using the cationic fluorophore rhodamine 123 (Invitrogen Life Technologies, Baltimore, MD), which specifically localizes mitochondria in living cells based on their electronegativity, as described previously [25]. Briefly, cells were grown on glass cover slips in 35 mm culture dishes for 1 day. After treatment, rhodamine 123 stock solution (1.5 mM in medium with 10% DMSO) was added to achieve a final concentration of 1.5 μM and incubated for 20 min. After washing twice with PBS, cells were imaged with phase contrast microscopy to monitor cell morphology or by fluorescence microscopy to determine mitochondrial morphology. For fluorescence microscopy, excitation and emission wavelength was 480 and 525 nm, respectively.
2.6. Reverse transcription-polymerase chain reaction (RT-PCR)
After treatment in 60 mm culture dishes, cells were harvested at indicated times and the total RNA was prepared using RNeasy™ Total RNA Kit. Then, total RNA (1 μg) was reverse transcribed into cDNA by incubating with SuperScriptTM RNase H reverse transcriptase using oligo(dT)12-18 as primer. For PCR amplification, gene specific primers, both sense and antisense, were used. PCR conditions were chosen to ensure that the yield of the amplified product was linear with respect to the amount of input cDNA. The expression of glyceraldehyde-3-phosphate dehydrogenase (GAPDH) was used as internal control. PCR products were analyzed by electrophoresis on a 1% agarose gel and visualized with ethidium bromide.
2.7. COX-2 Invader Assay
The induction of the COX-2 gene was analyzed by the biplex-Invader technique (Third Wave Technologies, Madison, WI). The Invader technique relies on linear amplification of the signal generated by the Invader process [26]. Briefly, two short DNA probes hybridize to the target cDNA sequence to form the structure recognized by flap endonucleases (FENs or Cleavase® enzymes). Released short DNA “flaps” bind to a fluorescently-labeled probe and forms another cleavage structure in the secondary reaction specifically cleaved by the flap endonucleases. For experiments, cells were harvested after treatment and total RNA was prepared as described above. For each sample, 25, 50, or 100 ng of total RNA were used. GAPDH was used as internal standard. Reactions were performed according to manufacturer's instructions. Fluorescence signal was measured in a fluorescence plate reader (Victor3, Perkin Elmer, Shelton, CT). COX-2 and GAPDH expression was calculated using the standard for each gene. COX-2 expression was then normalized to GAPDH which is expressed as attomoles COX-2/GAPDH.
2.8. Cloning of COX-2 promoter GFP reporter gene constructs
For COX-2 promoter analysis, we developed and constructed two different human COX-2 promoter vectors using green fluorescent protein (GFP) as a reporter gene and a commercially available plasmid (pEGFP-1; Clontech, Mountain View, CA). Either the whole COX-2 promoter (GFP-wp; position 51 – 1824) or truncated (GFP-tp; position 990 - 1824) COX-2 promoter fused to GFP was used. The sequence of the COX-2 promoter region and corresponding cis-elements were described earlier [16]. Briefly, genomic DNA (1 ng/μl) isolated from WI38VA cells was amplified by PCR using appropriate primers containing BglII (AGATCT) or HindIII (AAGCTT) site at the end. The PCR products were digested using BglII and HindIII and ligated into the GFP-vector (20 ng/μl). Constructs were then transformed into competent E.Coli (XL-1 Blue) and grown on kanamaycin- (50 μg/ml) containing agar plates overnight at 37°C. Then, clones were picked for each construct and grown in selective medium overnight again. After plasmid purification (Qiaprep miniprep, Qiagen, Chatsworth, CA), DNA was digested again and quality of the COX-2 promoter-GFP constructs analyzed on a 1% agarose gel and visualized with ethidium bromide.
2.9. COX-2 promoter activation assay
Cells were transfected with the COX-2 promoter-GFP constructs using LipofectAMINE-2000™. Briefly, cells were seeded in 24-well plates and grown to 90% confluence on the day of transfection. For transfection, cells in each well were washed with PBS and replenished with 100 μl of fresh serum free medium containing 0.8 μg of DNA and 2 μl of LipofectAMINE. After incubation for 48 h, cells were treated with TPA or TPA + TF-2 in medium for another 72 h. Untreated cells served as control. GFP expression was analyzed using fluorescence microscopy or a fluorescence reader (Victor3, Perkin Elmer, Shelton, CT) using 485 and 535 nm as excitation or emission wavelength, respectively.
2.10. Mouse ear edema and mouse skin model
Female CD-1 mice (6 weeks old, n = 5 per group for each assay) were used for all experiments. Mice were group housed (5 per cage) and fed standard mouse chow and tap water ad libitum. All animal experiments were approved by the Ethics Committee for Animal Experiments of Rutgers University and were performed in accordance with the Guideline for Animal Experiments of the laboratories (protocol No. 87-115). For the ear edema model, both ears of female CD-1 mice were treated topically with acetone or TF-2 in acetone for 10 min prior to topical application of TPA (1.5 nmol) in acetone. 20 μl of acetone were used for each application and also for the negative control group. The mice were euthanized 6 h after TPA treatment. Ear punches (6 mm in diameter) were then taken and weighed. For gene expression analysis, RNA was isolated and RT-PCR performed as described above. For ELISA analysis, both ears were treated topically with acetone or TF-2 10 min prior to topical application of TPA (0.8 nmol) once a day for 4 days. The mice were then euthanized 6 h after the last TPA treatment. For the mouse skin model, skin was treated by topical application of TPA (6 nmol), or treated with TPA and TF-2 (6 μM) for 5 h. Thereafter, mice were euthanized, total RNA isolated from skin patches and gene expression analyzed using RT-PCR.
2.11. IL-6 ELISA assay
Both ears of five female CD-1 mice were treated topically in the ear edema model as described above. After sacrifice, both ears (total 10 ears) were removed and homogenized in a phosphate buffer and centrifuged at 10,000 rpm for 10 min. Supernatant was used for IL-6 ELISA assay (Biosource, Camarillo, CA). The capture antibody against IL-6, diluted with PBS, was used to coat a 96-well plate overnight at room temperature. The plate was then washed, blocked (1% BSA, 5% sucrose in PBS with 0.05% NaN3), and washed again. Thereafter, standards were added to the plate leaving at least one well for background or blank evaluation, respectively. The diluted samples (1:3 - 1:8) were then added to the plate and incubated for 2 h, washed and incubated with detection antibody for 2 h. Streptavidin conjugated to horseradish peroxidase was then added for 20 min, washed and substrate (H2O2 and tetramethylbenzidine) added. After another 20 min of incubation, stop solution (2 N H2SO4) was added and absorption measured with a microplate reader at 450 nm.
2.12. Statistics
Results are presented as means +/- standard deviation (SD) unless otherwise indicated. Statistical comparisons of data were performed using Student's t-test.
3. Results
The effect of TF-2 on cell proliferation and apoptosis
We first evaluated whether TF-2 exerted similar effects in tumor cell lines unrelated to colon cancer [1]. Using the MTT assay we found IC50 values between 10 and 50 μM for all cancer cell lines tested (Fig.1A). Further analysis of WI38VA cells revealed an IC50 value of approximately 35 μM after 5 days (data not shown). The anti-proliferative effect of TF-2 appears to be due to its pro-apoptotic ability [1, 9, 11, 27]. DNA laddering, RT-PCR, cell morphology and mitochondrial morphology were monitored to investigate the mechanism of TF-2-induced apoptosis (Fig.1B - E). In WI38VA and HeLa cells, DNA laddering was seen after 48 h at TF-2 concentrations of ∼100 μM (Fig.1B). Strongest fragmentation was induced at 200 μM, while extremely high concentrations (e.g. 800 μM) induced a smear-like resolution of DNA (data not shown). Morphological analysis revealed DNA laddering correlated to prominent cell shrinkage in WI38VA and HeLa cells after 48 h starting at 100 μM of TF-2 (Fig.1C). At higher magnification, a dose-related condensation of the nucleus became evident (upper panel).
Fig.1. Effect of TF-2 on cell proliferation and apoptotic cell death.
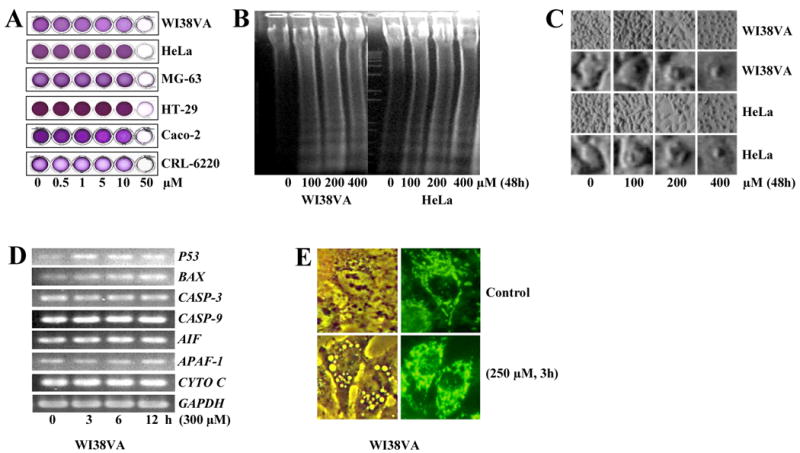
(A) Different cell lines such as WI38VA (human SV-40-transformed lung fibroblasts), HeLa (human cervix cancer cells), MG-63 (human osteosarcoma cells), HT-29 (human colon cancer cells), Caco-2 (human colon cancer cells), and CF21.T (canine connective tissue cancer cells) were treated by different concentrations of TF-2 for 5 days as indicated. Thereafter, cytotoxicity was analyzed by the MTT-assay and documented by a scanner. Representative pictures of at least 3 independent experiments are shown. (B) WI38VA and HeLa cells were treated by different concentrations of TF-2 for 48 h and processed for the DNA laddering assay as described in materials and methods. Thereafter, DNA was analyzed by agarose electrophoresis and ethidium bromide staining. (C) Cell morphology of WI38VA (two upper panels) and HeLa (two lower panels) was analyzed by phase contrast light microscopy (final magnification 800-fold and 3500-fold for upper or lower panels for WI38VA and HeLa cells, respectively) after 48 h. (D) For analysis of gene expression, TF-2 (300 μM) was applied for 0, 3, 6, or 12 h to WI38VA cells. Thereafter, expression of P53, BAX, CASP-3 (Caspase-3), CASP-9 (Caspase-9), AIF, APAF-1, and CYTO C (Cytochrome c) was analyzed by RT-PCR. Glyceraldehyde-3-phosphate dehydrogenase (GAPDH) was used as internal standard. Representative blots of three independent experiment are shown. (E) The effect on mitochondria was examined using the cationic fluorophore rhodamine 123. WI38VA cells were left either untreated as control or treated by TF-2 (250 μM) for 3 h. After 20 min, cells were analyzed either by phase contrast (left panel) or fluorescence microscopy (right panel) at a final magnification of 5000-fold.
Next, we examined whether TF-2 affects the expression of pro-apoptotic factors which play a major role in the intrinsic signaling pathway on a posttranslational level. Induction of p53 is thought to be the major cause for apoptosis by triggering Bax activation, which favors the permeability of mitochondrial membranes [28]. Caspase-3 acts as a central executioner activated by proteolytic cleavage in the zymogen-like caspase cascade, and cytochrome c, caspase-9, APAF-1, and AIF are released from mitochondria to form the apoptosome [18-20]. For RT-PCR experiments, WI38VA cells were treated with 300 μM of TF-2, a concentration which did not induce any morphological damage up to 12 h of exposure (data not shown). TF-2 induced a time dependent increase in P53 and BAX expression (Fig.1D). In contrast, we did not observe significant changes of CASP-3 and −9, AIF, APAF-1, and CYTO C up to 12 h.
As mitochondria are key organelles involved in the control of apoptosis [18-20], we examined the possible early response of mitochondria to TF-2 treatment. Mitochondrial clustering and vacuole formation was evident as early as 3 h after TF-2 treatment (Fig.1E). Both events may be closely associated with mitochondria-mediated apoptosis. We also observed a time- and dose-dependent increase in rhodamine 123 fluorescence intensity (data not shown), an indication that hyperpolarization of mitochondria may be an early trigger in the apoptotic pathway in response to TF-2 [29].
The effect of TF-2 on the expression of inflammatory genes
Since inflammation is believed to be a trigger of carcinogenesis (e.g. colon cancer) [12, 13, 17], we analyzed the effects of TF-2 on expression of inflammatory genes induced by 12-O-tetradecanoylphorbol-13-acetate (TPA) using the Caco-2 human colon cancer cell line. TPA is known to stimulate both inflammation and carcinogenesis [30]. Based on kinetic experiments for COX-2 (see Fig.4), we chose 3 h for gene expression analysis. COX-2, IL-1B, IL-6, TNF-A, ICAM-1, C-JUN, C-FOS, and NFKB were up-regulated in response to TPA (Fig.2). Concurrent exposure to TF-2 prominently suppressed the effect of TPA on the induction of COX-2, TNF-A, ICAM-1, and NFKB. iNOS, while not induced in this model, was also down-regulated by TF-2. No significant changes in gene expression were found for PLA2, LTA4 HYD, IL-1B, Il-6, TNF-A-R, C-JUN, and C-FOS. Phospholipase A2 and leukotriene A4 hydrolase, two major enzymes in the arachidonic pathway, were reported to be regulated on a post-translational level [31, 32]. These results suggest that TF-2 may exert anti-inflammatory effects by suppressing the induction of certain genes in key inflammation cascade pathways including COX-2, TNF-A, iNOS, ICAM-1 and NFKB.
Fig.4. Effect of TF-2 on COX-2 promoter activation in vitro.
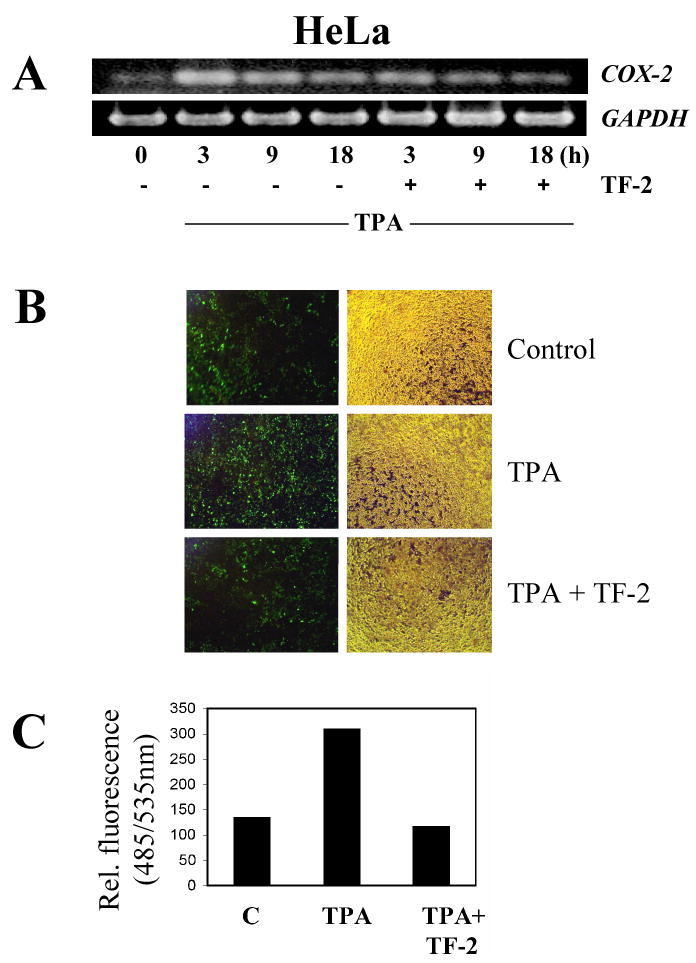
(A) Kinetics of COX-2 expression was analyzed in HeLa cells by RT-PCR. HeLa cells were treated either by TPA (10 nM) alone or in combination with TF-2 (300 μM) and analyzed after 3, 9, or 18 h. (B,C) HeLa cells were transfected with truncated COX-2 promoter-GFP construct (GFP-tp) for 48 h. Thereafter, medium was changed and either TPA (0.02 μM) alone or TPA in combination with TF-2 (40 μM) applied for another 72 h. Untreated cells served as control. Thereafter, GFP expression was analyzed using fluorescence microscopy (B) or by fluorescence readings (C) using 485 and 535 nm as excitation or emission wavelength, respectively.
Fig.2. Effect of TF-2 on the expression of inflammatory genes in vitro.
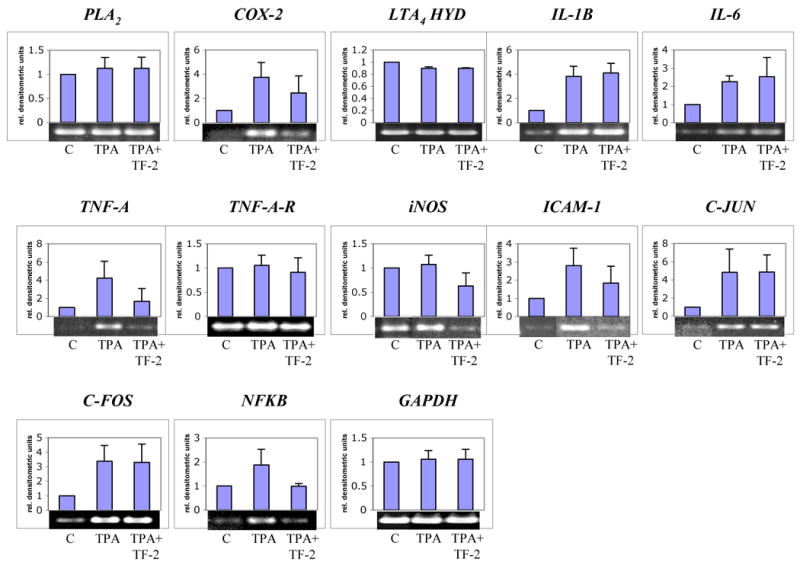
For analysis of inflammatory genes, TPA (10 nM) was either applied alone or in combination with TF-2 (300 μM) for 3 h in Caco-2 cells. Untreated cells served as controls. Thereafter, the expression of PLA2, COX-2, LTA4 HYD (LTA4 hydrolase), IL-1B, Il-6, TNF-A, TNF-A-R (TNF-α receptor), iNOS, ICAM-1, C-JUN, C-FOS, and NFKB was analyzed by RT-PCR. GAPDH was used as internal standard. Level of gene expression was quantified using densitometry and expressed as relative densitometric units. Mean values + standard deviation of three independent experiments are shown in the histograms. Representative blots are shown below the histograms.
The effect of TF-2 on the cyclooxygenase-2 gene
As COX-2 is a major inflammatory enzyme believed to be involved in the outcome of various cancers [12, 13, 16, 17], we analyzed the effect of TF-2 on COX-2 expression in detail in Caco-2 and HeLa cells (Figs.3 - 4). In dose response (Fig.3A, C) and kinetic experiments (Fig.3B, D) we observed a significant suppression of TPA-induced COX-2 expression at TF-2 concentrations between 30 and 75 μM in Caco-2 cells using the Invader Assay (A, B) or RT-PCR (C, D), respectively. TPA induced strongest COX-2 expression after 3 h, which decreased after 9 h, and dropped below control levels after 18 h (Fig 4B, D). TF-2 (300 μM) significantly suppressed TPA-induced COX-2 gene expression after 3 h, 9 h, and 18 h in both assays.
Fig.3. Effect of TF-2 on COX-2 expression in vitro.
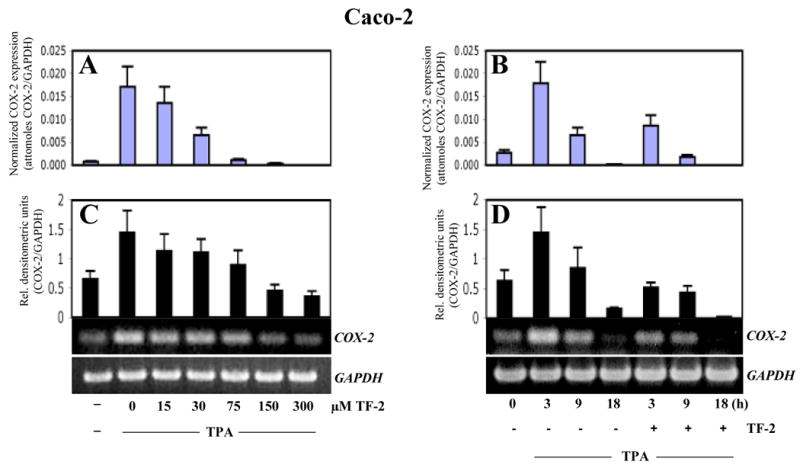
Caco-2 cells were treated either by TPA (10 nM) alone or in combination with TF-2. Dose responsive (A, C) or time dependent (B, D) effects of TF-2 (300 μM) were analyzed by either the Invader-assay (A, B) or by RT-PCR (C, D), respectively, as described in materials and methods. GAPDH was used as internal standard. For both assays, COX-2 expression was normalized to GAPDH and expressed either as attomoles of COX-2/GAPDH (A,B) or as relative densitometric units (C,D) for Invader assay or RT-PCR, respectively. Mean values + standard deviation of three independent experiments are shown in the histograms. For RT-PCR, representative blots are shown below the histograms.
A COX-2 promoter-GFP construct was used to determine whether TF-2 suppressed COX-2 promoter activity and explore which transcription factors may be affected to account for inhibition of COX-2 expression. Constructs contained either the whole (GFP-wp; position 51 – 1824) or truncated COX-2 promoter-GFP construct (GFP-tp; position 990 - 1824) as described in Materials and Methods. As we observed a similar suppression of COX-2 expression in HeLa cells (Fig.4A) as in Caco-2 cells (Fig.3), we performed transfection experiments using HeLa cells, which proved more reliable targets for transfection using the liposome procedure described above. Noteworthy, we observed equally strong activation of both the whole and truncated COX-2 promoter by TPA (data not shown). We then analyzed the effect of TF-2 on COX-2 promoter activation using the truncated GFP construct which contains consensus cis-elements for NFκB, AP-1, CREB, Sp-1, GATA-1, NF-Il-6, PEA-3, and TBF [16]. For all experiments, cells were transformed for 48 h, and either TPA (0.02 μM) alone or TPA with TF-2 (40 μM) was applied for another 72 h. Untreated cells served as control. TF-2 treatment attenuated TPA-induced GFP expression to control levels as demonstrated by fluorescence microscopy (Fig.4B) and by fluorescence readings (Fig.4C), indicating suppression of COX-2 promoter activity. Modulation of the truncated promoter implicates one or more of the regulatory transcription factors NFκB, AP-1, CREB, and/or NF-Il-6 (C/EBP) in mediation of COX-2 suppression by TF-2.
The effects of TF-2 in vivo
Two different mouse models were used to test whether TF-2 exhibited an anti-inflammatory effect in vivo. We used topical treatments to avoid any potential metabolic complications. First, we analyzed the effect of TF-2 on edema formation using the mouse ear model (Fig.5). TF-2 treatment successfully reduced ear edema in a dose-dependent manner (Fig. 5A) and this effect correlated to a dose related reduction in COX-2 gene expression, achieving control levels at the higher concentration of 0.5 μM (Fig.5B).
Fig.5. Effect of TF-2 on edema formation in vivo.
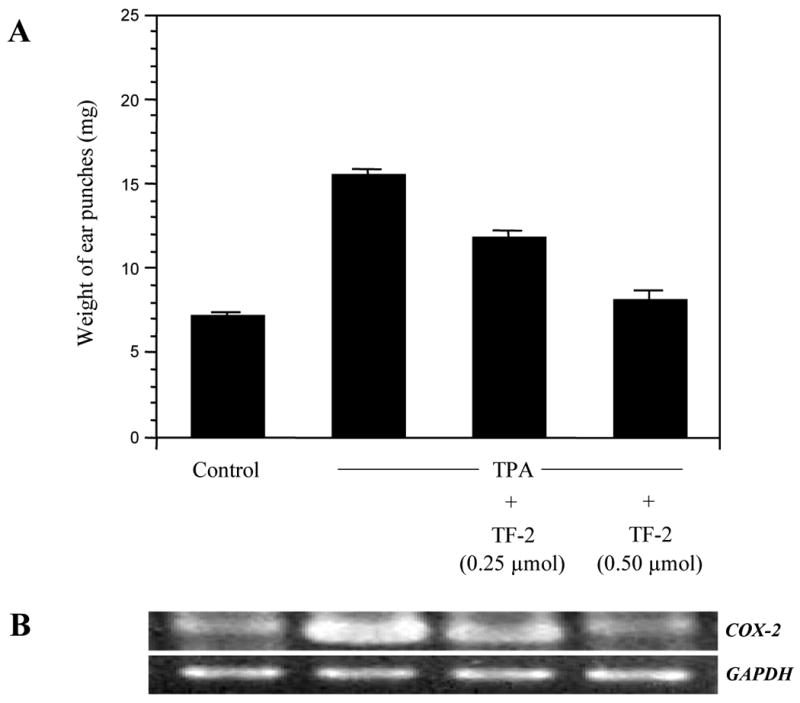
Both ears of female CD-1 mice (6 weeks old; 5 mice per group) were treated topically with acetone or TF-2 in acetone 10 min prior to topical application of acetone or TPA (1.5 nmol) for 6 h. (A) Ear punches were taken and weighed. Data represent mean values ± SE. (B) Expression of COX-2 was analyzed by RT-PCR using GAPDH as internal standard. Representative blot is shown.
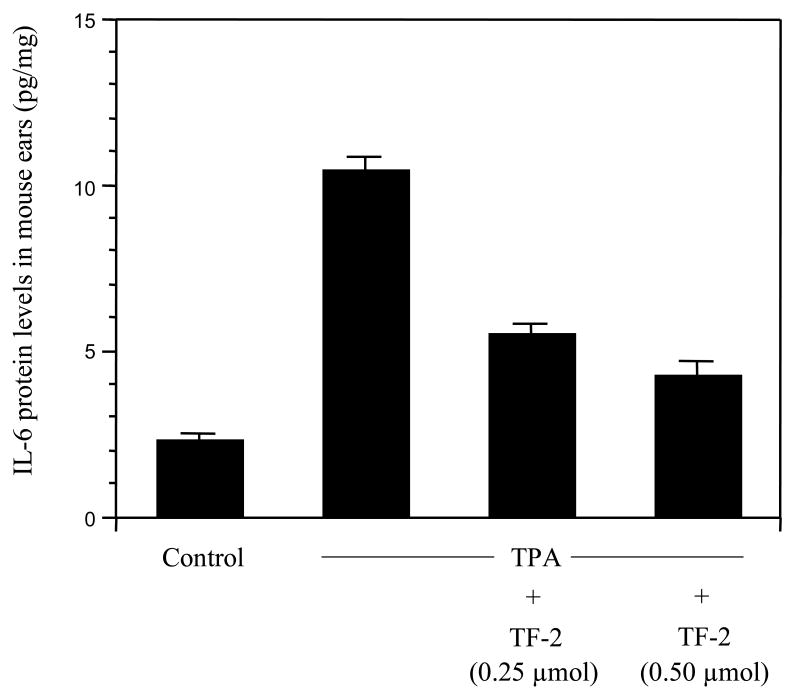
We also analyzed the effect of TF-2 on other relevant genes involved in the inflammatory response using a mouse skin model to facilitate RNA isolation. TPA alone induced a prominent up-regulation of COX-2, IL-1B, IL-6, TNF-A, ICAM-1, C-JUN, C-FOS, and NFKB (Fig. 6), similar to that observed in vitro (Fig.2). In addition to COX-2, mRNA levels of IL-6, TNF-A, ICAM-1, C-JUN, C-FOS, and NFKB were also potently reduced by TF-2. Interestingly, we observed an inhibition of IL-6, C-JUN, and C-FOS in mouse skin as compared to human Caco-2 cells, where those genes appear not to be significantly regulated by TF-2 (Fig.2). In view of the striking effect on the suppression of TPA-induced IL-6 gene expression, we analyzed the effect of TF-2 on the expression of IL-6 protein. Fig. 7 shows a dose-dependent attenuation of IL-6 protein level when TF-2 was applied with TPA, establishing a good correlation between mRNA and protein levels of IL-6. Taken together, our in vivo studies suggest that the inhibition of edema formation by TF-2 is associated with a suppressive effect on this set of inflammation related genes.
Fig.6. Effect of TF-2 on the expression of inflammatory genes in vivo.
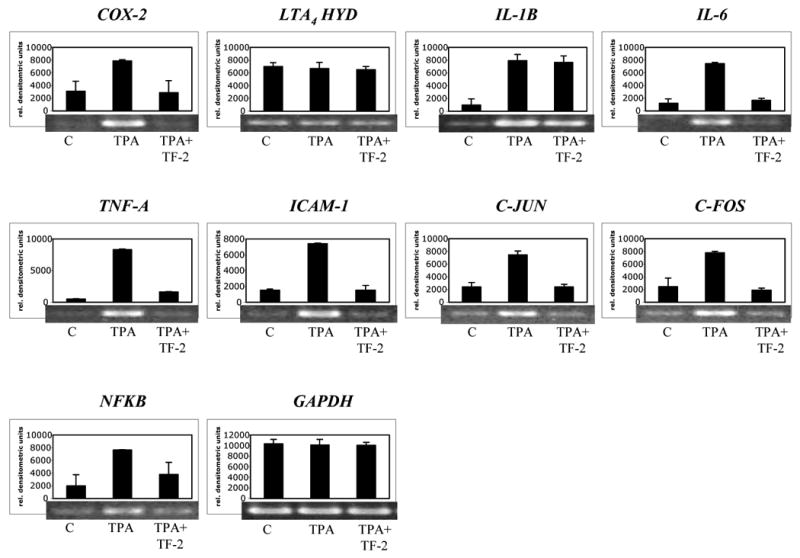
Mouse skin was treated by topical application of TPA (6 nmol) or by TPA and TF-2 (6 μM) for 5 h. Acetone as carrier served as control. Thereafter, gene expression of COX-2, LTA4 HYD, IL-1B, IL-6, TNF-A, ICAM-1, C-JUN, C-FOS, and NFKB was analyzed by RT-PCR using GAPDH as internal standard. Level of gene expression was quantified using densitometry and expressed as relative densitometric units. Mean values + standard deviation of two independent experiments are shown in the histograms. Representative blots are shown below the histograms.
Fig.7. Effect of TF-2 on IL-6 expression in vivo.
Both ears of female CD-1 mice (5 weeks old; 5 mice per group) were treated topically with acetone or TF-2 in acetone 10 min prior to topical application of acetone or TPA (0.8 nmol) once a day for 4 days. 6 h after the last TPA treatment both ears (total 10 ears) were used for triplicate ELISA assays. Data represent mean values ± SE.
4. Discussion
During the past decade, extensive research has revealed many clinically relevant biological properties of theaflavins, ranging from anti-oxidative, anti-mitogenic, anti-inflammatory to pro-apoptotic, any or all of which may contribute to their reported anti-cancer activity [2-5]. While some of the anti-inflammatory effects are believed to be due to inhibition of ROS-dependent inflammation [11-13], not all anti-cancer effects can be explained solely on the basis of antioxidant properties. TF-2 exerted strong anti-inflammatory effects in vivo by suppressing edema in the mouse ear model. COX-2, TNF-A, iNOS, ICAM-1, and NFKB mRNA levels were potently reduced by TF-2 in our cell-based and animal models, suggesting that the effects of TF-2 are distributed across multiple key points in the inflammatory cascade. The observation that IL-6 was strongly down-regulated by TF-2 in the mouse model as compared to the human cell model may be based on the species difference in the IL-6 promoter [33].
The prominent down-regulation of COX-2 gene expression in vitro as well as in vivo by TF-2 is consistent with earlier studies [1, 4-6]. The close correlation between inhibition of edema and COX-2 expression suggests potential therapeutic utility for several cancers as well as other inflammation-related diseases [13, 16, 17]. Our COX-2 promoter experiments confirmed the major role of NFκB in early activation of inflammation by TPA. By activating cis-consensus sites in promoters of PLA2, COX-2, 2-LOX, iNOS, ICAM-1, IL-1B, IL-6, IL-8, IFN-B, GM-CSF [14, 15], NFκB triggers the inflammation cascade through free radical-induced, extrinsic- and/or intrinsic mechanisms. Earlier studies revealed that TF-2 attenuated the classical or canonical NFκB pathway through IκB kinase (IKK) inhibition [7, 8, 34], which triggers NFκB activation by IκB phosphorylation [14, 15]. Recently, we observed an induction of regulators of G protein signaling proteins (RGS) by TF-2 [10]. Since TF-2 exhibited multiple molecular effects, there is a possibility that RGS may act upstream and control the expression of the downstream target inflammatory genes possibly through NFκB [35, 36].
Our observation of prominent down-regulation of TNF-A expression in vitro as well as in vivo suggest the existence of alternative pathways besides the canonical NFκB pathway. The TNF-A promoter contains only low affinity NFκB-like elements [37, 38] and expression of IL-4 and IL-5, which lack functional NFκB sites within their promoters, was also suppressed by theaflavins [39]. Recently, an enhanceosome formation within the TNF-A promoter through intrachromosomal looping has been described bringing distal NFκB-like elements and the proximal region together [40, 41]. Intriguingly, we observed a significant down-regulation of C-JUN and C-FOS expression only in mice as compared with human U-937 cells. AP-1 regulates the promoters of various inflammatory genes (COX-2, iNOS, ICAM-1, TNF-A, IL-1B, IL-6, IL-8) [42, 43] and an inhibition of AP-1 activity by theaflavins has been shown previously [34, 43, 44]. The results of our COX-2 promoter reporter assay suggest that, besides NFκB and AP-1, TF-2 may have direct or indirect effects on CREB and/or NF-Il-6 (C/EBP). Interestingly, a synergistic interaction of AP-1 and CREB with NFκB has been described for TNF-A activation [14, 41, 45] and CREB phosphorylation via IKK-α enhanced NFκB activity [14]. For EGCG, an inhibition of NFκB and CREB through p38 which correlated to a down-regulation of COX-2 has been shown [46]. Thus, the modulation of the interplay of NFκB, AP-1, CREB, and C/EBP by TF-2 appears to be crucial for the activity of trans-responsive inflammatory genes.
Another anti-cancer mechanism exerted by theaflavins is the activation of apoptotic signaling, which, at high concentrations, may be due to generation of hydrogen peroxide [2]. We observed that TF-2 induced clustering and hyperpolarization of mitochondria - indicative of intrinsic apoptotic signaling. The significance of cytoplasmic vacuole formation in response to TF-2 and TF-3 [2] to their anti-cancer effects remains unclear. TF-2 also induced a prominent up-regulation of P53 and BAX, suggesting mitochondria as a primary target. An increase in BAX activity, mediated by P53 [28], may induce permeabilization of mitochondria and activation of intrinsic apoptotic signaling [47].
In summary, the black tea polyphenol TF-2 is a promising candidate for further evaluation as a therapeutic agent for cancer and other inflammatory conditions. While our studies employed direct in vitro exposure and topical in vivo applications, further research is needed to examine oral bioavailability, and to identify the specific molecular targets and impact of theaflavins in different types of cancer and other inflammation-related diseases. Importantly, the impact of these dietary polyphenols on epigenetic regulation may be a very promising avenue to target genes playing major roles in inflammation. The data presented here provide a foundation and a molecular framework for further mechanistic and translational studies.
Acknowledgments
This work was supported by the Commission on Science and Technology, State of New Jersey as a component of the Pioneering Nutraceutical Research Program and by a NIH-NCCAM Grant (1R43AT001143-01A1). We also acknowledge the helpful discussions with Drs. Geetha Ghai, Robert Rosen, Hong Wang, Shiming Li and Kristin Haines.
References
- 1.Lu J, Ho C, Ghai G, Chen K. Differential effects of theaflavin monogallates on cell growth, apoptosis, and Cox-2 gene expression in cancerous versus normal cells. Cancer Res. 2000;60:6465–6471. [PubMed] [Google Scholar]
- 2.Yang CS, Wang X, Lu G, Picinich SC. Cancer prevention by tea: animal studies, molecular mechanisms and human relevance. Nat Rev Cancer. 2009;9:429–439. doi: 10.1038/nrc2641. [DOI] [PMC free article] [PubMed] [Google Scholar]
- 3.Luczaj W, Skrzydlewska E. Antioxidative properties of black tea. Prev Med. 2005;40:910–918. doi: 10.1016/j.ypmed.2004.10.014. [DOI] [PubMed] [Google Scholar]
- 4.de Mejia EG, Ramirez-Mares MV, Puangpraphant S. Bioactive components of tea: cancer, inflammation and behavior. Brain Behav Immun. 2009;23:721–731. doi: 10.1016/j.bbi.2009.02.013. [DOI] [PubMed] [Google Scholar]
- 5.Sharma V, Rao LJ. A thought on the biological activities of black tea. Crit Rev Food Sci Nutr. 2009;49:379–404. doi: 10.1080/10408390802068066. [DOI] [PubMed] [Google Scholar]
- 6.Chen D, Milacic V, Chen MS, Wan SB, et al. Tea polyphenols, their biological effects and potential molecular targets. Histol Histopathol. 2008;23:487–496. doi: 10.14670/hh-23.487. [DOI] [PMC free article] [PubMed] [Google Scholar]
- 7.Lin YL, Tsai SH, Lin-Shiau SY, Ho CT, Lin JK. Theaflavin-3,3′-digallate from black tea blocks the nitric oxide synthase by down-regulating the activation of NF-kappaB in macrophages. Eur J Pharmacol. 1999;367:379–388. doi: 10.1016/s0014-2999(98)00953-4. [DOI] [PubMed] [Google Scholar]
- 8.Pan M, Liang Y, Lin-Shiau S, Zhu N, et al. Induction of apoptosis by the oolong tea polyphenol theasinensin A through cytochrome c release and activation of caspase-9 and caspase-3 in human U937 cells. Agric Food Chem. 2000;48:6337–6346. doi: 10.1021/jf000777b. [DOI] [PubMed] [Google Scholar]
- 9.Lung HL, Ip WK, Chen ZY, Mak NK, Leung KN. Comparative study of the growth-inhibitory and apoptosis-inducing activities of black tea theaflavins and green tea catechin on murine myeloid leukemia cells. Int J Mol Med. 2004;13:465–471. [PubMed] [Google Scholar]
- 10.Lu J, Gosslau A, Liu AY, Chen KY. PCR differential display-based identification of regulator of G protein signaling 10 as the target gene in human colon cancer cells induced by black tea polyphenol theaflavin monogallate. Eur J Pharmacol. 2008;601:66–72. doi: 10.1016/j.ejphar.2008.10.044. [DOI] [PubMed] [Google Scholar]
- 11.Kundu JK, Surh YJ. Inflammation: gearing the journey to cancer. Mutat Res. 2008;659:15–30. doi: 10.1016/j.mrrev.2008.03.002. [DOI] [PubMed] [Google Scholar]
- 12.Aggarwal BB, Gehlot P. Inflammation and cancer: how friendly is the relationship for cancer patients? Curr Opin Pharmacol. 2009;9:351–369. doi: 10.1016/j.coph.2009.06.020. [DOI] [PMC free article] [PubMed] [Google Scholar]
- 13.Coussens LM, Werb Z. Inflammation and cancer. Nature. 2002;420:860–867. doi: 10.1038/nature01322. [DOI] [PMC free article] [PubMed] [Google Scholar]
- 14.Ghosh S, Hayden MS. New regulators of NF-kappaB in inflammation. Nat Rev Immunol. 2008;8:837–848. doi: 10.1038/nri2423. [DOI] [PubMed] [Google Scholar]
- 15.Baud V, Karin M. Is NF-kappaB a good target for cancer therapy? Hopes and pitfalls. Nat Rev Drug Discov. 2009;8:33–40. doi: 10.1038/nrd2781. [DOI] [PMC free article] [PubMed] [Google Scholar]
- 16.Smith WL, DeWitt DL, Garavito RM. Cyclooxygenases: structural, cellular, and molecular biology. Annu Rev Biochem. 2000;69:145–182. doi: 10.1146/annurev.biochem.69.1.145. [DOI] [PubMed] [Google Scholar]
- 17.Zha S, Yegnasubramanian V, Nelson WG, Isaacs WB, De Marzo AM. Cyclooxygenases in cancer: progress and perspective. Cancer Lett. 2004;215:1–20. doi: 10.1016/j.canlet.2004.06.014. [DOI] [PubMed] [Google Scholar]
- 18.Reed J. Apoptosis-targeted therapies for cancer. Cancer Cell. 2003;3:17–22. doi: 10.1016/s1535-6108(02)00241-6. [DOI] [PubMed] [Google Scholar]
- 19.Hengartner M. The biochemistry of apoptosis. Nature. 2000;407:770–776. doi: 10.1038/35037710. [DOI] [PubMed] [Google Scholar]
- 20.Gosslau A, Chen KY. Nutraceuticals, apoptosis, and disease prevention. Nutrition. 2004;20:95–102. doi: 10.1016/j.nut.2003.09.017. [DOI] [PubMed] [Google Scholar]
- 21.Xie B, Shi H, Chen Q, Ho CT. Antioxidant properties of fractions and polyphenol constituents from green, oolong and black teas. Proc Natl Sci Counc Repub China B. 1993;17:77–84. [PubMed] [Google Scholar]
- 22.Berg K, Hansen M, Nielsen S. A new sensitive bioassay for precise quantification of interferon activity as measured via the mitochondrial dehydrogenase function in cells (MTT-method) APMIS. 1990;98:156–162. doi: 10.1111/j.1699-0463.1990.tb01016.x. [DOI] [PubMed] [Google Scholar]
- 23.Bernhard D, Schwaiger W, Crazzolara R, Tinhofer I, et al. Enhanced MTT-reducing activity under growth inhibition by resveratrol in CEM-C7H2 lymphocytic leukemia cells. Cancer Lett. 2003;195:193–199. doi: 10.1016/s0304-3835(03)00157-5. [DOI] [PubMed] [Google Scholar]
- 24.Gosslau A, Chen M, Ho C, Chen K. A methoxy derivative of resveratrol analogue selectively induced activation of the mitochondrial apoptotic pathway in transformed fibroblasts. Br J Cancer. 2005;92:513–521. doi: 10.1038/sj.bjc.6602300. [DOI] [PMC free article] [PubMed] [Google Scholar]
- 25.Johnson L, Walsh M, Chen L. Localization of mitochondria in living cells with rhodamine 123. Proc Natl Acad Sci U S A. 1980;77:990–994. doi: 10.1073/pnas.77.2.990. [DOI] [PMC free article] [PubMed] [Google Scholar]
- 26.Lyamichev V, Mast AL, Hall JG, Prudent JR, et al. Polymorphism identification and quantitative detection of genomic DNA by invasive cleavage of oligonucleotide probes. Nat Biotechnol. 1999;17:292–296. doi: 10.1038/7044. [DOI] [PubMed] [Google Scholar]
- 27.Banerjee S, Manna S, Saha P, Panda CK, Das S. Black tea polyphenols suppress cell proliferation and induce apoptosis during benzo(a)pyrene-induced lung carcinogenesis. Eur J Cancer Prev. 2005;14:215–221. doi: 10.1097/00008469-200506000-00004. [DOI] [PubMed] [Google Scholar]
- 28.Chipuk JE, Kuwana T, Bouchier-Hayes L, Droin NM, et al. Direct activation of Bax by p53 mediates mitochondrial membrane permeabilization and apoptosis. Science. 2004;303:1010–1014. doi: 10.1126/science.1092734. [DOI] [PubMed] [Google Scholar]
- 29.Skulachev VP. Bioenergetic aspects of apoptosis, necrosis and mitoptosis. Apoptosis. 2006;11:473–485. doi: 10.1007/s10495-006-5881-9. [DOI] [PubMed] [Google Scholar]
- 30.Nakadate T. The mechanism of skin tumor promotion caused by phorbol esters: possible involvement of arachidonic acid cascade/lipoxygenase, protein kinase C and calcium/calmodulin systems. Jpn J Pharmacol. 1989;49:1–9. doi: 10.1254/jjp.49.1. [DOI] [PubMed] [Google Scholar]
- 31.Murakami M, Nakatani Y, Atsumi G, Inoue K, Kudo I. Regulatory functions of phospholipase A2. Crit Rev Immunol. 1997;17:225–283. doi: 10.1615/critrevimmunol.v17.i3-4.10. [DOI] [PubMed] [Google Scholar]
- 32.Chen X, Wang S, Wu N, Yang C. Leukotriene A4 hydrolase as a target for cancer prevention and therapy. Curr Cancer Drug Targets. 2004;4:267–283. doi: 10.2174/1568009043333041. [DOI] [PubMed] [Google Scholar]
- 33.Li DH, Kumanogoh A, Cao TM, Parnes JR, Cullen JM. Woodchuck interleukin-6 gene: structure, characterization, and biologic activity. Gene. 2004;342:157–164. doi: 10.1016/j.gene.2004.07.034. [DOI] [PubMed] [Google Scholar]
- 34.Aneja R, Odoms K, Denenberg AG, Wong HR. Theaflavin, a black tea extract, is a novel anti-inflammatory compound. Crit Care Med. 2004;32:2097–2103. doi: 10.1097/01.ccm.0000142661.73633.15. [DOI] [PubMed] [Google Scholar]
- 35.Fraser CC. G protein-coupled receptor connectivity to NF-kappaB in inflammation and cancer. Int Rev Immunol. 2008;27:320–350. doi: 10.1080/08830180802262765. [DOI] [PubMed] [Google Scholar]
- 36.Druey KM. Regulation of G-protein-coupled signaling pathways in allergic inflammation. Immunol Res. 2009;43:62–76. doi: 10.1007/s12026-008-8050-0. [DOI] [PMC free article] [PubMed] [Google Scholar]
- 37.Goldfeld AE, Strominger JL, Doyle C. Human tumor necrosis factor alpha gene regulation in phorbol ester stimulated T and B cell lines. J Exp Med. 1991;174:73–81. doi: 10.1084/jem.174.1.73. [DOI] [PMC free article] [PubMed] [Google Scholar]
- 38.Kuprash DV, Udalova IA, Turetskaya RL, Kwiatkowski D, et al. Similarities and differences between human and murine TNF promoters in their response to lipopolysaccharide. J Immunol. 1999;162:4045–4052. [PubMed] [Google Scholar]
- 39.Tomita M, Irwin KI, Xie ZJ, Santoro TJ. Tea pigments inhibit the production of type 1 (T(H1)) and type 2 (T(H2)) helper T cell cytokines in CD4(+) T cells. Phytother Res. 2002;16:36–42. doi: 10.1002/ptr.834. [DOI] [PubMed] [Google Scholar]
- 40.Tsytsykova AV, Rajsbaum R, Falvo JV, Ligeiro F, et al. Activation-dependent intrachromosomal interactions formed by the TNF gene promoter and two distal enhancers. Proc Natl Acad Sci U S A. 2007;104:16850–16855. doi: 10.1073/pnas.0708210104. [DOI] [PMC free article] [PubMed] [Google Scholar]
- 41.Tsai EY, Yie J, Thanos D, Goldfeld AE. Cell-type-specific regulation of the human tumor necrosis factor alpha gene in B cells and T cells by NFATp and ATF-2/JUN. Mol Cell Biol. 1996;16:5232–5244. doi: 10.1128/mcb.16.10.5232. [DOI] [PMC free article] [PubMed] [Google Scholar]
- 42.Shaulian E, Karin M. AP-1 as a regulator of cell life and death. Nat Cell Biol. 2002;4:E131–136. doi: 10.1038/ncb0502-e131. [DOI] [PubMed] [Google Scholar]
- 43.Bode AM, Dong Z. Molecular and cellular targets. Mol Carcinog. 2006;45:422–430. doi: 10.1002/mc.20222. [DOI] [PMC free article] [PubMed] [Google Scholar]
- 44.Chung JY, Huang C, Meng X, Dong Z, Yang CS. Inhibition of activator protein 1 activity and cell growth by purified green tea and black tea polyphenols in H-ras-transformed cells: structure-activity relationship and mechanisms involved. Cancer Res. 1999;59:4610–4617. [PubMed] [Google Scholar]
- 45.Yao J, Mackman N, Edgington TS, Fan ST. Lipopolysaccharide induction of the tumor necrosis factor-alpha promoter in human monocytic cells. Regulation by Egr-1, c-Jun, and NF-kappaB transcription factors. J Biol Chem. 1997;272:17795–17801. doi: 10.1074/jbc.272.28.17795. [DOI] [PubMed] [Google Scholar]
- 46.Kundu JK, Surh YJ. Epigallocatechin gallate inhibits phorbol ester-induced activation of NF-kappa B and CREB in mouse skin: role of p38 MAPK. Ann N Y Acad Sci. 2007;1095:504–512. doi: 10.1196/annals.1397.054. [DOI] [PubMed] [Google Scholar]
- 47.Bhattacharyya A, Lahiry L, Mandal D, Sa G, Das T. Black tea induces tumor cell apoptosis by Bax translocation, loss in mitochondrial transmembrane potential, cytochrome c release and caspase activation. Int J Cancer. 2005;117:308–315. doi: 10.1002/ijc.21075. [DOI] [PubMed] [Google Scholar]


