Abstract
Hypertension and dyslipidemia are risk factors for atherosclerosis and occur together more often than expected by chance. Although this clustering suggests shared causation, unifying factors remain unknown. We describe a large kindred with a syndrome including hypertension, hypercholesterolemia, and hypomagnesemia. Each phenotype is transmitted on the maternal lineage with a pattern indicating mitochondrial inheritance. Analysis of the mitochondrial genome of the maternal lineage identified a homoplasmic mutation substituting cytidine for uridine immediately 5′ to the mitochondrial transfer RNAIle anticodon. Uridine at this position is nearly invariate among transfer RNAs because of its role in stabilizing the anticodon loop. Given the known loss of mitochondrial function with aging, these findings may have implications for the common clustering of these metabolic disorders.
Hypertension and dyslipidemia are important risk factors for many common cardiovascular diseases, including myocardial infarction, stroke, and congestive heart failure (1, 2). These traits are concordant in individual patients more often than expected by chance (3, 4). Large epidemiologic studies have demonstrated that subjects with hypertension have a marked increase in the prevalence of hypercholesterolemia, hypertriglyceridemia, hypomagnesemia, diabetes, insulin resistance, and obesity (5–9). Various combinations of these abnormalities affect up to a quarter of the U.S. adult population and are referred to as the metabolic syndrome, syndrome X, or dyslipidemic hypertension. The factors accounting for this phenotypic clustering are unknown, although obesity, insulin resistance, and increased local glucocorticoid tone have been suggested to play a role (4, 10). Although rare mutations with large effects on blood pressure (11), lipids (12), insulin resistance (13, 14), obesity (15), and magnesium (16) have established critical pathways for homeostasis of each of these traits, they have typically affected only one of these phenotypes and therefore have not provided an explanation for their clustering (17).
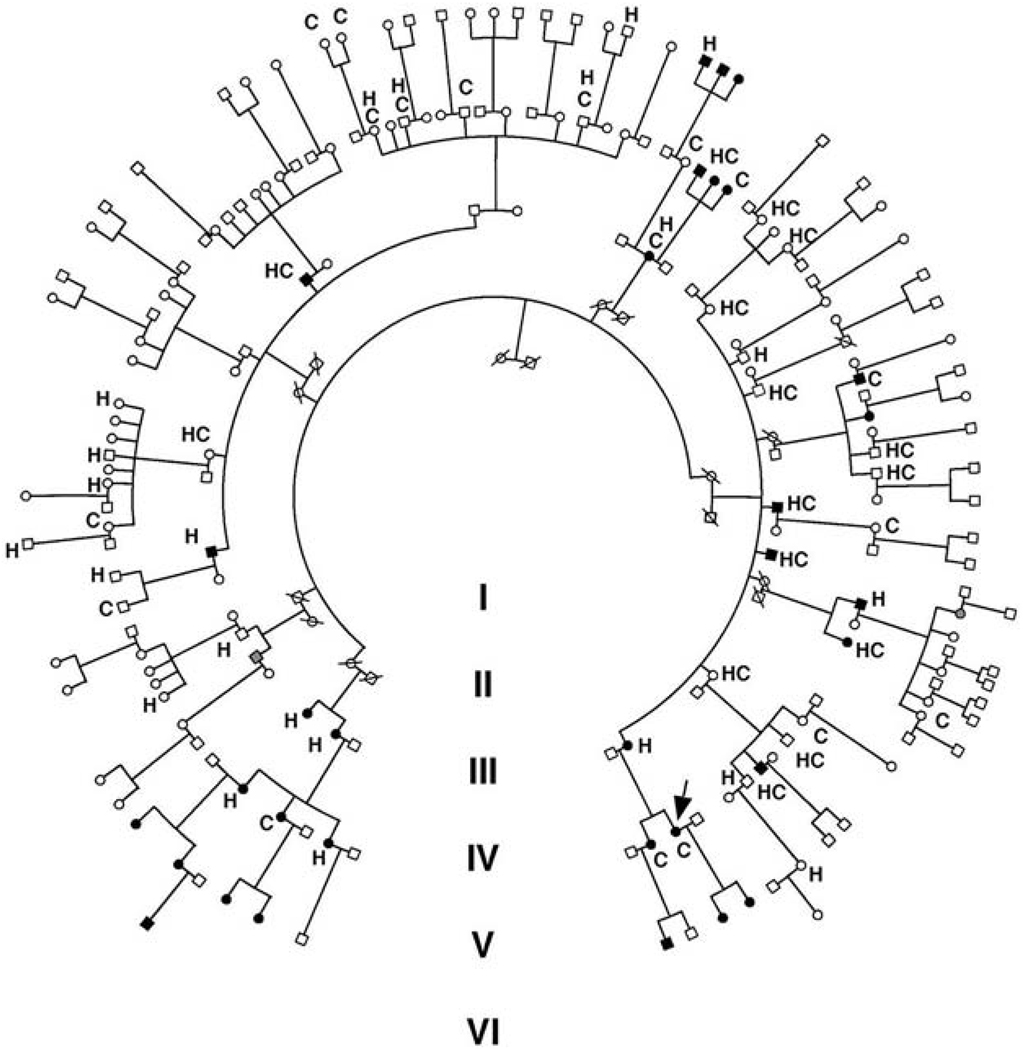
A Caucasian kindred (K129) was ascertained through a proband with hypomagnesemia. Evaluation of her extended kindred revealed a high prevalence of hypomagnesemia, hypertension, and hypercholesterolemia. We ultimately performed a detailed clinical evaluation of 142 blood relatives in the kindred (Fig. 1). Including the index case, 38 members had hypertension (with blood pressure > 140/90 mm Hg or on treatment for hypertension), 33 had hypercholesterolemia (with total cholesterol > 200 mg/dl or on treatment for hypercholesterolemia), and 32 had clinically significant hypomagnesemia (range 0.8 to 1.7 mg/dl, normal 1.8 to 2.5 mg/dl).
Fig. 1.
The structure of Kindred 129. Individuals with serum Mg2+ < 1.8 mg/dl are indicated by black symbols. Family members taking antihypertensive medications or having blood pressures over 140/90 mm Hg are indicated by an H. Members with hypercholesterolemia (serum cholesterol > 200 mg/dl or taking lipid-lowering agents) are denoted by C. Blood relatives who did not have electrolyte values measured are indicated by gray symbols. The index case is indicated by an arrow.
Because it is the least common of these traits in the general population, we initially focused on the distribution of hypomagnesemia in the kindred. Hypomagnesemic individuals are distributed through four generations and 16 sibships, and both genders are affected (Fig. 1); there was no significant effect of age on Mg2+ levels and no hypomagnesemic subjects were taking Mg2+-altering medications. All 32 members with hypomagnesemia are on the same maternal lineage (Figs. 1 and 2A). Affected fathers never transmitted the trait to their offspring (0 of 17 offspring), whereas affected mothers transmitted the trait to a high fraction of their offspring (16 of 21). These features are hallmarks of inheritance via the mitochondrial genome. The probability of all 32 hypomagnesemic subjects being on the maternal lineage by chance is extremely small (χ2 = 49, P < 10−11), strongly supporting mitochondrial transmission. Autosomal dominant transmission with imprinting was much less likely from the observed distribution (the odds favoring mitochondrial transmission were >106:1) (18). A genome-wide analysis of linkage was performed and found no evidence for a shared segment of the nuclear genome among hypomagnesemic subjects (18).
Fig. 2.
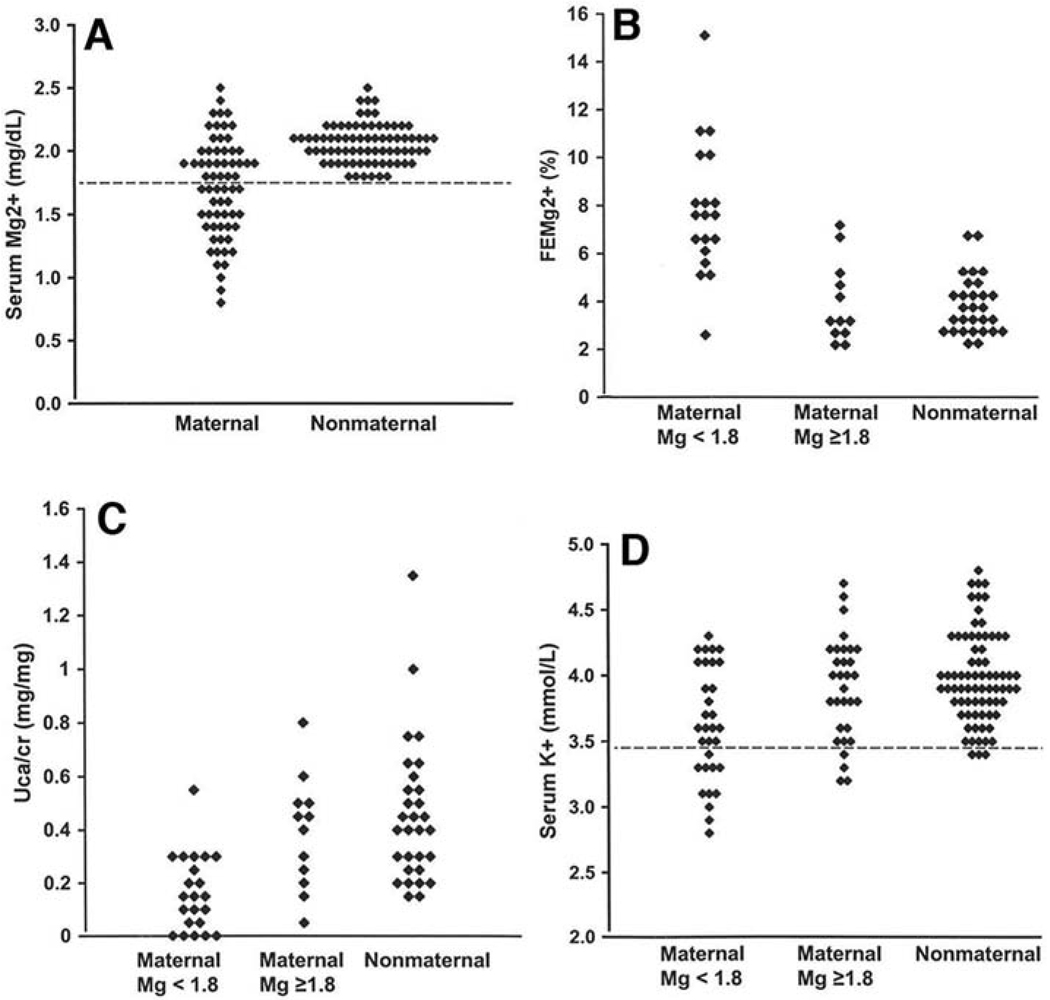
Renal hypomagnesemia, hypocalciuria, and hypokalemia in the maternal lineage of K129. (A) Serum Mg2+ values for individuals in maternal and nonmaternal lineages of K129 are shown and are significantly different (P = 2 × 10⁻⁹). (B) Fractional renal Mg2+ excretion (FEMg2+) on the maternal and nonmaternal lineages is shown; on the maternal lineage, individuals with normal and low Mg2+ levels are separated. Hypomagnesemic subjects have significantly elevated fractional excretion of Mg2+, indicating a renal defect (P = 0.0001 comparing maternal to nonmaternal; P = 5 × 10⁻⁶ comparing hypomagnesemic subjects versus those not in the maternal lineage). (C) Urinary calcium to creatinine ratios (UCa/cr) are shown grouped as in (B); maternal subjects have significantly reduced urinary calcium levels (P = 0.0005). (D) Serum K+ levels. Hypokalemia is seen predominantly on the maternal lineage among hypomagnesemic subjects.
Quantitative serum Mg2+ levels were lower in individuals from the maternal lineage compared with relatives in the nonmaternal lineage (Fig. 2A) (P = 2 × 10⁻⁹). Members of the maternal lineage had a marked increase in the urinary fractional excretion of Mg2+ (Fig. 2B) (P = 0.0001); this effect was most pronounced among subjects with hypomagnesemia (Fig. 2B) (P = 5 × 10⁻⁶ comparing hypomagnesemic subjects versus subjects in the nonmaternal lineage), establishing impaired renal Mg2+ reabsorption as the cause of hypomagnesemia in K129. Evaluation of other urinary electrolytes was notable for reduced urinary calcium on the maternal lineage (Fig. 2C) (P = 0.0005), again predominantly among hypomagnesemic subjects (P = 4 × 10⁻⁶) despite normal serum calcium levels. Hypomagnesemia with reduced urinary calcium is characteristic of a primary defect in the renal distal convoluted tubule (DCT) (16). In addition, hypokalemia due to inappropriate renal loss was seen more frequently on the maternal lineage (Fig. 2D) (χ2 = 11.6, P = 0.0007), predominantly among hypomagnesemic subjects. There was no difference in 24-hour urinary sodium excretion between maternal and nonmaternal lineages. Electrolyte values are summarized in table S1.
Hypertension also segregated with the maternal lineage. Thirty of 53 adults on the maternal lineage had blood pressure greater than 140/90 mm Hg or were being treated with antihypertensive medication versus 8 of 53 on the nonmaternal lineages (χ2 = 19.9, P < 0.00001). The prevalence of hypertension on the maternal lineage showed a marked age dependence, increasing from 5% in subjects under age 30 (1 of 20 subjects), to 44% in those from age 30 to 50 (10 of 23 subjects), and to 95% in those over age 50 (19 of 20 subjects). Because the oldest generations of K129 are enriched for the maternal lineage (Fig. 1), we reanalyzed the data, excluding subjects over age 60; the results remain highly significant (P = 0.0005) (supporting online text). The prevalence of hypertension on the maternal lineage is also high compared with the general population (supporting online text).
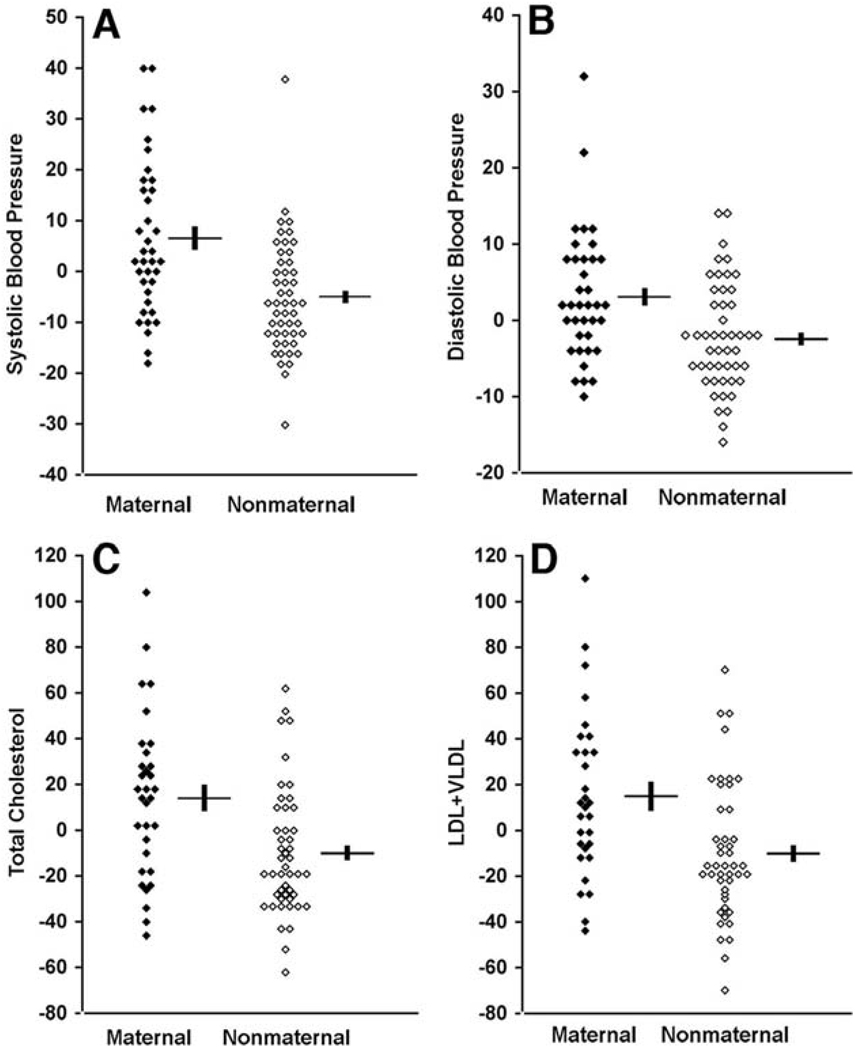
Quantitative assessment confirmed the effect of maternal lineage on blood pressure (Fig. 3, A and B, and Table 1). After adjustment of blood pressure for the major covariates age, sex, and body mass index (BMI), adults on the maternal lineage had highly significant increases in systolic and diastolic blood pressures compared with their nonmaternal relatives. Among adults age 18 to 60, maternal lineage increased systolic blood pressure by an average of 13 mm Hg (P = 0.00007) and diastolic blood pressure by 5 mm Hg (P = 0.002). Similar results are seen in analysis of all adults. Estimates of these quantitative effects are conservative because of the higher use of antihypertensive medication among members of the maternal lineage. Plasma renin and aldosterone levels were no different between members of the maternal and nonmaternal lineages (table S2).
Fig. 3.
Quantitative blood pressure and cholesterol values in K129. Values in maternal and nonmaternal K129 members between the ages of 18 and 60 are shown. All values represent difference from the mean value after adjustment for age, sex, and BMI. For blood pressure and lipids, units are mm Hg and mg/dl, respectively. Mean and SEM values are indicated for maternal and nonmaternal groups. Values are significantly elevated in members of the maternal lineage. (A) Systolic blood pressure (P = 0.00007). (B) Diastolic blood pressure (P = 0.002). (C) Fasting total cholesterol (P = 0.002). (D) Fasting LDL + VLDL cholesterol (P = 0.004).
Table 1.
Age, sex, and BMI-adjusted traits in adults age 18 to 60 in maternal and nonmaternal lineages of K129. Values are mean ± SEM. Total cholesterol, LDL, VLDL, HDL, triglyceride, glucose, and insulin sensitivity (18) were measured after an overnight fast. SBP, systolic blood pressure; DBP, diastolic blood pressure; HOMA, homeostasis model assessment.
| Nonmaternal | Maternal | P | |
|---|---|---|---|
| SBP (mm Hg) | 122 ± 2 | 135 ± 3 | 0.00007 |
| DBP (mm Hg) | 77 ± 1 | 82 ± 1 | 0.002 |
| Total cholesterol (mg/dl) | 173 ± 4 | 199 ± 7 | 0.002 |
| LDL + VLDL (mg/dl) | 124 ± 5 | 150 ± 8 | 0.004 |
| HDL (mg/dl) | 50 ± 2 | 49 ± 3 | 0.78 |
| Triglyceride (mg/dl) | 129 ± 14 | 148 ± 22 | 0.46 |
| Glucose (mg/dl) | 84 ± 1 | 95 ± 11 | 0.28 |
| HOMA | 3.5 ± 0.3 | 4.0 ± 0.3 | 0.22 |
Hypercholesterolemia also segregated with the maternal lineage. Twenty-four of 46 adults on the maternal lineage had fasting total cholesterol of >200 mg/dl or were being treated with cholesterol-lowering medication versus 9 of 49 on the nonmaternal lineage (χ2 = 12.4, P = 0.0004). The relationship remained highly significant (P = 0.0008) when the analysis was restricted to adults age 18 to 60. Similar results were obtained for elevated fasting low-density lipoprotein (LDL) cholesterol (LDL > 130 mg/dl; χ2 = 11.6, P = 0.0007). Quantitative analysis of total cholesterol among adults age 18 to 60 after adjustment for age, sex, and BMI revealed that maternal lineage increased total cholesterol by an average of 26 mg/dl (Fig. 3C and Table 1). This increase is attributable to elevations in LDL and very low-density lipoprotein (VLDL), with no effect on fasting high-density lipoprotein (HDL) or triglycerides (Fig. 3D, Table 1, and fig. S1). Similar results are seen among all adult subjects. The magnitude of these effects is likely an underestimate because of the increased use of cholesterol-lowering agents among maternal relatives.
In sum, of 45 adults on thematernal lineage who had all three traits measured, 38 had one or more of hypertension, hypercholesterolemia, or hypomagnesemia, 26 had two or more, and 7 had all three (fig. S2). The maternal lineage accounts for virtually all of the clustering of these traits in K129 (fig. S2).
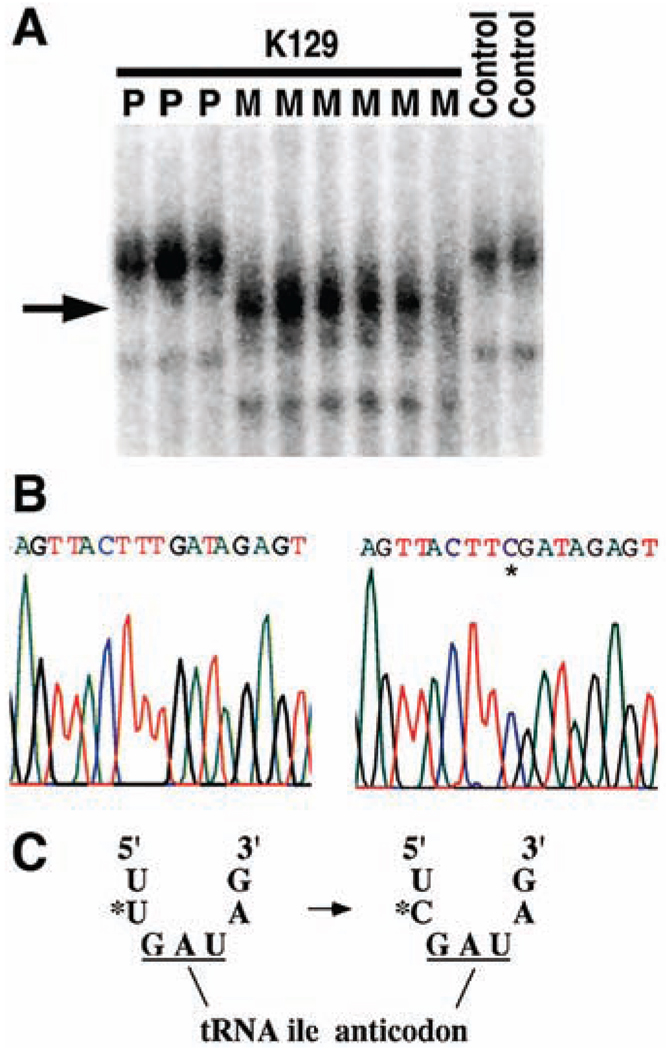
Collectively, these data provide strong evidence for a mitochondrial mutation as the cause of the syndrome in K129. Because Southern blotting revealed no evidence of mitochondrial deletion, we performed direct sequencing and single-strand conformational polymorphism analysis of the entire mitochondrial genome to search for sequence variants. Fourteen variants were identified on the maternal lineage; 13 are previously identified polymorphisms of no known consequence (table S3). One variant, however, is a previously undescribed thymidine-to-cytidine transition at nucleotide 4291, which lies within the mitochondrial tRNAIle gene (GenBank accession no. NC_001807) (Fig. 4, A and B). This mutation is found only on the maternal lineage in K129, does not appear among the thousands of mitochondrial genomes previously sequenced (19), and was absent among 170 unrelated control individuals. Polymerase chain reaction–restriction fragment length polymorphism analysis revealed that this mutation is apparently homoplasmic in leukocytes of all members of the maternal lineage regardless of phenotype, with the assay sufficiently sensitive to detect 1% heteroplasmy (fig. S3) (18).
Fig. 4.
Mitochondrial tRNAIle mutation in K129. Mitochondrial DNA from both blood leukocytes and renal epithelial cells was analyzed and yielded identical results. (A) A fragment of mtDNA containing the tRNAIle gene was amplified from members of K129 and normal controls and was fractionated by nondenaturing gel electrophoresis (18). A thymidine-to-cytidine variant (indicated by arrow) is present in individuals from the maternal lineage (M) but absent in offspring of affected males (paternal lineage, P) and unrelated controls. (B) The sequence of a portion of the mitochondrial tRNAIle gene from the amplicon in (A) from a wild-type control (left) and a member of the maternal lineage of K129 (right). A single base substitution (asterisk) changes the wild-type thymidine to cytidine. (C) The T → C transition alters the nucleotide immediately 5′ to the tRNAIle anticodon.
The thymidine-to-cytidine mutation in K129 occurs immediately 5′ to the tRNAIle anticodon (Fig. 4C). Uridine at this position is one of the most extraordinarily conserved bases in the biological world. It is conserved in every sequenced isoleucine tRNA, including 242 different species of archaebacteria, eubacteria, unicellular and multicellular eukaryotes, animals, plants, chloroplasts, and mitochondria (20). Moreover, uridine is conserved at this position in virtually all sequenced tRNAs of all specificities (96% of 4300 tRNAs among all species); nearly all exceptions are eukaryotic initiator tRNAMet genes (20). The extreme conservation of uridine at this position is explained by the structure of tRNAs. The anticodon loop results from a sharp turn in the phosphodiester backbone, allowing presentation of the anticodon to its cognate mRNA codon in the ribosome (21, 22). This turn is stabilized by a hydrogen bond between the amino group of the conserved uridine and the phosphate backbone of the third base of the anticodon (22, 23). Cytidine lacks this amino group and cannot form this hydrogen bond. Biochemical studies with anticodon stem-loop analogs of tRNAs have been performed and indicate that substitution of cytidine for uridine at this position markedly impairs ribosome binding (23), providing evidence of the functional importance of this mutation.
Members of K129 were carefully evaluated for the presence of additional clinical phenotypes commonly associated with mitochondrial dysfunction. The prevalence of migraine headache, sensorineural hearing loss, and hypertrophic cardiomyopathy were increased on the maternal lineage (supporting online text). Measures of fasting HDL, triglycerides, insulin resistance, BMI, and diabetes mellitus were not significantly different between the two lineages (Table 1 and figs. S1 and S4).
Immunohistochemistry of a skeletal muscle biopsy from a member of the maternal lineage revealed an increase in ragged red fibers and subsarcolemmal succinate dehydrogenase staining, characteristic features of individuals carrying mitochondrial mutations (fig. S5, A and B) (24). Electron microscopy of the biopsy demonstrated cytoplasmic lipid accumulation, increased glycogen stores, and dysmorphic mitochondrial cristae, further signs of mitochondrial dysfunction (fig. S5C). Finally, in vivo nuclear magnetic resonance (NMR) spectroscopy of skeletal muscle in this patient demonstrated normal tricarboxylic acid cycle flux but reduced adenosine triphosphate (ATP) production, suggesting impaired coupling of these processes (fig. S5, D and E). Additional studies of other kindred members will be required to establish the frequency and severity of these manifestations.
These findings establish a causal relationship between a mitochondrial mutation and hypertension, hypercholesterolemia, and hypomagnesemia. The mitochondrial origin of this disorder is of particular interest given recent evidence implicating mitochondrial dysfunction in type 2 diabetes mellitus and insulin resistance, other components of the metabolic syndrome. Rare mitochondrial mutations cause diabetes with deafness (25). In vivo NMR of skeletal muscle has linked loss of mitochondrial function to insulin resistance (26). Finally, expression of genes involved in oxidative phosphorylation is reduced among patients with type 2 diabetes mellitus and insulin resistance (27). Thus, although insulin resistance, obesity, and hypertriglyceridemia are absent in K129, these traits have been previously linked to loss of mitochondrial function. These observations raise the possibility that all the features of the metabolic syndrome can result from pleiotropic effects of impaired mitochondrial function; we speculate that the loss of mitochondrial function with aging (26, 28) might commonly contribute to all components of the metabolic syndrome.
The variation in the phenotypic consequences of this homoplasmic mitochondrial mutation is notable. Hypomagnesemia, hypertension, and hypercholesterolemia each show ~50% penetrance among adults on the maternal lineage. Incomplete penetrance arising from homoplasmic mutations is well described and has been attributed to nuclear genome and/or environmental modifiers (29). The nearly stochastic distributions of these traits on the maternal lineage (fig. S2) and the nonsignificant correlations among their quantitative values on the maternal lineage suggests that these are independent, pleiotropic effects of the mitochondrial mutation.
Prior studies suggest potential mechanisms linking each trait to impaired mitochondrial function. Cells of the DCT have the highest energy consumption of the nephron (30), and Mg2+ reabsorption in the DCT requires ATP-dependent Na+ reabsorption (31). Inhibitors of mitochondrial ATP production increase cholesterol biosynthesis while inhibiting clearance in vitro (32). Finally, reduced ATP production has been reported in animal models of hypertension (33). Further work will be required to elucidate the molecular mechanisms linking genotype and phenotype.
The results of this study suggest that the loss of mitochondrial function with age (26, 28) could contribute to the characteristic age-related increase in blood pressure (34) and to its clustering with hypocholesterolemia in the general population. The mutation in K129 results in a complex pattern of phenotypic clustering that is reminiscent of the frequent but not obligatory clustering seen in the general population. This highlights the complexity that can arise from a single mutation because of the combined effects of reduced penetrance and pleiotropy and underscores the value of studying very large kindreds. The present findings motivate further investigation of a potential role for mitochondrial dysfunction in common forms of hypertension and hypercholesterolemia.
Supplementary Material
Acknowledgments
We thank the members of K129 for their generous participation in this project; I. Beerman, C. Mendenhall, and F. Niazi for assistance with patient evaluation; D. Befroy and S. Dufour for assistance with spectroscopy; C. Ariyan and J. Kim for help with muscle biopsy; C. Garganta for measurement of urinary amino acids and organic acids; the staff of the Yale General Clinical Research Center; and A. Gharavi for helpful discussions. Supported by NIH grant nos. MO1 RR-00125, P50 HL-55007, and R01 DK-49230. A.H. is the recipient of an American Heart Association Fellowship (no. 0475003N).
Footnotes
Supporting Online Material
www.sciencemag.org/cgi/content/full/1102521/DC1
Materials and Methods
SOM Text
Figs. S1 to S5
Tables S1 to S3
References and Notes
References and Notes
- 1.Stamler J, Wentworth D, Neaton JD. JAMA. 1986;256:2823. [PubMed] [Google Scholar]
- 2.Mosterd A, et al. N. Engl. J. Med. 1999;340:1221. doi: 10.1056/NEJM199904223401601. [DOI] [PubMed] [Google Scholar]
- 3.Wingard DL, Barrett-Connor E, Criqui MH, Suarez L. Am. J. Epidemiol. 1983;117:19. doi: 10.1093/oxfordjournals.aje.a113510. [DOI] [PubMed] [Google Scholar]
- 4.Reaven GM. Diabetes. 1988;37:1595. doi: 10.2337/diab.37.12.1595. [DOI] [PubMed] [Google Scholar]
- 5.Criqui MH, et al. Circulation. 1986;73:I40. [PubMed] [Google Scholar]
- 6.Williams RR, et al. JAMA. 1988;259:3579. doi: 10.1001/jama.259.24.3579. [DOI] [PubMed] [Google Scholar]
- 7.Mizushima S, Cappuccio FP, Nichols R, Elliott P. J. Hum. Hypertens. 1998;12:447. doi: 10.1038/sj.jhh.1000641. [DOI] [PubMed] [Google Scholar]
- 8.Peacock JM, Folsom AR, Arnett DK, Eckfeldt JH, Szklo M. Ann. Epidemiol. 1999;9:159. doi: 10.1016/s1047-2797(98)00040-4. [DOI] [PubMed] [Google Scholar]
- 9.Guerrero-Romero F, Rodriguez-Moran M. Acta Diabetol. 2002;39:209. doi: 10.1007/s005920200036. [DOI] [PubMed] [Google Scholar]
- 10.Masuzaki H, et al. Science. 2001;294:2166. doi: 10.1126/science.1066285. [DOI] [PubMed] [Google Scholar]
- 11.Lifton RP, Gharavi AG, Geller DS. Cell. 2001;104:545. doi: 10.1016/s0092-8674(01)00241-0. [DOI] [PubMed] [Google Scholar]
- 12.Goldstein JL, Brown MS. Science. 2001;292:1310. doi: 10.1126/science.1061815. [DOI] [PubMed] [Google Scholar]
- 13.Bell GI, Polonsky KS. Nature. 2001;414:788. doi: 10.1038/414788a. [DOI] [PubMed] [Google Scholar]
- 14.George S, et al. Science. 2004;304:1325. doi: 10.1126/science.1096706. [DOI] [PMC free article] [PubMed] [Google Scholar]
- 15.O’Rahilly S, Farooqi IS, Yeo GS, Challis BG. Endocrinology. 2003;144:3757. doi: 10.1210/en.2003-0373. [DOI] [PubMed] [Google Scholar]
- 16.Konrad M, Schlingmann KP, Gudermann T. Am. J. Physiol. Renal Physiol. 2004;286:F599. doi: 10.1152/ajprenal.00312.2003. [DOI] [PubMed] [Google Scholar]
- 17.Mutations in PPARγ and Akt2 may be an exception, as the few patients reported have both insulin resistance and hypertension.
- 18.Materials and methods are available as supporting material on Science Online.
- 19.MITOMAP: A Human Mitochondrial Genome Database, available at www.mitomap.org.
- 20.Sprinzl M, Horn C, Brown M, Ioudovitch A, Steinberg S. Nucleic Acids Res. 1998;26:148. doi: 10.1093/nar/26.1.148. [DOI] [PMC free article] [PubMed] [Google Scholar]
- 21.Kim SH, et al. Science. 1973;179:285. doi: 10.1126/science.179.4070.285. [DOI] [PubMed] [Google Scholar]
- 22.Quigley GJ, Rich A. Science. 1976;194:796. doi: 10.1126/science.790568. [DOI] [PubMed] [Google Scholar]
- 23.Ashraf SS, et al. RNA. 1999;5:188. doi: 10.1017/s1355838299981529. [DOI] [PMC free article] [PubMed] [Google Scholar]
- 24.Wallace DC. Science. 1999;283:1482. doi: 10.1126/science.283.5407.1482. [DOI] [PubMed] [Google Scholar]
- 25.Maechler P, Wollheim CB. Nature. 2001;414:807. doi: 10.1038/414807a. [DOI] [PubMed] [Google Scholar]
- 26.Petersen KF, et al. Science. 2003;300:1140. doi: 10.1126/science.1082889. [DOI] [PMC free article] [PubMed] [Google Scholar]
- 27.Mootha VK, et al. Nature Genet. 2003;34:267. doi: 10.1038/ng1180. [DOI] [PubMed] [Google Scholar]
- 28.Trifunovic A, et al. Nature. 2004;429:417. doi: 10.1038/nature02517. [DOI] [PubMed] [Google Scholar]
- 29.Carelli V, Giordano C, d’Amati G. Trends Genet. 2003;19:257. doi: 10.1016/S0168-9525(03)00072-6. [DOI] [PubMed] [Google Scholar]
- 30.Reilly RF, Ellison DH. Physiol. Rev. 2000;80:277. doi: 10.1152/physrev.2000.80.1.277. [DOI] [PubMed] [Google Scholar]
- 31.Simon DB, et al. Nature Genet. 1996;12:24. doi: 10.1038/ng0196-24. [DOI] [PubMed] [Google Scholar]
- 32.Zager RA, Johnson AC, Hanson SY. Am. J. Physiol. Renal Physiol. 2003;285:F1092. doi: 10.1152/ajprenal.00187.2003. [DOI] [PubMed] [Google Scholar]
- 33.Atlante A, et al. Int. J. Mol. Med. 1998;1:709. doi: 10.3892/ijmm.1.4.709. [DOI] [PubMed] [Google Scholar]
- 34.Vasan RS, et al. JAMA. 2002;287:1003. doi: 10.1001/jama.287.8.1003. [DOI] [PubMed] [Google Scholar]
Associated Data
This section collects any data citations, data availability statements, or supplementary materials included in this article.


