

Summary
The transcriptional co-repressor SMRT utilizes two major receptor interacting domains (RID1 and RID2) to mediate nuclear receptor (NR) signaling through epigenetic modification. The physiological significance of such interaction remains unclear. We find SMRT expression and its occupancy on peroxisome proliferator-activated receptor (PPAR) target gene promoters are increased with age in major metabolic tissues. Genetic manipulations to selectively disable RID1 (SMRTmRID1) demonstrate that shifting SMRT repression to RID2-associated NRs, notably PPARs, causes premature aging and related metabolic diseases accompanied by reduced mitochondrial function and anti-oxidant gene expression. SMRTmRID1 cells exhibit increased susceptibility to oxidative damage, which could be rescued by PPAR activation or anti-oxidant treatment. In concert, several human SMRT gene polymorphisms are found to nominally associate with type 2 diabetes and adiponectin levels. These data uncover a role for SMRT in mitochondrial oxidative metabolism and the aging process, which may serve as a drug target to improve health span.
Introduction
Aging and metabolic diseases share certain common pathogeneses. Caloric excess results in metabolic diseases and shorter life expectancy. Conversely, caloric restriction (CR) improves metabolic parameters and increases longevity (Lee et al., 2009; Murphy et al., 2003). At the cellular level, the age-dependent decline in mitochondrial function has been implicated in aging and related metabolic disorders (Balaban et al., 2005; Reznick et al., 2007; Zid et al., 2009). The electron transport chain drives the oxidative phosphorylation (OXPHOS) of ADP to produce ATP. An unavoidable byproduct of mitochondrial respiration is the generation of reactive oxygen species (ROS). Many cellular mechanisms exist to protect the cell and its organelles from oxidative damage (Wallace and Fan, 2009). ROS scavenging proteins, including superoxide dismutase 1 (SOD1), SOD2, glutathione peroxidase (GPx), catalase and glutathione-S-transferases pi (GSTP), possess enzymatic functions that neutralize specific ROS. If uncontrolled, oxidative damage caused by ROS affects proteins, lipids and nucleic acids, leading to enzyme and membrane dysfunctions as well as genetic mutations. These changes further reduce mitochondrial function and increase susceptibility of cells to oxidative stress, which is a hallmark of aging (Kapahi et al., 1999; Kenyon, 2005). ROS have also been implicated in the pathogenesis of metabolic diseases (Roberts and Sindhu, 2009), while treatment with small anti-oxidant molecules improved glucose handling and insulin sensitivity (Houstis et al., 2006).
Several signaling pathways have been linked to both lifespan and metabolic homeostasis. Sir2, a member of the Sirtuin family of NAD-dependant deacetylases, is one of the signaling proteins attributed to the beneficial effects of CR (Guarente, 2006). Resveratrol activates the mammalian homolog of Sir2, SIRT1, to improve longevity and protect from the metabolic disturbances caused by high fat diet-induced obesity (Baur et al., 2006; Lagouge et al., 2006). The effects of SIRT1 on metabolism are mediated in part by PPARγ co-activator-1α (PGC-1α), which is activated through deacetylation by SIRT1 (Rodgers et al., 2005). Although not directly implicated in longevity, PGC-1α has been shown to promote the expression of ROS scavenger proteins thereby preventing neurodegeneration (St-Pierre et al., 2006). PGC-1α also regulates genes involved in oxidative metabolism and mitochondrial biogenesis by activating transcription factors (Lin et al., 2005), including PPARs. The PPAR nuclear receptor (NR) family consists of PPARα, PPARδ (also called PPARβ) and PPARγ, all of which are drug targets for components of metabolic syndrome (Lee et al., 2003; Reilly and Lee, 2008). PPARα and PPARγ exhibit more restricted effects on fatty acid β-oxidation and fat storage in the liver and adipocyte, respectively. PPARδ has a broad tissue expression pattern and has been shown to regulate fat catabolism and OXPHOS in muscle, brown adipose tissue (BAT) and macrophages (Kang et al., 2008; Pan et al., 2009; Wang et al., 2004).
The transcriptional activities of PPARs and many other NRs on target gene expression are modulated by co-activator and co-repressor complexes through epigenetic modifications (Glass and Rosenfeld, 2000). Co-activators, such as PGC-1α, recruit the p300 family of histone acetyltransferases to ligand-activated NRs to promote target gene expression. Reciprocally, unliganded NRs interact with co-repressor complexes containing histone deacetylases (HDACs), which inhibit transcription. Silencing mediator of retinoid and thyroid hormone receptors (SMRT) and nuclear receptor co-repressor (N-CoR), are the two major co-repressors that regulate the activity of many transcription factors (Privalsky, 2004). These two proteins are structurally similar containing two major nuclear receptor interaction domains (RID1 and RID2). Biochemical analyses have identified the IXXI(V)I sequence within RIDs, termed the CoRNR box motif, which provides the interface for NR/co-repressor interaction (Glass and Rosenfeld, 2000). These two RIDs preferentially interact with different NR groups. For example, retinoic acid receptors (RARs) associate with RID1, while most lipid sensing receptors, including PPARs and retinoid X receptors (RXRs), utilize RID2 located at the c-terminus (Hu et al., 2001). Alternative splicing events have been identified within this RID containing region, resulting in several splice variants, including one isoform with an additional, third RID domain, which enhances thyroid hormone receptor (TR) interaction (Cohen et al., 2001), and one without RID2. These observations indicate that each RID has specific functions through recruitment of distinct sets of NRs. Given the role of co-repressors in NR-mediated transcription, we sought to examine whether they are involved in suppression of NR activity in pathological conditions. We were particularly interested in the function of RID2, which recruits PPARs and other lipid-sensing receptors. Consequently, we have obtained a knockin mouse model, which selectively disables RID1. The mutant SMRT will mainly function as a co-repressor for RID2 associated NRs. Our results show that shifting SMRT repression to RID2 leads to inhibited PPAR activity and depressed OXPHOS and mitochondrial function. The data also reveal a role for SMRT in aging and the related metabolic disorders.
Results
A genetic model to study the role of SMRT in metabolic regulation
We found that SMRT mRNA and protein levels were induced in BAT and muscle from older mice independent of high fat diet feeding (Figure 1A and Figure S1B, 2-month versus 6-month old). SMRT protein, but not mRNA, was also elevated in white adipose tissue (WAT) with age. We hypothesized that SMRT may be involved in processes of age-related metabolic diseases. Accordingly, a genetic model designated as SMRTmRID1, in which the conserved amino acids of the CoRNR box in SMRT RID1 were mutated to alanine (IXXVI to AXXAA, Figure 1B), was studied. The complete description of the generation of this mouse model will be reported elsewhere. The resultant SMRT protein is expected to only associate with RID2-interacting receptors, including PPARs, which are known regulators of mitochondrial oxidative metabolism. SMRTmRID1 mice were born in normal Mendelian ratios. The expression of SMRT and N-CoR was not altered in these mice (Figure S1D and S1E). The SMRT c-terminal regions with wt RID1/2 (RID1+RID2, Figure 1B, bottom panel), mutant RID1 and wt RID2 (mRID1+RID2 from SMRTmRID1 mice) or a natural splice variant containing only RID1 (RID1), were placed downstream of GAL4-DNA binding domain (GAL4-DBD) for testing interaction against receptor ligand binding domains (LBD) fused to VP16 activation domain in the mammalian two-hybrid (M2) system (Fig. 1C, top panel). It has been shown that RARs interact primarily with SMRT RID1 and TRs and PPARs interact predominantly with RID2. The M2 interaction assay confirmed that the association between RARα and SMRT was reduced by the RID1 mutation and that TRα interacted equally well with RID1+RID2 and mRID1+RID2 (Figure 1C). Intriguingly, the interaction of mRID1+RID2 with PPARs was greater than that of wt RIDs, likely because in the absence of RID1-associated NR binding, RID2 becomes more readily available to bind PPARs (Figure 1D). In line with this, the untagged, wt PPARδ competed more efficiently with VP16-RARα for interaction with GAL4-mRID1+RID2 than GAL4-RID1+RID2 (Figure 1E). PPARδ was used here and in later experiments, as it is expressed in most tissues/cell types. The decreased and increased affinity of mRID1+RID2 for RAR and PPAR, respectively, could also be observed with DNA bound RAR/RXR and PPAR/RXR complexes in gel shift assays (Figure S1F). In addition, we found that while GAL4-N-CoR RID1+RID2 interacted equally well with VP16-PPARδ and VP16-RARα, GAL4-SMRT RID1+RID2 appeared to interact stronger with VP16-PPARδ (Figure 1F), indicating that SMRT may be more relevant for PPAR function compared to N-CoR. Another important metabolic regulator, LXRα, showed stronger interaction with N-CoR, whereas LXRβ associated weakly with both SMRT and N-CoR (Figure 1G) as reported previously (Hu et al., 2003). The interaction between LXRα/β and mRID1+RID2 was unaltered. These data suggest that SMRTmRID1 may serve as a model to examine the effect of increased SMRT repression on activities of NRs, notably the PPARs, a scenario likely to occur in conditions of metabolic dysregulation associated with aging when SMRT expression is up-regulated. Subsequently, SMRTmRID1 were bred into the C57BL/6 background, which is more suitable for metabolic studies.
Figure 1. Generation and characterization of SMRTmRID1 mutant.
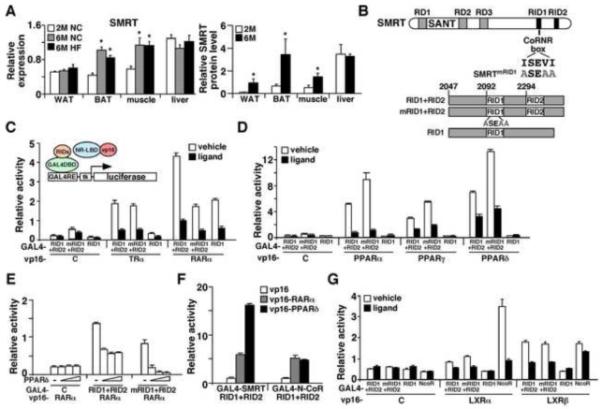
(A) Age-dependent up-regulation of SMRT expression. Left panel: Tissue RNA samples (n=6/group) were isolated from 2-month old normal chow (2M NC), 6-month old normal chow (6M NC) and 6-month old high fat fed (6M HF) C56BL/6 male mice. The expression of SMRT was determined by real-time PCR. Right panel: SMRT protein was immunoprecipitated from 2-month and 6-month old tissues and quantified by Western blotting and normalized to actin signal of the inputs (see also Figure S1). *p<0.05, comparing 6-month old to 2-month old. (B) Generation of SMRTmRID1 mice. Top panel: Diagram showing the domain structure of SMRT. In SMRTmRID1, the ISEVI motif in the CoRNR box of RID1 has been mutated to ASEAA. RD1-3: repression domains 1-3; RID: nuclear receptor interaction domain. Bottom panel: The C-terminus of SMRT containing the two major RIDs from wild type (RID1+RID2) and SMRTmRID1 mice (mRID1+RID2) as well as a splice variant lacking RID2 (RID1) were cloned into an expression vector downstream of GAL4 DNA binding domain (DBD) for interaction assays. (C) and (D) Mammalian 2-hybrid assays to quantify SMRTmRID1 and NR interaction. GAL4-DBD-SMRT RID constructs shown in (B) were co-transfected with the ligand binding domain (LBD) from various nuclear receptors fused to VP16 transactivation domain into AD293 cells, together with a luciferase reporter containing GAL4 binding sites and a renilla luciferase internal control. VP16 alone was included for control. (E) A competition assay showing PPARδ competes more efficiently with VP16-RARα for interaction with SMRTmRID1 than wt SMRT. Increasing amounts of untagged PPARδ were co-tranfected to determine the ability of PPARδ to reduce GAL4-RIDs/VP16-RARα interaction. (F) PPARδ preferentially interacts with SMRT over N-CoR, demonstrated by mammalian 2-hybrid assays. (G) Mammalian 2-hybrid assays to quantify LXR interaction with wt SMRT, SMRTmRID1 and N-CoR. Values are expressed as means±SEM. Ligand concentrations: T3: 100 nM; all-trans retinoic acid: 100 nM; GW7647 (PPARα): 1 μM; GW1929 (PPARγ): 1 μM; GW501516 (PPARδ): 0.1 μM; T0901317 (LXRα/β): 1 μM.
SMRTmRID1 mice develop premature aging and related metabolic diseases
Although born at the same weight as their wt littermates, both female and male SMRTmRID1 mice gained significantly more body weight with age on chow diet (Figure 2A and Figure S2A). Six-month old female SMRTmRID1 mice showed higher percentage body fat and decreased lean mass, as determined by dual energy X-ray absorptionmetry (DEXA) scanning (Figure 2B). DEXA also revealed that the bone mineral density was reduced in SMRTmRID1 mice (Figure 2C). In older animals, SMRTmRID1 mice developed cataracts, alopecia and gray hair sooner than wt controls (Figure 2D and 2E). In addition, the rotarod test demonstrated that SMRTmRID1 mice had diminished sensorimotor coordination (Figure 2F), implicating a premature aging phenotype. Accordingly, cohorts of male and female mice fed ad libitum were allowed to age and die of natural causes to determine life expectancy. Kaplan-Meier survival curves showed that both female (p=0.028) and male (p=0.012) SMRTmRID1 mice had shortened lifespan (Figure 2G). To determine whether SMRTmRID1 mice developed age-related metabolic diseases, metabolic studies were conducted in 6-month old female cohorts on chow diet. Similar results were found in male SMRTmRID1 mice (Figure S2). SMRTmRID1 mice had elevated levels of fasting serum triglycerides, cholesterol, glucose, insulin and leptin as well as reduced adiponectin concentrations, compared to control animals (Figure 3A-3C). Corticosterone levels were not significantly different. Glucose tolerance tests (GTT) and insulin tolerance tests (ITT) were performed to further characterize the insulin sensitivity. Throughout GTT, serum glucose was higher in SMRTmRID1 mice than in wt mice (Figure 3D), which was consistent with increased glucose production in primary hepatocytes (Figure S2E). ITT showed that SMRTmRID1 mice were more insulin resistance (Figure 3E). Furthermore, insulin-stimulated p-Akt was reduced in SMRTmRID1 muscle (Figure 3F, no significant difference in adipose tissue and liver, data not shown). Muscle GLUT4 levels were also reduced (Figure 3G). These defects led to blunted insulin-induced glucose uptake in isolated soleus muscle from SMRTmRID1 mice. These findings demonstrate that SMRTmRID1 mice develop the metabolic syndrome including hyperlipidemia and insulin resistance.
Figure 2. SMRTmRID1 mice show premature aging phenotypes.
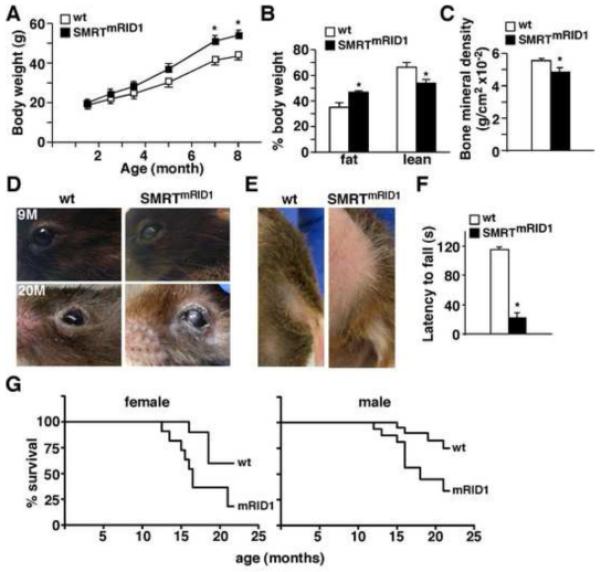
(A) SMRTmRID1 female mice gain more weight on chow diet (n=10/genotype). (B) and (C) body composition and bone mineral density determined by DEXA in 6-month old female mice. (D) The cataract phenotype in SMRTmRID1 mice. 9M: 9-month old; 20M: 20-month old. (E) SMRTmRID1 mice (20-month old) exhibit alopecia in abdominal and lower back areas. The image also demonstrates hair graying. (F) Rotarod test to examine sensorimotor coordination in 6-month old female (n=4/genotype). (G) SMRTmRID1 mice have shortened life span. Cohorts of female and male mice (n=20/genotype) on normal chow were allowed to age and die of natural causes to determine life expectancy using Kaplan-Meier survival curves. Values are expressed as means±SEM. *p<0.05, comparing wt to SMRTmRID1 mice.
Figure 3. SMRTmRID1 mice develop metabolic diseases.
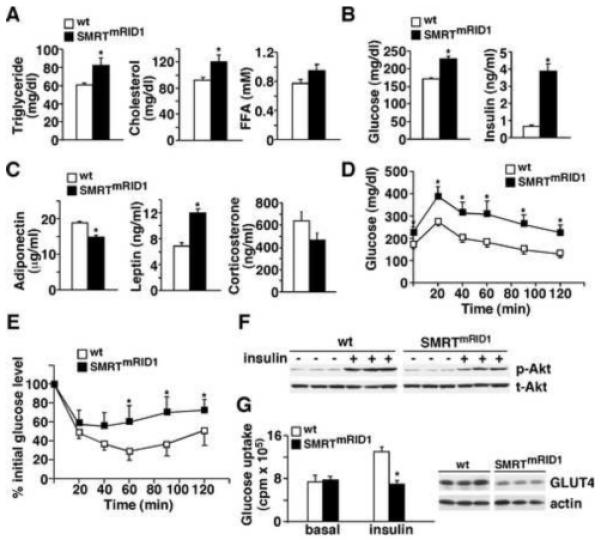
(A) to (C) blood chemistry analyses of fasting lipids, glucose, insulin and adipokine levels in 6-month old female mice (n=7/genotype) on chow diet. (D) and (E) Glucose tolerance test and insulin tolerance test. Mice were fasted 5 hr before the experiments. (F) SMRTmRID1 mice exhibit reduced insulin sensitivity in muscle. Insulin signaling in muscle was determined by insulin stimulated phospho-Akt (p-Akt). Mice (n=5/genotype, showing representative samples from 3 individual mice) were i.p. injected with PBS or insulin (2U/kg body weight). Muscle samples were collected 15 min later and analyzed by Western blotting. The level of total Akt (t-Akt) was included for loading control. (G) Insulin stimulated glucose uptake conducted in soleus muscle using radioactive 2-deoxy-D-glucose. Right panel: Western blotting showing GLUT4 protein levels in muscle from 3 individual mice/genotype. Values are expressed as means±SEM. *p<0.05, comparing wt to SMRTmRID1 mice. Male mice showed similar phenotypes (Figure S2).
PPAR signaling pathways are suppressed in SMRTmRID1 mice
To identify metabolic pathways disturbed in SMRTmRID1 mice, gene expression analyses were performed. In BAT from SMRTmRID1 mice, the expression of medium-chain acyl-coenzyme A dehydrogenase (MCAD), uncoupling protein-3 (UCP-3), cidea (a BAT marker) and several genes in the OXPHOS pathway was down-regulated compared to control animals (Figure 4A). Levels of PPARδ and ERRα, two NRs known to regulate oxidative metabolism, were also reduced. A similar reduction in genes encoding fatty acid oxidation and OXPHOS together with PPARα, a main regulator of hepatic lipid metabolism, was observed in the liver of SMRTmRID1 mice compared to control animals (Figure 4B). In contrast, the level of CYP26a1, an RAR target gene was increased. In white adipose tissue (WAT), in addition to fatty acid oxidation and OXPHOS genes, the expression of PPARγ and its targets, ap2 and adiponectin, was decreased in SMRTmRID1 mice (Figure 4C). Leptin expression was not changed. The elevated circulating leptin was likely due to increased total fat mass. In muscle, OXPHOS genes were suppressed (Figure 4D). There was a reduction in glucose transport 4 (GLUT4), although it was not statistical significant. These data suggested that PPAR signaling pathways were suppressed in SMRTmRID1 mice. In fact, both basal activity and ligand activation of all three PPARs (GAL4-DBD-PPAR-LBD constructs) were reduced in SMRTmRID1 pre-adipocytes/fibroblasts (Figure 5A). To assess PPAR activity on target genes, chromatin immunoprecipitation (ChIP) of the endogenous MCAD gene was conducted using antibody against SMRT and IgG as a control in primary mouse embryonic fibroblasts (MEFs). MCAD was used since it is a well-defined PPAR target (Gulick et al., 1994) and its expression was down-regulated in multiple tissues in SMRTmRID1 mice. The expression of MCAD gene was reduced in SMRTmRID1 MEFs ± PPARδ ligand (Figure 5B, insert), which was associated with an increase in SMRT occupancy of the PPAR response element (PPRE) on MCAD promoter (Figure 5B). Similarly, SMRT occupancy on MCAD PPRE was significantly higher in BAT and the liver of SMRTmRID1 mice, compared to control animals (Figure 5C). In contrast, SMRT binding to the RAR response element (RARE) of CYP26a1 was reduced, which was consistent with the in vitro M2 interaction results (Figure 1C and 1D). To probe the relevance of the current SMRTmRID1 model to the aging process, we compared SMRT ChIP in tissues from 2-month and 6-month old wt mice and found increased and decreased SMRT occupancy on MCAD PPRE and CYP26a1 RARE, respectively, in 6-month old BATs and livers (Figure 5D). Thus, SMRTmRID1 mimics the age-dependent modulation of SMRT activity. These observations suggest that SMRTmRID1 suppresses the expression of genes encoding fatty acid catabolism and oxidative metabolism, in part, through inhibition of PPAR transcriptional activities. In addition, increased SMRT repression may contribute to the reduction in mitochondrial OXPHOS capacity in aged individuals.
Figure 4. Suppressed fatty acid oxidation and oxidative metabolism in SMRTmRID1 mice.
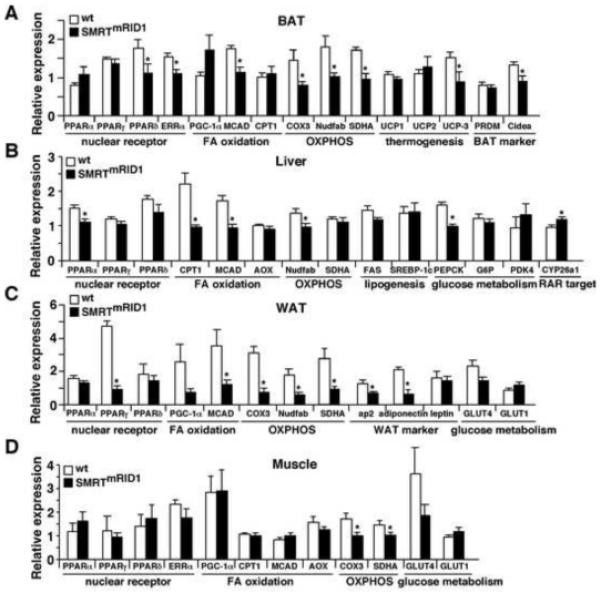
(A) to (D) gene expression profiling by real-time PCR of brown adipose tissue (BAT), liver, white adipose tissue (WAT) and muscle from wt and SMRTmRID1 female mice on normal chow (6-month old, n=6/genotype) after 5 hr fasting. OXPHOS: oxidative phosphorylation. Values are expressed as means±SEM. *p<0.05, comparing wt to SMRTmRID1 mice.
Figure 5. Assessment of PPAR signaling in SMRTmRID1 mice.
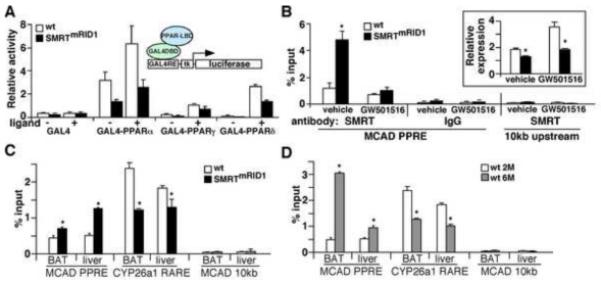
(A) The transactivation activities of PPARs are suppressed in SMRTmRID1 primary pre-adipocytes derived from WAT. Pre-adipocytes/fibroblasts were isolated from the stromal vascular fraction of white fats. GAL4-DBD-PPAR-LBD constructs were transfected with a GAL4-luciferase reporter into these cells ± ligands. GAL4-DBD alone was included as a control. Ligand concentrations: GW7647 (PPARα): 1 μM; GW1929 (PPARγ): 1 μM; GW501516 (PPARδ): 0.1 μM. (B) SMRTmRID1 reduces PPAR activity on target gene promoter. Chromatin immunoprecipitation (ChIP) was conducted in primary MEFs using antibody against SMRT or IgG as a control. SMRT occupancy on endogenous MCAD promoter was determined by real-time PCR using a primer set flanking the PPAR response element (PPRE). A control primer set amplifying a region 10 kb upstream of the MCAD gene was included as a negative control. Insert: The expression of MCAD mRNA in wt and SMRTmRID1 MEFs ± GW501516 (PPARδ ligand) was determined by real-time PCR. (C) SMRT occupancy on target gene promoter in wt and SMRTmRID1 mice. Brown adipose tissue (BAT) and liver samples were collected from 2-month old mice (n=3/genotype) for ChIP using anti-SMRT antibody. SMRT binding to MCAD PPRE or CYP26a1 RARE (RAR target) was determined by real-time PCR. (D). SMRT occupancy on target gene promoter in 2-month (2M) and 6-month (6M) old mice determined by ChIP. Values are expressed as means±SEM. *p<0.05, comparing wt to SMRTmRID1 mice/cells or 2M to 6M.
Reduced mitochondrial function in SMRTmRID1 mice
To determine whether the altered gene expression pattern has functional consequences, fatty acid β-oxidation assays were conducted in BAT organ culture and in primary cells using radioactive tracers. We observed a 3-fold decrease in the rate of β-oxidation in BAT of SMRTmRID1 mice, compared to that of control animals (Figure 6A). Reduced fatty acid oxidation was also observed in hepatocytes and pre-adipocytes isolated from SMRTmRID1 mice. Furthermore, the ratio of mitochondrial DNA to nuclear DNA content was reduced in SMRTmRID1 muscle and BAT, indicating reduced mitochondrial number in these tissues (Figure 6B). Similarly, SMRTmRID1 MEFs had reduced mitochondrial staining by MitoTracker probes (Figure 6C). These results suggested that the metabolic phenotype of SMRTmRID1 mice was caused by reduced fat burning capacity and compromised mitochondrial oxidative metabolism. In fact, using metabolic cages we determined that SMRTmRID1 mice consumed less oxygen than wt mice (Figure 6D). They also exhibited a lower core body temperature. There was no significant difference in food intake or activity. Histological analyses demonstrated increased BAT lipid accumulation and hepatic steatosis in SMRTmRID1 mice (Figure 6E). There was no difference in WAT morphology (Figure S3A). These data indicate that mitochondrial function is a main target of SMRT in developing metabolic disorders.
Figure 6. SMRTmRID1 inhibits mitochondrial function.
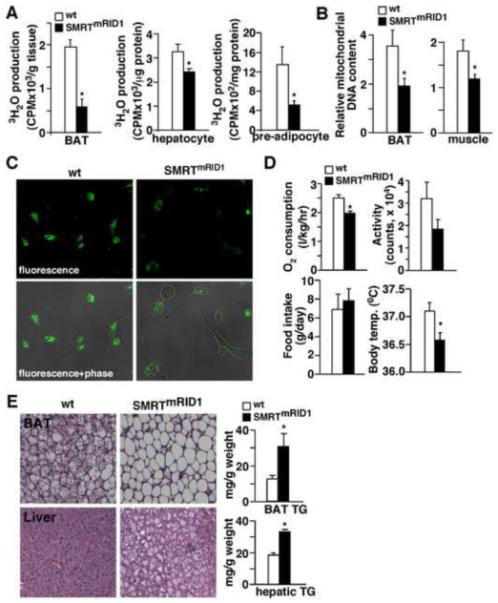
(A) Assessment of fatty acid β-oxidation in brown fat (BAT) organ culture, primary hepatocytes and pre-adipocytes/fibroblasts. The rate of fatty acid oxidation was determined by 3H-palmitate breakdown to 3H2O. (B) Assessment of mitochondrial DNA content in BAT and muscle. Mitochondrial DNA was quantified by real-time PCR and normalized to nuclear DNA content. (C) SMRTmRID1 MEFs have reduced mitochondrial content. MitoTracker staining (green fluorescence) was conducted to determine mitochondrial content. (D) SMRTmRID1 mice show reduced O2 consumption and lowered body temperature. O2 consumption, activity and food intake were determined by metabolic cages. (E) Histological analyses of BAT and liver sections (H & E staining) to examine lipid accumulation (see also Figure S3). Tissue triglyceride (TG) content was measured by enzymatic assays. Muscle, BAT and pre-adipocytes were isolated from 6-month old mice. Primary hepatocytes were from 2.5-month old mice. Values are expressed as means±SEM. *p<0.05, comparing wt to SMRTmRID1 mice/cells.
Increased susceptibility to oxidative stress in SMRTmRID1 mice
Oxidative damage and diminished mitochondrial function contributes to the process of aging (Balaban et al., 2005). A common observation across different species is that the sensitivity to oxidative stress inversely correlates with lifespan (Kapahi et al., 1999; Kenyon, 2005). To determine the stress response, we challenged wt and SMRTmRID1 primary MEFs with hydrogen peroxide (H2O2) and assayed cell viability after 24 hr. SMRTmRID1 cells were more sensitive to oxidative damage and exhibited decreased survival at a lower H2O2 concentration than wt cells (Figure 7A), which was accompanied by increased ROS production (Figure 7B). Similar results were obtained with paraquat treatment (an ROS producing agent, Figure 7C). The decreased stress resistance correlated with reduced expression of anti-oxidant genes (Figure 7D). Furthermore, a 2-fold increase in SMRT expression achieved by transient transfection in HepG2 cells (a human hepatoma cell line) was sufficient to reduce anti-oxidant gene expression and decrease survival upon H2O2 treatment (Figure 7E and S4A). Down-regulation of catalase, GPx1 and SOD1 in WAT, GSTP1 and GPx1 in muscle (Figure 7F) and catalase in BAT (data not shown) was also found in SMRTmRID1 mice. Oxidative damage is believed to mediate cellular senescence (Colavitti and Finkel, 2005), which could be assessed by senescence-associated β-galactosidase (SA-β-gal) activity. By passage 10-12, many SMRTmRID1 MEFs exhibited an enlarged flattened morphology, which stained positive for SA-β-gal (Figure 7G, blue cell), whereas wt MEFs remained mostly β-gal negative. A similar increase in the SA-β-gal activity was detected in WAT from SMRTmRID1 mice (Figure 7G, bottom panel). To provide causative evidence for the described defect, MEFs were pre-treated with PPARδ ligand for 60 hours, which increased stress resistance in SMRTmRID1 MEFs (Figure 7G). PPARδ ligand treatment up-regulated MCAD, catalase, GPx1 and SOD1 in wt and to a lesser extent, in SMRTmRID1 cells, whereas PPARδ−/− MEFs exhibited increased susceptibility to oxidative damage similar to that in SMRTmRID1 MEFs (Figure S4B and S4C), suggesting that SMRT repression of PPARδ activity may contribute to the reduced oxidative resistance. Pre-treatment with N-acetylcysteine (NAC, an anti-oxidant) for 1 hour also completely rescued the phenotype of SMRTmRID1 MEFs (Figure 7I). In addition, NAC normalized the insulin response of SMRTmRID1 mice in ITT (Figure 7J). These results establish a link between suppressed mitochondrial function, decreased stress resistance and age-related deterioration by SMRTmRID1.
Figure 7. Increased susceptibility to oxidative damage and premature senescence in SMRTmRID1 cells.
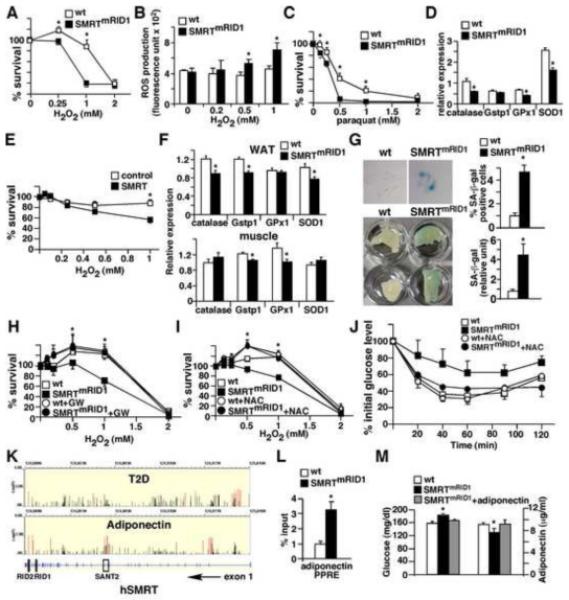
(A) Increased susceptibility to oxidative stress in SMRTmRID1 primary MEFs. Wt and SMRTmRID1 MEFs were treated with H2O2 to induce oxidative stress and cell survival was determined 24 hr later. (B) Elevated ROS production in SMRTmRID1 MEFs determined by CM-H2DCFDA. (C) SMRTmRID1 MEFs exhibit reduced survival upon paraquat treatment. (D) Down-regulation of anti-oxidant genes in SMRTmRID1 MEFs determined by real-time PCR. (E) SMRT over-expression reduces stress resistance in HepG2 cells. HepG2 cells were transfected with either the empty vector (control) or SMRT expression vector to achieve a 2-fold increase in SMRT mRNA levels (see Figure S4A). H2O2 treatment started 24 hr after transfection. (F) Reduced tissue expression of genes encoding anti-oxidant defense mechanism in SMRTmRID1 mice determined by real-time PCR. (G) SMRTmRID1 cells show premature senescence. Top panel: Wt and SMRTmRID1 MEFs at passage 12 were stained with X-gal to examine senescence-associated β-galactosidase (SA-β-gal) activity (blue cells). Bottom panel: SA-β-gal activity in white adipose tissues from 6-month old mice. The blue staining in tissue lysate was quantified and normalized to protein concentration. (H) PPARδ activation rescues the phenotype of oxidative stress response in SMRTmRID1 cells. PPARδ ligand pre-treatment (0.1 μM GW501516 for 60 hours) increased the survival of SMRTmRID1 cells. (I) Anti-oxidant pre-treatment normalizes the stress resistance of SMRTmRID1 MEFs. Cells were treated with 0.5 mM N-acetylcystein (NAC, an anti-oxidant) 1 hr before H2O2 treatment. (J) Insulin tolerance test showing NAC treatment reverts the reduced insulin response in SMRTmRID1 mice. NAC (10 mg/ml) was giving in drinking water for one week. The difference between wt and SMRTmRID1 mice (n=5/genotype, 6-8 month old females) for each time point without NAC treatment was statistically significant (not significant after treatment). (K) The associations of SNPs in human SMRT (N-COR2) gene with the risk of type 2 diabetes (T2D) and plasma high molecular weight (HMW) adiponectin concentration, annotated with the gene structure (bottom panel, exons are shown). The y axis represents −log(P value) from the logistic regression (T2D) and linear regression (HMW adiponectin) analyses. All identified SNPs are shown. The red lines represent the associations of nominal significance (P value <0.05, see also Table S1). (L) ChIP showing increased SMRT binding on the PPRE of adiponectin promoter in SMRTmRID1 adipocytes. Primary adipocytes were isolated from 2-month old mice. IgG ChIP or 10kb upstream negative controls showed no specific bindings (data not shown). (M) Adiponectin administration normalizes the glucose level in SMRTmRID1 mice. Tail vein injection of 10 μg recombinant adiponectin in SMRTmRID1 mice increased the serum adiponectin level similar to that in wt mice (shown on the right), which normalized the blood glucose concentration (shown on the left). Values are expressed as means±SEM. *p<0.05, comparing wt to SMRTmRID1 mice/cells.
SMRT and human diseases
The human SMRT gene is located on chromosome 12. We conducted preliminary analyses to examine potential associations of single-nucleotide polymorphisms (SNPs) in the human SMRT gene (N-CoR2) with either the risk of type 2 diabetes (T2D) or the level of high molecular weight (HMW) adiponection, an adipokine that controls glucose and lipid homeostasis. Genotyping was conducted for 2,745 patients with T2D and 3,148 healthy controls (2422 males and 3221 females) from the Nurses’ Health Study (NHS) and Health Professionals Follow-Up Study (HPFS). After adjusting for age and body mass index, we found a major cluster of SNPs within intron 1 of the human SMRT gene that were nominally associated with T2D (Figure 7K and table S1a). Clusters of SNPs associated with adiponectin levels (NHS only) could be found in intron 1, introns 15 and 16 (next to exons encoding SANT domain 2) and introns close the c-terminus of SMRT gene where exons encoding RIDs are located (Figure 7K and table S1b). In line with the SNP data, we found an increase in SMRT binding to the PPRE of adiponectin promoter in SMRTmRID1 adipocytes (Figure 7L). In addition, adiponectin administration to normalize the circulating concentration in SMRTmRID1 mice reduced the blood glucose level to that of wt animals (Figure 7M). Adiponectin also reverted the increased glucose production phenotype in SMRTmRID1 primary hepatocytes (Figure S2E). These data suggest that adiponectin is a potential target of SMRT.
Discussion
In this study, we use SMRTmRID1 mice to investigate the effects of SMRT repression on RID2-associated NRs. SMRTmRID1 mice show depressed mitochondrial function, partly mediated by inhibition of PPAR activities. This defect is accompanied by increased sensitivity to oxidative damage, accelerated aging and development of metabolic deterioration. The expression of SMRT is up-regulated with age in tissues that normally have high OXPHOS, which is associated with increased SMRT occupancy on PPAR target gene promoters. The current work provides a potential mechanism through which SMRT reduces metabolic rate and mediates age-related metabolic diseases.
The specificity of SMRT/NR interaction is determined by RID1/2, together with the third RID (upstream of the two RIDs) and splice variants lacking RID2. Our data indicate that when RID1 was mutated, PPAR/SMRT association was greatly enhanced (Figure 1D), indicating that RID1/2 and NR interaction is competitive. However, this competition mode is specific, as RID1 mutation did not affect TR/RID2 interaction. Interestingly, ChIP results suggest a switch of SMRT utilization from RID1-dependent to RID2-dependent NRs with age, as demonstrated by promoter occupancy of the CYP26a1 RARE and MCAD PPRE. It has been shown that the expression of RARs is reduced by aging (Pallet et al., 1997), which may be responsible for the reduced SMRT recruitment to the CYP26a1 promoter and may increase SMRT availability for PPARs. The SMRTmRID1 mouse model mimics this switch and, as such, offers a unique opportunity to distinguish the pathways regulated by RID2 involving in age-related pathophysiology. Several mouse models have been generated to examine the function of SMRT and N-CoR in NR function, including N-CoR point mutations, which abolished HDAC3 recruitment and exhibited defects in circadian clock gene expression controlled by Rev-erbα (Alenghat et al., 2008), and conditional deletion of the region containing RID1 and the third RID of N-CoR in the liver, which led to dysregulated thyroid hormone action (Astapova et al., 2008). Point mutations that abolished both RID1 and RID2 interaction of SMRT in mice (SMRTmRID mice in a mixed C57BL/6 and sv129 background) also showed abnormal thyroid hormone receptor signaling and the associated metabolic defects (Nofsinger et al., 2008). These mice had increased fat to body weight ratio caused by uncontrolled PPARγ activation, although they gained significantly less weight. Using stable MEFs derived from wt, SMRTmRID1 or SMRTmRID mice in the mixed background, we also observed compromised anti-oxidant defense capacity in SMRTmRID1 cells (Figure S3C-E). While we confirmed that SMRTmRID MEFs had increased PPARγ activity, their ability to handle oxidative stress was comparable to wt cells. It is not unexpected that SMRTmRID MEFs did not outperform wt cells in stress resistance, as PPARδ activation (or NAC treatment) did not shift the survival curve in wt MEFs. These two models therefore provide in vivo evidence supporting a specific role of RID2 for PPAR function. The current SMRTmRID1 mouse study reveals that shifting SMRT repression to increase RID2 mediated interaction to receptors like PPARs results in accelerated aging and metabolic syndrome.
Both SMRT and N-CoR whole body knockout mice are embryonic lethal, indicating non-redundant functions for these co-repressors (Ghisletti et al., 2009; Hermanson et al., 2002; Jepsen et al., 2007). Our data demonstrate age-dependent up-regulation of N-CoR mRNA in the liver (Figure S1A) and SMRT mRNA in muscle and BAT, both of which play important roles in fat burning and oxidative metabolism. At the protein level, SMRT is increased in WAT, in addition to BAT and muscle in older animals. Although SMRT expression in the liver remains unchanged in older mice, there is also more hepatic SMRT binding to MCAD PPRE with age. These observations implicate a multi-tier regulation of SMRT activity by aging and predict a role for SMRT in major metabolic tissues. In fact, transcriptional programs encoding OXPHOS and fatty acid catabolism pathways are down-regulated in most of these tissues in SMRTmRID1 mice. We attribute this phenotype to increased suppression of PPAR activities by the mutant SMRT protein, as PPARs are major regulators of oxidative metabolism and the expression of PPARδ, PPARα and PPARγ was down-regulated in BAT, liver and WAT of SMRTmRID1 mice, respectively. In M2 interaction and ChIP assays, SMRTmRID1 and PPAR association was enhanced. As a result, the transactivation activities of PPARs were reduced in primary cells isolated from SMRTmRID1 mice. The adipogenic potential of SMRTmRID1 pre-adipocytes was only moderately affected, possibly because the fact that the inhibition of PPARγ activity was partial and levels of other adipogenic transcriptional factors, including CEBPβ and CEBPδ, remained similar (Figure S3B). Accordingly, the obesity phenotype of SMRTmRID1 mice is likely mediated by reduced mitochondrial metabolic capacity. Of note, under unchallenged conditions, the hearts of SMRTmRID1 mice appeared morphologically normal and the expression pattern of OXPHOS was mostly unaltered (except for a reduction in GPx1, Figure S2D), suggesting that SMRT is less critical in this tissue. We cannot rule out the possibility that other potential RID2-associated NRs may contribute to the deregulated mitochondrial function, such as ERRα. However, ERRα and SMRT do not interact in vitro (data not shown). Derepression of RID1-associated NRs, such as RARs, could also contribute to the phenotype. Although the role of RA signaling in metabolism is less defined, it has been shown that retinaldehyde, the precursor of RA, modulates metabolic homeostasis partly through suppressing PPARγ responses (Ziouzenkova et al., 2007). Therefore, dysregulated RA/RAR activities could also have an impact on PPAR-mediated regulation. Interestingly, RAR signaling in embryonic development seems to be unaffected in SMRTmRID1 mice, probably because the RID1 mutation does not completely abolish RAR/SMRT interaction and/or N-CoR provides sufficient repression function. Regardless, these results demonstrate a function for SMRT in the control of oxidative metabolism.
Although assessment of stress resistance in MEFs is one of the standard approaches for aging studies, the limitation of such assay is that it provides correlative results. It is also possible that the observed mitochondrial dysfunction is a consequence of metabolic defects. However, several lines of evidence indicate that SMRT suppression of mitochondrial function and the anti-oxidant defense mechanism accelerates aging and related metabolic diseases. SMRT over-expression in HepG2 cells was sufficient to reduce anti-oxidant gene expression and stress resistance, whereas NAC treatment normalized the stress and insulin responses in SMRTmRID1 MEFs and mice, respectively. In addition, PPARδ activation, which enhanced mitochondrial function, also rescued the phenotype of increased sensitivity to oxidative damage in SMRTmRID1 MEFs. Population based studies further demonstrate nominal association of human SMRT gene SNPs with T2D and levels of adiponectin. Adiponectin is a PPARγ target gene known to regulate mitochondrial function and metabloism through activation of AMP activated kinase (AMPK) (Kadowaki and Yamauchi, 2005; Kahn et al., 2005). AMPK has also been shown to control longevity in C. elegans (Greer et al., 2009). Most of the SNPs are located in intron 1 and introns close to exons encoding SANT2 domain and RIDs. These SNPs may modify the expression and/or splicing of SMRT, which are expected to affect the suppressive activity and NR interacting preference. Additional work will be required to determine the functional relevance of these SNPs in human SMRT gene to define the relationship between SMRT, age-related decline in mitochondrial function and human diseases. The current study establishes a molecular basis for designing therapeutic approaches that release SMRT RID2-meidated repression, such as PPARδ agonists, to increase the mitochondrial integrity and reduce oxidative stress. Future work aiming to identify pathways that up-regulate (or down-regulate) SMRT and examine the interaction between dietary fats, PPARs and SMRT will further provide insights into drug discovery to improve health span.
Experimental Procedures
SMRTmRID1 mice and metabolic studies
SMRTmRID1 mice were provided by Dr. Ronald M. Evans at the Salk Institute and were generated similarly to SMRTmRID mice (mutations in both RID1 and RID2) in a mixed background (50% SV129 and 50% C57BL/6) as described previously (Nofsinger et al., 2008). The detailed methodology of SMRTmRID1 mouse generation will be reported elsewhere. They were backcrossed 2 generations to the C57BL/6 background (87.5%). Heterozygous mice were mated to create cohorts of age-match wt and SMRTmRID1 mice. Six-month old female and male mice were used to assess metabolic capacity after 5 hr fast. Experiments were repeated and data was collected from multiple cohorts (n=5-8/cohort/genotype). GTT was performed by intraperitoneal (i.p.) injection of 1.5 g glucose/kg body weight and ITT was conducted using 1 U insulin/kg. Recombinant adiponectin protein (AXXORA, LLC) was administered through tail vein (10 μg) and blood samples were collected one hour later for glucose and adiponectin concentration analyses. Control PBS injection had no effect. Tissues specific insulin signaling was determined by i.p. injection of 2 U insulin/kg or control saline. Tissues were collected 15 min later for determining insulin stimulated Akt phosphorylation using anti ser473 Akt antibody (Cell signaling). Serum hormones were measured using commercial ELISA kits (R&D Systems, Millipore and Cayman Chemicals). Metabolic cage studies were performed using a monitoring system from Columbus Instruments. Sensorimotor coordination was assayed with a fixed speed Rotarod (4rpm). Statistics analyses were performed using Student’s t-Test (2-tailed), except for survival curves, which were determined using the Mantel-Haenszel logrank test. All mice were housed in a barrier facility, fed normal chow, and kept on a 12 hr light, 12 hr dark cycle. Animal studies were approved by the Harvard Medical Area Standing Committee on Animals.
Primary cells and in vitro assays
Hepatocytes were isolated by portal vein perfusion with blendzyme (Roche) and cultured in William’s E media with 5% FBS. Primary preadipocytes/fibroblasts were derived from the stromal vascular fraction of white adipose tissue after collagenase digestion. The rate of fatty acid β-oxidation was determined by measuring 3H-palmitate breakdown to 3H2O. The glucose uptake assay was conducted using 2-3H-deoxy-D-glucose in Krebs-Ringer bicarbonate HEPES buffer ± 100nM insulin. MEFs were isolated from e15 embryos. For the oxidative stress assays, MEFs (or HepG2 cells) were plated to confluence and allowed to attach overnight. H2O2 or paraquat was added to the indicated final concentration and the cells were incubated for another 24 hr. NAC (0.5 mM) was added for 1hr and removed prior to H2O2 treatment. To examine the ligand effect, cells were plated in media ± 0.1 μM GW501516 for 60 hr before H2O2 treatment. Cell survival was assayed using the ATP bioluminescent somatic cell assay kit (Sigma-Aldrich). ROS production was determined by incubating MEFs ± 5 μM CM-H2DCFDA (Invitrogen) for 30 min. Fluorescence units were measured and normalized to protein concentration. ChIP of early passage MEFs or tissues was performed using the SimpleChIP enzymatic chromatin IP kit (Cell signaling). The primer pair used for real-time PCR was based on the reported PPRE on mouse MCAD (Gulick et al., 1994) or adiponectin promoter (Iwaki et al., 2003). A second pair located 10 kb upstream of the MCAD/adiponectin gene was included as a negative control. The primers for RARE on mouse CYP26a1 promoter was described previously (Loudig et al., 2000). Anti-SMRT antibody was from Santa Cruz Biotechnology.
Mitochondrial DNA content, gene expression, transient transfection and SNP analysis
Relative mitochondrial DNA and nuclear DNA levels were determined using real-time PCR primers specific to mitochondrial gene NADH dehydrogenase subunit 1 (ND1) and genomic gene 36B4. RNA was reverse transcribed with oligo-dT and random hexamer primers (Thermo Scientific) and gene expression was determined by SYBR green based real-time PCR using 36B4 for normalization. The expression in human HepG2 cells was normalized to 18S. To determine SMRT protein levels, tissue lysates were subjected to immunoprecipitation with anti-SMRT antibody (Santa Cruz biotechnology), followed by immunoblotting (Figure S1B and S1E). For normalization, actin levels in the input were determined. Quantification was performed using ImageJ. The mammalian 2-hybrid assay was conducted in AD293 cells cultured in dialyzed FBS depleted of steroid/non-steroid hormones and lipoproteins to reduce nuclear receptor ligands in the media. Luciferase activities were determined 48 hours after transfection using the dual luciferase system (Promega). HepG2 cells were transfected with control or SMRT expression vectors 24 hr prior to the oxidative stress assay. All of the expression vectors were under the control of a CMV promoter. The populations, data collection and statistical analyses for human SMRT gene SNPs are described in supplemental materials.
Supplementary Material
Acknowledgments
We thank Drs. James Mitchell and Wei Xu for valuable comments and Dr. Hotamisligil (Harvard School of Public Health) for assistance in metabolic cages and DEXA experiments. S.M. Reilly was supported by NIEHS training grant (T32ES07155). P. Bhargava was supported by NIDDK training grant (T90DK070078). This work was supported by: Howard Hughes Medical Institute, the Glenn Foundation, the Helmsley Foundation and NIH grants (5R37DK057978 and 5 R01HD027183) (R.M.E); American Heart Association, Boston Obesity Nutrition Research Center (DK46200) and NIH grant (R01HL71981) (L.Q.); NIH grants (DK58845 and U01HG004399) (F.B.H); American Heart Association, American Diabetes Association and NIH grant (R01DK075046) (C.-H.L.).
Footnotes
Publisher's Disclaimer: This is a PDF file of an unedited manuscript that has been accepted for publication. As a service to our customers we are providing this early version of the manuscript. The manuscript will undergo copyediting, typesetting, and review of the resulting proof before it is published in its final citable form. Please note that during the production process errors may be discovered which could affect the content, and all legal disclaimers that apply to the journal pertain.
References
- Alenghat T, Meyers K, Mullican SE, Leitner K, Adeniji-Adele A, Avila J, Bucan M, Ahima RS, Kaestner KH, Lazar MA. Nuclear receptor corepressor and histone deacetylase 3 govern circadian metabolic physiology. Nature. 2008;456:997–1000. doi: 10.1038/nature07541. [DOI] [PMC free article] [PubMed] [Google Scholar]
- Astapova I, Lee LJ, Morales C, Tauber S, Bilban M, Hollenberg AN. The nuclear corepressor, NCoR, regulates thyroid hormone action in vivo. Proc Natl Acad Sci U S A. 2008;105:19544–19549. doi: 10.1073/pnas.0804604105. [DOI] [PMC free article] [PubMed] [Google Scholar]
- Balaban RS, Nemoto S, Finkel T. Mitochondria, oxidants, and aging. Cell. 2005;120:483–495. doi: 10.1016/j.cell.2005.02.001. [DOI] [PubMed] [Google Scholar]
- Baur JA, Pearson KJ, Price NL, Jamieson HA, Lerin C, Kalra A, Prabhu VV, Allard JS, Lopez-Lluch G, Lewis K, Pistell PJ, Poosala S, Becker KG, Boss O, Gwinn D, Wang M, Ramaswamy S, Fishbein KW, Spencer RG, Lakatta EG, Le Couteur D, Shaw RJ, Navas P, Puigserver P, Ingram DK, de Cabo R, Sinclair DA. Resveratrol improves health and survival of mice on a high-calorie diet. Nature. 2006;444:337–342. doi: 10.1038/nature05354. [DOI] [PMC free article] [PubMed] [Google Scholar]
- Cohen RN, Brzostek S, Kim B, Chorev M, Wondisford FE, Hollenberg AN. The specificity of interactions between nuclear hormone receptors and corepressors is mediated by distinct amino acid sequences within the interacting domains. Mol Endocrinol. 2001;15:1049–1061. doi: 10.1210/mend.15.7.0669. [DOI] [PubMed] [Google Scholar]
- Colavitti R, Finkel T. Reactive oxygen species as mediators of cellular senescence. IUBMB Life. 2005;57:277–281. doi: 10.1080/15216540500091890. [DOI] [PubMed] [Google Scholar]
- Ghisletti S, Huang W, Jepsen K, Benner C, Hardiman G, Rosenfeld MG, Glass CK. Cooperative NCoR/SMRT interactions establish a corepressor-based strategy for integration of inflammatory and anti-inflammatory signaling pathways. Genes Dev. 2009;23:681–693. doi: 10.1101/gad.1773109. [DOI] [PMC free article] [PubMed] [Google Scholar]
- Glass CK, Rosenfeld MG. The coregulator exchange in transcriptional functions of nuclear receptors. Genes Dev. 2000;14:121–141. [PubMed] [Google Scholar]
- Greer EL, Banko MR, Brunet A. AMP-activated protein kinase and FoxO transcription factors in dietary restriction-induced longevity. Ann N Y Acad Sci. 2009;1170:688–692. doi: 10.1111/j.1749-6632.2009.04019.x. [DOI] [PMC free article] [PubMed] [Google Scholar]
- Guarente L. Sirtuins as potential targets for metabolic syndrome. Nature. 2006;444:868–874. doi: 10.1038/nature05486. [DOI] [PubMed] [Google Scholar]
- Gulick T, Cresci S, Caira T, Moore DD, Kelly DP. The peroxisome proliferator-activated receptor regulates mitochondrial fatty acid oxidative enzyme gene expression. Proc Natl Acad Sci U S A. 1994;91:11012–11016. doi: 10.1073/pnas.91.23.11012. [DOI] [PMC free article] [PubMed] [Google Scholar]
- Hermanson O, Jepsen K, Rosenfeld MG. N-CoR controls differentiation of neural stem cells into astrocytes. Nature. 2002;419:934–939. doi: 10.1038/nature01156. [DOI] [PubMed] [Google Scholar]
- Houstis N, Rosen ED, Lander ES. Reactive oxygen species have a causal role in multiple forms of insulin resistance. Nature. 2006;440:944–948. doi: 10.1038/nature04634. [DOI] [PubMed] [Google Scholar]
- Hu X, Li S, Wu J, Xia C, Lala DS. Liver X receptors interact with corepressors to regulate gene expression. Mol Endocrinol. 2003;17:1019–1026. doi: 10.1210/me.2002-0399. [DOI] [PubMed] [Google Scholar]
- Hu X, Li Y, Lazar MA. Determinants of CoRNR-dependent repression complex assembly on nuclear hormone receptors. Mol Cell Biol. 2001;21:1747–1758. doi: 10.1128/MCB.21.5.1747-1758.2001. [DOI] [PMC free article] [PubMed] [Google Scholar]
- Iwaki M, Matsuda M, Maeda N, Funahashi T, Matsuzawa Y, Makishima M, Shimomura I. Induction of adiponectin, a fat-derived antidiabetic and antiatherogenic factor, by nuclear receptors. Diabetes. 2003;52:1655–1663. doi: 10.2337/diabetes.52.7.1655. [DOI] [PubMed] [Google Scholar]
- Jepsen K, Solum D, Zhou T, McEvilly RJ, Kim HJ, Glass CK, Hermanson O, Rosenfeld MG. SMRT-mediated repression of an H3K27 demethylase in progression from neural stem cell to neuron. Nature. 2007;450:415–419. doi: 10.1038/nature06270. [DOI] [PubMed] [Google Scholar]
- Kadowaki T, Yamauchi T. Adiponectin and adiponectin receptors. Endocr Rev. 2005;26:439–451. doi: 10.1210/er.2005-0005. [DOI] [PubMed] [Google Scholar]
- Kahn BB, Alquier T, Carling D, Hardie DG. AMP-activated protein kinase: ancient energy gauge provides clues to modern understanding of metabolism. Cell Metab. 2005;1:15–25. doi: 10.1016/j.cmet.2004.12.003. [DOI] [PubMed] [Google Scholar]
- Kang K, Reilly SM, Karabacak V, Gangl MR, Fitzgerald K, Hatano B, Lee CH. Adipocyte-derived Th2 cytokines and myeloid PPARdelta regulate macrophage polarization and insulin sensitivity. Cell Metab. 2008;7:485–495. doi: 10.1016/j.cmet.2008.04.002. [DOI] [PMC free article] [PubMed] [Google Scholar]
- Kapahi P, Boulton ME, Kirkwood TB. Positive correlation between mammalian life span and cellular resistance to stress. Free Radic Biol Med. 1999;26:495–500. doi: 10.1016/s0891-5849(98)00323-2. [DOI] [PubMed] [Google Scholar]
- Kenyon C. The plasticity of aging: insights from long-lived mutants. Cell. 2005;120:449–460. doi: 10.1016/j.cell.2005.02.002. [DOI] [PubMed] [Google Scholar]
- Lagouge M, Argmann C, Gerhart-Hines Z, Meziane H, Lerin C, Daussin F, Messadeq N, Milne J, Lambert P, Elliott P, Geny B, Laakso M, Puigserver P, Auwerx J. Resveratrol improves mitochondrial function and protects against metabolic disease by activating SIRT1 and PGC-1alpha. Cell. 2006;127:1109–1122. doi: 10.1016/j.cell.2006.11.013. [DOI] [PubMed] [Google Scholar]
- Lee CH, Olson P, Evans RM. Minireview: lipid metabolism, metabolic diseases, and peroxisome proliferator-activated receptors. Endocrinology. 2003;144:2201–2207. doi: 10.1210/en.2003-0288. [DOI] [PubMed] [Google Scholar]
- Lee SJ, Murphy CT, Kenyon C. Glucose shortens the life span of C. elegans by downregulating DAF-16/FOXO activity and aquaporin gene expression. Cell Metab. 2009;10:379–391. doi: 10.1016/j.cmet.2009.10.003. [DOI] [PMC free article] [PubMed] [Google Scholar]
- Lin J, Handschin C, Spiegelman BM. Metabolic control through the PGC-1 family of transcription coactivators. Cell Metab. 2005;1:361–370. doi: 10.1016/j.cmet.2005.05.004. [DOI] [PubMed] [Google Scholar]
- Loudig O, Babichuk C, White J, Abu-Abed S, Mueller C, Petkovich M. Cytochrome P450RAI(CYP26) promoter: a distinct composite retinoic acid response element underlies the complex regulation of retinoic acid metabolism. Mol Endocrinol. 2000;14:1483–1497. doi: 10.1210/mend.14.9.0518. [DOI] [PubMed] [Google Scholar]
- Murphy CT, McCarroll SA, Bargmann CI, Fraser A, Kamath RS, Ahringer J, Li H, Kenyon C. Genes that act downstream of DAF-16 to influence the lifespan of Caenorhabditis elegans. Nature. 2003;424:277–283. doi: 10.1038/nature01789. [DOI] [PubMed] [Google Scholar]
- Nofsinger RR, Li P, Hong SH, Jonker JW, Barish GD, Ying H, Cheng SY, Leblanc M, Xu W, Pei L, Kang YJ, Nelson M, Downes M, Yu RT, Olefsky JM, Lee CH, Evans RM. SMRT repression of nuclear receptors controls the adipogenic set point and metabolic homeostasis. Proc Natl Acad Sci U S A. 2008;105:20021–20026. doi: 10.1073/pnas.0811012105. [DOI] [PMC free article] [PubMed] [Google Scholar]
- Pallet V, Azais-Braesco V, Enderlin V, Grolier P, Noel-Suberville C, Garcin H, Higueret P. Aging decreases retinoic acid and triiodothyronine nuclear expression in rat liver: exogenous retinol and retinoic acid differentially modulate this decreased expression. Mech Ageing Dev. 1997;99:123–136. doi: 10.1016/s0047-6374(97)00098-5. [DOI] [PubMed] [Google Scholar]
- Pan D, Fujimoto M, Lopes A, Wang YX. Twist-1 is a PPARdelta-inducible, negative-feedback regulator of PGC-1alpha in brown fat metabolism. Cell. 2009;137:73–86. doi: 10.1016/j.cell.2009.01.051. [DOI] [PMC free article] [PubMed] [Google Scholar]
- Privalsky ML. The role of corepressors in transcriptional regulation by nuclear hormone receptors. Annu Rev Physiol. 2004;66:315–360. doi: 10.1146/annurev.physiol.66.032802.155556. [DOI] [PubMed] [Google Scholar]
- Reilly SM, Lee CH. PPAR delta as a therapeutic target in metabolic disease. FEBS Lett. 2008;582:26–31. doi: 10.1016/j.febslet.2007.11.040. [DOI] [PMC free article] [PubMed] [Google Scholar]
- Reznick RM, Zong H, Li J, Morino K, Moore IK, Yu HJ, Liu ZX, Dong J, Mustard KJ, Hawley SA, Befroy D, Pypaert M, Hardie DG, Young LH, Shulman GI. Aging-associated reductions in AMP-activated protein kinase activity and mitochondrial biogenesis. Cell Metab. 2007;5:151–156. doi: 10.1016/j.cmet.2007.01.008. [DOI] [PMC free article] [PubMed] [Google Scholar]
- Roberts CK, Sindhu KK. Oxidative stress and metabolic syndrome. Life Sci. 2009;84:705–712. doi: 10.1016/j.lfs.2009.02.026. [DOI] [PubMed] [Google Scholar]
- Rodgers JT, Lerin C, Haas W, Gygi SP, Spiegelman BM, Puigserver P. Nutrient control of glucose homeostasis through a complex of PGC-1alpha and SIRT1. Nature. 2005;434:113–118. doi: 10.1038/nature03354. [DOI] [PubMed] [Google Scholar]
- St-Pierre J, Drori S, Uldry M, Silvaggi JM, Rhee J, Jager S, Handschin C, Zheng K, Lin J, Yang W, Simon DK, Bachoo R, Spiegelman BM. Suppression of reactive oxygen species and neurodegeneration by the PGC-1 transcriptional coactivators. Cell. 2006;127:397–408. doi: 10.1016/j.cell.2006.09.024. [DOI] [PubMed] [Google Scholar]
- Wallace DC, Fan W. The pathophysiology of mitochondrial disease as modeled in the mouse. Genes Dev. 2009;23:1714–1736. doi: 10.1101/gad.1784909. [DOI] [PMC free article] [PubMed] [Google Scholar]
- Wang YX, Zhang CL, Yu RT, Cho HK, Nelson MC, Bayuga-Ocampo CR, Ham J, Kang H, Evans RM. Regulation of Muscle Fiber Type and Running Endurance by PPARdelta. PLoS Biol. 2004;2:E294. doi: 10.1371/journal.pbio.0020294. [DOI] [PMC free article] [PubMed] [Google Scholar]
- Zid BM, Rogers AN, Katewa SD, Vargas MA, Kolipinski MC, Lu TA, Benzer S, Kapahi P. 4E-BP extends lifespan upon dietary restriction by enhancing mitochondrial activity in Drosophila. Cell. 2009;139:149–160. doi: 10.1016/j.cell.2009.07.034. [DOI] [PMC free article] [PubMed] [Google Scholar]
- Ziouzenkova O, Orasanu G, Sharlach M, Akiyama TE, Berger JP, Viereck J, Hamilton JA, Tang G, Dolnikowski GG, Vogel S, Duester G, Plutzky J. Retinaldehyde represses adipogenesis and diet-induced obesity. Nat Med. 2007;13:695–702. doi: 10.1038/nm1587. [DOI] [PMC free article] [PubMed] [Google Scholar]
Associated Data
This section collects any data citations, data availability statements, or supplementary materials included in this article.