

Abstract
The use of quantitative proteomics methods to study protein complexes has the potential to provide in-depth information on the abundance of different protein components as well as their modification state in various cellular conditions. To interrogate protein complex quantitation using shotgun proteomic methods, we have focused on the analysis of protein complexes using label-free multidimensional protein identification technology and studied the reproducibility of biological replicates. For these studies, we focused on three highly related and essential multi-protein enzymes, RNA polymerase I, II, and III from Saccharomyces cerevisiae. We found that label-free quantitation using spectral counting is highly reproducible at the protein and peptide level when analyzing RNA polymerase I, II, and III. In addition, we show that peptide sampling does not follow a random sampling model, and we show the need for advanced computational models to predict peptide detection probabilities. In order to address these issues, we used the APEX protocol to model the expected peptide detectability based on whole cell lysate acquired using the same multidimensional protein identification technology analysis used for the protein complexes. Neither method was able to predict the peptide sampling levels that we observed using replicate multidimensional protein identification technology analyses. In addition to the analysis of the RNA polymerase complexes, our analysis provides quantitative information about several RNAP associated proteins including the RNAPII elongation factor complexes DSIF and TFIIF. Our data shows that DSIF and TFIIF are the most highly enriched RNAP accessory factors in Rpb3-TAP purifications and demonstrate our ability to measure low level associated protein abundance across biological replicates. In addition, our quantitative data supports a model in which DSIF and TFIIF interact with RNAPII in a dynamic fashion in agreement with previously published reports.
The analysis of complex mixtures by shotgun proteomics provides a snapshot of the protein components of the cell under various cellular conditions. Many proteomics studies have focused on the characterization of the protein content from highly complex mixtures such as nuclear extract from diverse organisms. Although these studies provide a wealth of information, the analysis of purified protein complexes has the potential to not only identify differential protein expression, but also to identify differentially interacting proteins and post-translational modifications that are present at undetectable levels in large-scale analyses. There have been several studies that analyze protein complexes using quantitative proteomic methods, however many of these studies have relied on binary quantitative values (presence or absence) rather than using methods that rely on discrete values (1–3). In this study, we address the reproducibility of label-free spectral count-based proteomics by analyzing biological replicate purifications of RNA polymerase I, II, and III.
The transcription of cellular RNAs is performed by large multiprotein enzyme complexes known as the RNA polymerases (RNAPs)1. Yeast and other higher eukaryotes have three RNA polymerases known as RNA polymerase I, II, and III that are mainly responsible for the transcription of ribosomal RNA (rRNA), messenger RNA (mRNA), and transfer RNA (tRNA), respectively. Each complex has a unique subunit composition with RNAPII containing 12 subunits, RNAPI containing 14 subunits, and RNAPIII containing 17 subunits; which is thought to contribute to their different target specificities. Five RNAP subunits, Rpb5, 6, 8, 10, and 12 are found in all three enzymes (for review, see (4)). Structural studies on the three enzymes have yielded a great deal of information on their function, with the most insight coming from x-ray crystal structures on both a 10- and 12-subunit RNAPII, both in the presence and absence of DNA (4–6). In addition, cryo-EM structures of the 14-subunit RNAPI complex and the 17-subunit RNAPIII complex have also been reported (7, 8). These studies provide a framework for quantitation of RNA polymerase I, II, and III because all three enzymes have been reported to exist with a 1:1 stoichiometry among all subunits, information that is not available for most multiprotein complexes (5, 7, 9, 10). An additional advantage of using these complexes is that the RNA polymerases are made up of subunits ranging from over 200 kDa to 7 kDa in molecular weight, giving us an excellent platform for comparison of the quantitation of both large and small protein components. Finally, RNAPs interact with a variety of low level associated proteins that regulate transcription and RNA processing in vivo, allowing us to test detection and quantitation capabilities for suing interacting partners.
In this study, we have performed multiple purifications of the RNA polymerases from Saccharomyces cerevisiae and analyzed the isolated proteins using multidimensional protein identification technology (MudPIT). By using label-free quantitative proteomics methods, we have compared the reproducibility of the quantitation obtained using spectral counting. We show that quantitation using either the distributed normalized spectral abundance factor (dNSAF) or raw spectral counting is highly reproducible across biological replicates. Because each enzyme targets a specific set of genes and displays different subnuclear localization pattern with RNAP II localized in the nucleoplasm, RNAP I localized to the nucleolus, and RNAP III localizing to both the nucleoplasm and nucleolus; we also wanted to assess the differences in the low-level associated proteins found in each purification. By performing Gene Ontology (GO)-term enrichment analysis, we found that each complex is associated with specific groups of proteins that play a role in such diverse processes as mRNA elongation and ribosomal RNA (rRNA) processing. We focused on the analysis of two highly enriched complexes found in association with RNA polymerase II, DRB sensitivity inducing factor complex (DSIF) and transcription factor II F (TFIIF). These data show that label-free quantitative proteomic analysis of protein complexes yields highly reproducible peptide level quantitation as well as in-depth information on low-level associated proteins that can provide a snapshot of RNA polymerase protein interaction dynamics.
EXPERIMENTAL PROCEDURES
Tandem Affinity Purification (TAP)
All yeast strains used in this study were obtained from the Open Biosystems collection produced by Ghememaghami et al. (11). Cells were grown in either yeast extract/peptone/dextrose media to an absorbance at OD600 value between 1 and 2. TAP was performed as previously described with slight modifications as follows (12). In order to purify both soluble and DNA-associated RNA polymerase complexes, yeast extracts were treated with heparin and DNase I to solubilize the chromatin-associated complexes prior to purification. At least three biological replicates were performed for each bait protein with at least three technical replicate MudPIT analyses being performed on each biological replicate. As a result, each preparation was analyzed by nine separate MudPIT runs as described below. Approximately 1–2 μg of each complex was analyzed per MudPIT run. The concentration of each replicate was determined through comparing the amount of purified RNAPII to a standard curve of a known concentration of bovine serum albumin.
MudPIT Mass Spectrometry and Database Searching
In order to analyze the purified protein complexes, TCA-precipitation, LysC/trypsin digestion, and MudPIT analyses were performed as previously described (13–15). Briefly, peptide mixtures were loaded onto a three-phase 100 μm fused silica microcapillary column packed with 1.5 cm 5-μm C18 reverse phase particles (Aqua, Phenomenex) followed by 3 cm strong cation exchange resin (Partisphere SCX, Whatman) followed by 8 centimeters of reverse phase resin tip. Loaded columns were placed in-line with a Quaternary Agilent 1100 series high performance liquid chromatography (HPLC) pump and a linear trap quadrupole (LTQ) linear ion trap MS equipped with a nano-LC electrospray ionization source (ThermoFisher). A fully automated 12-step MudPIT run was performed as previously described. Each full MS scan (from 400 to 1600 m/z range) was followed by five tandem MS (MS/MS) events using data-dependent acquisition, with the five most intense ions from each MS scan subjected to collision induced dissociation. The RAW files for the Rpa190-TAP, Rpb3-TAP, and Ret1-TAP purifications are publically available for download through Tranche at https://proteomecommons.org under the following hash: U3lhFl9VtVMH78iykX/HNViRBwZtiAaoyQqkVeo9Lr3jtw/o8Rym8UqRSsqd9vIQR5c8jr7kRPj8ztM4O0s7kxeCib8AAAAAAAARrg = = This data can be accessed using the passphrase alm1489.
RAW files were extracted to the ms2 format using RAWXtract (version 1.0). The ms2 files were subjected to database searching using SEQUEST (version 27 (rev. 9)) with no enzyme specificity considered (16). The mass tolerance for precursor ions was set at 3 amu whereas the mass tolerance for fragment ions was 0 amu. Tandem mass spectra were compared with 12,116 amino acid sequences consisting of 5880 nonredundant S. cerevisiae protein sequences obtained from the National Center for Biotechnology (2008-02-11 release). The database also included 178 common contaminant proteins including human keratins, IgGs, and proteolytic enzymes. The protein sequences for ubiquitin were preprocessed in order to reflect the mature, processed form of ubiquitin expressed in the cell because the UBI4 gene contains multiple tandem repeats of the same sequence (17, 18). The database also included randomized versions of each nonredundant protein entry to estimate false discovery rates. All SEQUEST searches were performed with a static modification of +57 daltons added to cysteine residues to account for carboxamidomethylation and dynamic searches of +16 daltons for oxidized methionine.
Spectra/peptide matches were filtered using DTASelect/CONTRAST (19). In order to focus on biological and not technical variation, the three technical replicates for each biological replicate (9 MudPIT runs in total) were merged using DTASelect prior to assembly of the entire data set using CONTRAST. In this data set, spectrum/peptide matches only passed filtering if they were at least seven amino acids in length and fully tryptic. The DeltCn was required to be at least 0.08, with minimum XCorr value of 1.8 for singly-, 2.5 for doubly-, and 3.5 for triply charged spectra, and a maximum Sp rank of 10. Proteins that were subset of others were removed using the parsimony option in DTASelect. Peptides matching to multiple protein family members were listed with each protein, but were only counted once for calculation of NSAF values. In addition, proteins identified by a single peptide were removed from the dataset. Information on the identified peptides and protein assignment is given in Supplemental Table 1 and the total number of proteins with their corresponding sequence coverage, unique peptides, and spectral counts passing criteria is given for each purification in Supplemental Table 2.
Protein Level Analysis
Quantitation was performed using label-free spectral counting. The number of spectra identified for each protein was used for calculation of normalized spectral abundance factors. NSAF7 was used to create Supplemental Tables 2 and 3, which report distributed normalized spectral abundance factor (dNSAF) values, and estimates false discovery rates as previously described (13, 20, 21). The dNSAF values were calculated for each protein to account for differences in protein length and to prevent redundant spectral assignment allowing for the comparison of the relative spectral abundance of proteins across various preparations (13, 21, 22). Across the TAP preparations, the average spectral FDR was 0.20% (Supplemental Table 3). For comparison of NSAF and absolute protein expression (APEX) values, complex normalized spectral abundance factor (cNSAF) calculations were performed as shown below.
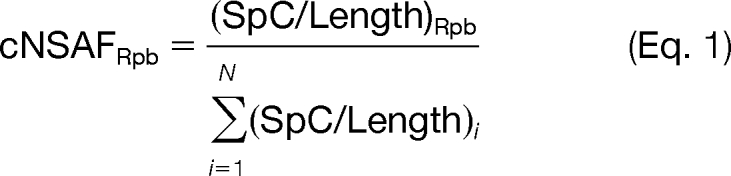 |
Briefly, the spectral counts (SpC) for each RNA polymerase II subunit (Rpb) were divided by their total length. These values were normalized (i = 1) by the sum of the SpC/Length for all 12 RNAPII subunits (N). The calculation of cNSAF was required for the comparison because APEX values were only determined for the RNAPII subunits.
Contaminant Extraction
The nonspecific binding proteins were extracted from the data set by comparing the dNSAF value in each of the individual purifications with the dNSAF value from the mock control (i.e. TAP), which was performed in the parental yeast strain BY4741. If the dNSAF value in the purification was at least twofold higher than the dNSAF in the mock control, the protein was considered specific to that particular purification. The dNSAF values for the mock control are available in Supplemental Table 2. Nonspecific protein values were replaced with 0 for subsequent analysis. The proteins that were shown to be nonspecific to all 12 purifications were extracted from the data set. Although this method removed the majority of the contaminant proteins, we also controlled for proteins that are consistently detected in TAP purifications. For this extraction we also removed proteins from the data set that were considered as contaminants in the large scale TAP purification studies performed by Krogan et al. where they defined proteins as contaminants when they appeared in greater than 3% of all TAP purifications performed (1). We chose this contaminant list because the strains used in the study were from the same strain library that we used (11). The final data set used for analysis following contaminant extraction is given in Supplemental Table 4. A summary of the total number of proteins, unique peptides, and spectra identified is given in Supplemental Table 5.
ANOVA F-Test
In order to ensure the reliability of our conclusions drawn for the observed data set, we measured the similarity between the three biological replicates of each bait by using a one-way ANOVA F-test using the R function lm(). Based on this method, we tested the hypothesis that each sample comes from a population with the same mean (H0: μ1 = μ2 = μ3) versus the alternative hypothesis that the mean differs for at least two of the replicates (H1: At least one inequality: μ1 ≠μ2 or μ1 ≠μ3 or μ2 ≠μ3). For each bait, represented by three replicates, the result obtained from one-way ANOVA test was a p value > 0.05; therefore, the H1 hypothesis was rejected and we concluded that there were no significant differences between any of the population's means for each of the baits. The ANOVA results were followed up with Tukey's test in order to test the mean of each replicate pair-wise with the other replicates. Based on these results, all the biological replicates were considered for further analysis.
Hierarchical Clustering
In order to focus on the most highly enriched proteins for clustering analysis, we performed singular value decomposition (SVD) and plotted the first left singular vector as previously described (20) (Supplemental Table 6 and Supplemental Fig. 1). The data set identified 31 proteins as the most highly enriched which includes all 31 subunit of the RNA polymerases. All baits and preys were clustered under the same criteria, using Pearson correlation as a distance matrix and Ward method as an algorithm. The clustering result shows a clear separation of the replicates (only for the baits) and the proteins corresponding to the three complexes (both baits and preys; see Fig. 2). Similarly, we also applied clustering analysis on the same matrix following transformation into binary values (i.e. 1 for presence/0 for absence) and used Euclidian metric as a distance and Linkage Average as an algorithm.
Fig. 2.

Binary and Quantitative Clustering. A, Cluster analysis of the binary values (0 = absent (black), 1 = present (yellow) for RNA polymerase subunit detection by MudPIT analysis. B, Cluster analysis of the dNSAF values from each RNA polymerase preparation to determine the relatedness of the different purifications. The yellow color intensity is indicative of the dNSAF value according to the scale shown to the right of B. For both figures, the dendrogram at the top of the cluster represents the relationship between the baits whereas the dendrogram to the left represents the relationship between the purified proteins (preys).
Peptide Level Analysis
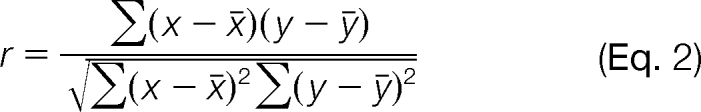
To assess the reproducibility of RNA polymerase complex detection at the peptide level, we considered the total number of spectra identified in each replicate for each unique peptide sequence (including all charge and modification states). Pearson correlation coefficients were calculated as shown below and the r value for each pair-wise comparison is reported.
 |
ProteinProphet and APEX Analysis
Because some peptides are detected more readily by mass spectrometry than others, we incorporated probabilities for peptide detection using the APEX protocol (www.marcottelab.org/APEX Protocol/) as previously described (23–25). For this analysis, SEQUEST output files were converted to the pep.XML format using Sqt2XML, a converter released in version 3.2.2 of the Trans Proteomics Pipeline (26). The resulting pep.XML files were analyzed using PeptideProphet with the false-discovery rate set at 2% based on the detection of shuffled decoy protein sequences in the data set. ProteinProphet was then employed to assemble peptides into protein identification groups. All RNAP subunits had a protein probability of 1 (27).
Two data sets were used as training data for machine learning using Weka 3.6.1 (28). The first was whole-cell lysate prepared using the same method as described for TAP lysate preparation. The second data set used for comparison was a merged data set containing peptide identifications for all three Rpb8-TAP purifications. For this analysis, protein identifications were only used for analysis if they were supported by at least 200 spectral counts as suggested in the APEX protocol (23). For the TAP lysate data, 50 proteins passed these criteria and were used for in silico digestion using proteogest (29). We used all 31 RNAP subunits for modeling when using the Rpb8-TAP merged data set. Using proteogest, we allowed for one missed tryptic cleavage and required a minimum peptide length of 7 amino acids. The model obtained by analysis with Weka required to have an F-measure > 0.6 as suggested by the APEX protocol.
The TAP lysate or Rpb8-TAP models were used for the calculation of peptide detection probabilities. Oi values were determined by addition of all peptide probabilities for the peptides for each of the RNAPII subunits. The Oi values were used for the calculation of APEX for a given protein (i). APEX values were calculated as shown below with the total number of spectral counts (n) and protein probabilities (p) obtained from the ProteinProphet output.
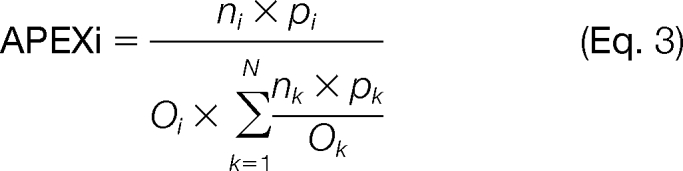 |
The initial values were normalized (k = 1) using the sum of all values for all the RNAP subunits (N). The normalization allowed for direct comparison of cNSAF and APEX values.
Calculation of GO Term Enrichment
GO term enrichment was performed using GOstat (30). In brief, p values were calculated by looking for enrichment of protein detected in each individual purification in certain GO categories. The enrichment of proteins detected by at least two unique peptides in the indicated purification was determined by comparison with all proteins in the yeast FASTA database used for database searching via GOstat.
RESULTS
Protein Level Analysis of Label-Free Quantitation Using dNSAF Values
In order to test the reproducibility of label-free quantitation of the RNA polymerases from S. cerevisiae, we have performed TAP purifications using baits that are either shared among all three enzymes (Rpb8-TAP) or that are unique to one of the three enzymes (Rpb3-TAP, Rpa190-TAP, Ret1-TAP; illustrated in Figs. 1A and 1B). Three biological replicates were performed for each bait protein and dNSAF values were calculated prior to contaminant extraction (Supplemental Table 2). The similarity between the biological replicates of each bait was determined using an ANOVA F-test, in which a p value greater than 0.05 indicates that there is no significant difference between the replicates. We performed ANOVA analysis on the data set both before and following contaminant extraction. For each of the preparations, the p value was higher than 0.05 indicating that the dNSAF values for the biological replicates were indeed reproducible both before and following contaminant proteins were removed (Fig. 1C). In fact, it appears that the pairwise reproducibility actually decreased slightly for some purifications following contaminant extraction. This is likely because of the fact that the contaminant proteins were found reproducibly across all TAP purifications and in mock purifications (Supplemental Table 2). Each purification was highly enriched in RNA polymerase subunits with an average of 92.9% of the observed spectra assigned to RNA polymerase subunits (Supplemental Table 5).
Fig. 1.

RNA Polymerase I, II, and III Proteins and Reproducibility. A, Silver stained gels for each of the specific RNAP purifications. The common subunits are indicated by arrows to the right of the panel. B, Venn diagram illustrating the shared nature of different RNAP subunits. Subunits common to all three complexes are indicated in orange text; those common to RNAPI and RNAPIII are shown in green; RNAPII specific subunits are shown in blue; RNAPI specific subunits are shown in black; and RNAPIII specific subunits are shown in red. C, Results from the ANOVA F-test and Tukey's test. ANOVA was performed to test the reproducibility of the dNSAF values between the three biological replicate for each preparation as indicated. The Tukey's test analyzed pair-wise comparisons of reproducibility as indicated.
In order to focus on the reproducibility of the protein-level quantitation, we performed hierarchical cluster analysis based on the purifications performed in YPD for the 12 baits on all known core subunits of the RNAP enzymes (i.e. preys). For this analysis, we chose to focus on the most abundant proteins in the data set. Using singular value decomposition as previously described (20), we found that the 31 RNA polymerase subunits were the most highly enriched proteins identified across the 12 purifications (supplemental Fig. 1 and Supplemental Table 6). We first clustered the data using binary measurements (0 = absent, 1 = present) and looked at the relationships between both the baits (top, Fig. 2A) and the individual RNA polymerase subunits (left, Fig. 2A). A protein was considered to be present if it was identified by at least two unique peptide identifications in the data set. The resulting dendrogram illustrates the relatedness of either each purification (Fig. 2A, top) or each purified protein (prey, Fig. 2B, left). We found that the binary measurements were sufficient to group biological replicates of the same purification with each other showing that statistically each bait purifies a distinct set of interacting proteins (top, Fig. 2A). However, the binary measurements were not sufficient to group the specific subunits of the RNA polymerase complexes with proteins from the same complex (left, Fig. 2A). When looking at the dendrogram to the left of the figure, the binary measurements grouped both Rpa135 and Rpb1 with the subunits that are common to all RNA polymerase complexes instead of with their specific interacting partners in RNAPI and RNAPII respectively (Fig. 2A, Rpb1 indicated with a blue star; Rpa135 indicated with a black asterisk). The RNA polymerase II specific protein Rpb1 is grouped with Rpb5, Rpb6, Rpb8, Rpb10, and Rpb12; which are subunits found in all three enzymes. Rpa135, a RNA polymerase I specific subunit, is grouped with Rpc19 and Rpc40; which are shared between RNA polymerases I and III. This data shows that binary values are not sufficient to identify the known relationships between RNA polymerase subunits.
We next performed hierarchical clustering using discrete values (dNSAF) that consider the total number of spectral counts identified for each protein. Clustering using dNSAF values also resulting in the correct clustering of biological replicates, as seen for the binary values (Fig. 2B, top). In addition, the dNSAF cluster analysis exhibits a separation in the dendrogram between the specific subunits of RNAP I, II, and III complexes. The common subunits found in all three RNAPs also split off from the rest of the RNAP components (shown in orange). Interestingly, we can see that the presence of Rpb1 (the largest subunit of RNA polymerase II) in the Rpa190- and Ret1-TAP purification occurs at very low levels; a difference that could not be determined using binary measurements as in Fig. 2A. It is important to note that the presence of low levels of Rpb1 and Rpa135 in the other complex specific baits is not because of the detection of peptides that are redundant with peptides from other RNAP subunits because calculation of a dNSAF value in any given purification requires at least one unique peptide be present for any given protein (13, 21). In conclusion, we found that although the biological replicates showed strong relatedness when using binary values, some preys were misplaced (specifically Rpb1 and Rpa135, Fig. 2). This indicates that quantitative data is more informative for cluster analysis than the traditionally used qualitative data, which only relies on the topological properties of the purifications.
Analysis of the dNSAF values also reveals some variation in the presence of some subunits in the Rpb8-TAP purification. This is seen for the RNAPI subunits Rpa49 and Rpa34 as well as for the RNAPIII subunit Rpc25. We believe that the inability to identify these subunits in all three Rpb8-TAP purifications is a result of the three enzyme complexes being present at different total concentrations in the cell. As a result, when all three enzymes are purified through Rpb8-TAP we observe the common subunits found in all three enzymes had the highest dNSAF levels (with ∼45% of the total spectra obtained coming from Rpb5, 6, 8, 10, and 12). The specific subunits of RNAPII were found at the next highest levels followed by the subunits of RNAPI and then RNAPIII. We hypothesize that some subunits of RNAPI and RNAPIII were not detected because those enzymes were present at much lower levels than the common subunits and RNAPII in the Rpb8-TAP purifications. However, this small variability did not affect the precision of the clustering.
Analysis of the Relative Levels of RNA polymerase Subunits by dNSAF
We compared the relative spectral abundance of each protein in the specific enzyme purifications by graphing the average dNSAF values for each subunit from RNA polymerase I, II, or III (Fig. 3). In each of the three different preparations all known core components of the three enzymes were detected and the dNSAF values were reasonably reproducible, consistent with the results we obtained with ANOVA analysis (Fig. 1C). Interestingly, we found that none of the RNA polymerase purifications displayed a strict 1:1 abundance between all detected subunits as we would have expected from previous structural studies in which TAP purified RNA polymerase complexes were analyzed (31). In the RNAPII specific preparation, for instance; Rpb3, Rpb4, Rpb5, Rpb7, and Rpb10 were found at a higher level than that of the largest subunits Rpb2 and Rpb1 (Fig. 3A). Consistent with previous structural studies the stoichiometry of intact RNAPII and RNAPIII was recently validated at 1:1 using quadrupole time-of-flight (Q-TOF) mass spectrometry (10). These results indicate that although label-free spectral is able to give the relative abundance of each RNA polymerase subunit within a twofold range of the average dNSAF value (Fig. 3), it is not able to completely resolve protein abundance to the level of stoichiometry. In order to understand the basis for this phenomenon, we performed further analysis on the unique peptides detected in our studies and the total number of observed spectral counts in biological replicates.
Fig. 3.

dNSAF Analysis of RNA polymerase I, II, and III. Relative abundance determined using label-free spectral counting for the 12-core subunits of RNAPII obtained from the Rpb3-TAP preparation (A), the 14-core subunits of RNAPI obtained from the Rpa190-TAP preparation (B), and the 17-core subunits of RNAPIII obtained from the Ret1-TAP preparation (C). Data are expressed as average dNSAF values ± standard deviations. The average dNSAF value for the RNAP subunits for each purification is indicated as a dashed line on the graph.
Analysis of the Peptide Sampling Across the RNA polymerase Data Set
For each of the specific RNA polymerase purifications (Rpa190-TAP, Rpb3-TAP, and Ret1-TAP; also referred to as the RNA polymerase data set), we analyzed the total number of raw spectral counts for each unique peptide. For these studies, we combined the spectral count values for all charge and modification states. Considering that the dNSAF values were highly reproducible within biological replicates, we first investigated if the spectral counts for each unique peptide in the data set also showed a high level of reproducibility. We calculated Pearson correlation coefficients for three sets of spectral count values. In Fig. 4A, we analyzed the reproducibility of spectral counting for all peptides identified in the data set. We found that the biological replicates of each TAP purification showed the highest level of reproducibility. Interestingly, we also observed some reproducibility between bait proteins. It is possible that the reproducibility seen between samples is because of the presence of contaminant proteins or because of the presence of the common RNAP subunits found in all three complexes: Rpb5, 6, 8, 10, and 12. In order to address this question, we performed further analysis to identify the factors that influenced this reproducibility. In Fig. 4B, we focused the analysis on the peptides identified for the 31 subunits of the RNA polymerases, which were the most highly enriched proteins in the data set (Supplemental Table 7). We again found the highest level of reproducibility between biological replicates of the same TAP tagged protein with lower values now found between different purifications. This data indicates that the inclusion of the spectral counts from the contaminants can lead to higher Pearson correlation likely because of the fact that contaminant proteins are identified reproducibly because of the purification procedure without respect to which protein is TAP tagged.
Fig. 4.

Label-free quantitation at the protein level is highly reproducible. Pearson correlation coefficients (r values) were calculated to determine the reproducibility of spectral counting for each unique peptide across biological replicates. A, Analysis of the reproducibility of the raw spectral counting for all peptides identified in the RNA polymerase data set. B, Analysis of the reproducibility of all unique peptides from all 31 RNA polymerase subunits. The cyan intensity represents the r value obtained from Pearson as indicated on the scale to the right of the figure. C, Analysis of the reproducibility of all unique peptides from the 5 RNA polymerase subunits found in all three complexes (Rpb5, Rpb6, Rpb8, Rpb10, and Rpb12). The r value scale for these calculations is given to the right of the figure.
We did observe, however, some correlation between purifications even in the absence of the contaminant peptides. We hypothesized that the peptides for five common subunits may be responsible for the low levels of correlation between specific RNA polymerase preparations. In order to investigate this observation, we calculated the Pearson correlation coefficient for the spectral counts arising from the unique peptides identified for the shared components of all three enzyme complexes, Rpb5, 6, 8, 10, and 12 (Fig. 1B). We found that the r values between all purifications increased, indicating that the peptides detected for each of the common subunits occurred at similar levels across all nine purifications (Fig. 4C). This is an interesting observation because it might be expected that each unique peptide may not be sampled in the specific RNA polymerase purifications because of diversity in the peptide populations, which would lead to differences in co-elution. In contrast, our data shows that the same peptides were reproducibly identified for the common RNA polymerase subunits independent of the bait protein (Fig. 4C).
Spectral Counting Does not Follow a Random Sampling Model when Analyzing Protein Complexes
When using shotgun proteomics methods for quantitation, one can assume that all peptides identified for a given protein behave in a similar fashion. When analyzing highly complex sample mixtures such as whole cell extract this model referred to as a random sampling model, has been shown to be incorrect (27, 32, 33). In contrast it has been proposed that peptide sampling occurs in a semirandom fashion where peptides from the most abundant proteins are sampled at a higher rate than peptides from less abundant proteins (32). These studies have not shown, however, that sampling of all unique peptides from the same protein occurs at the same frequency whether at high or low levels, which the data in Fig. 4 would suggest. Considering that our RNA polymerase purifications show a high level of reproducibility in raw spectral counting between biological replicates, this data set is optimal to determine how differences in peptide sampling affect the calculation of protein abundance.
Because RNA polymerase II (RNAPII) has been the subject of extensive structural studies, we focused on determining the difference in peptide sampling between subunits for this complex in detail. Differences in peptide sampling could explain the differences that we have observed in relative subunit abundance measured by dNSAF as compared with the 1:1 subunit stoichiometry that has been previously reported (Fig. 3A) (5, 7, 9, 10). We calculated the average number of spectral counts detected per unique peptide for each of the twelve subunits of RNAPII for biological replicate number 1 (Fig. 5). Interestingly, we found that the average number of spectral counts observed per peptide was ∼twofold higher for Rpb3, Rpb4, Rpb5 and Rpb10, the same proteins we found at higher levels by dNSAF (Fig. 5, graph). The converse was true for proteins which showed a lower than average dNSAF value, Rpb8 and Rpb11 were detected by a lower number of spectral counts per unique peptide.
Fig. 5.

Analysis of the average number of spectral counts observed per unique peptide identification. Data are expressed as the average spectral counts/peptide for each subunit of RNA polymerase II as indicated. These data are representative of the three biological replicates although only data from biological replicate 1 of Rpb3-TAP are shown. At the top of the graph, the maximum number of spectral counts observed for a unique peptide (Maximum), the total number of proteotypic peptides (Proteotyptic), and the total number of amino acids (Total Length) for each subunit is indicated.
Considering that it is possible that this increase in the average sampling amounts could also be explained because of differences in RNAPII stoichiometry, we also looked at the maximum number of spectral counts obtained for a unique peptide from each subunit. We found that although peptides from Rpb3, Rpb4, and Rpb10 were sampled at a higher average rate, the maximum sampling for peptides from these proteins was similar to that of Rpb1 and Rpb2 (Fig. 5, top). We have found that the higher sampling level of Rpb3, Rpb4, Rpb5, and Rpb10 results from a higher relative number of proteotypic peptides when compared with subunits with a similar size (Fig. 5, top). For our studies, we classified a proteotypic peptide as a peptide having an average of 100 spectra acquired across the biological replicates (Supplemental Table 8).
This phenomenon is best illustrated by comparing the RNAPII subunits Rpb10 and Rpb12. Both proteins are 70 amino acids in length so tryptic cleavage of these proteins should result in a similar number of peptides. However, Rpb10 is detected with a much higher average number of spectral counts per protein than Rpb12 (Fig. 5). This is because of the observation that Rpb10 has three peptides that would be considered proteotypic whereas Rpb12 only has one. This data also illustrates the diversity of the subunits of RNAPII. Although the larger subunits have many potential peptides for use in single reaction monitoring experiments, small proteins may have very few proteotypic peptides for use in these types of experiments; limiting the ability to quantitate them by targeted approaches such as SRM.
Application of APEX for Relative RNAP Subunit Quantitation
Because each unique peptide has different physiochemical properties, several computational tools have been developed to look at the probability of a peptide being detected in a certain type of proteomics experiment (24, 25, 33, 34). One of these computational tools, termed absolute protein expression (APEX) incorporates spectral counts and peptide detectability to calculate the absolute and relative abundance of proteins in proteomics data sets, which made it optimal for comparison with NSAF values (24, 25). In order to use APEX for quantitation, we first analyzed our SEQUEST output files using PeptideProphet and ProteinProphet through the Trans-Proteomic Pipeline, an open source software platform used for the analysis of proteomics data (27, 35, 36). For this analysis, we allow a false discovery rate of 2% for the data filtering and observed a 20% increase in the total number of spectral counts that passed criteria for the RNAPII subunits (Supplemental Table 5) compared with the spectral counts we obtained when using a threshold-based filter such as DTASelect. Considering this increase in total spectral counts, we calculated complex normalized spectral abundance factor (cNSAF) values for all 12 of the RNAPII subunits either using the spectral counts obtained from DTASelect cut off scores (threshold-based filtering) or the ones obtained from ProteinProphet (probability-based filtering). We found that the increase in the total number of spectral counts per protein did not affect the relative subunit cNSAF values (Fig. 6A).
Fig. 6.

Comparison of NSAF, APEX, and Protein Prophet. A,Comparison of cNSAF values using the spectral count values obtained from either threshold-based filtering obtained from Contrast (n = 3) or probability-based filtering obtained from Protein Prophet (n = 1) using the criteria described in the methods section. B, Comparison of cNSAF values (n = 3) to the APEX values (n = 1) obtained following analysis of Rpb3-TAP replicate 1 using the APEX protocol. Data from MudPIT analysis of a TAP lysate was used for model creation as described. Use of the APEX protocol is not able to adjust the higher average sampling observed for Rpb3, Rpb4, Rpb5, or Rpb10. (C) Comparison of cNSAF values (n = 3) to the APEX values (n = 1) obtained when using the merged Rpb8-TAP data set for model creation.
In order to calculate APEX values, we first had to model peptide detectability based on 66 different physiochemical attributes as previously described (23–25). For the modeling steps, we used data obtained from MudPIT analysis of whole cell yeast extract that had been prepared using the protocol that we use for TAP purification (hence called TAP lysate). This model was then used to obtain Oi values, which predict protein detectability using our MudPIT platform, in order to calculate the relative abundance of the RNAPII subunits in the first biological replicate. Using these methods, the APEX values were also nearly identical to the cNSAF values obtained for the RNAPII subunits (Fig. 6B). These data indicate that that this computational model is unable to resolve the differences in relative abundance that we observe for the RNAPII subunits.
Because calculation of APEX relies heavily on the model derived from the training data set, we hypothesized that differences between the peptides observed during the analysis of lysate may not resemble peptides identified during analysis of a purified complex. For this reason, we decided to use merged data from the Rpb8-TAP purifications for training and calculation of peptide probabilities. The Rpb8-TAP data set is ideal for this comparison because it is a highly pure protein complex mixture that contains many of the same peptides found in the RNAPII purification, but has a different stoichiometry than the Rpb3-TAP purification because it contains all three RNAP complexes. The amount of spectra per unique peptide obtained from the Rpb8-TAP purification and the other RNAP purifications shows a positive Pearson correlation (Fig. 4B), indicating that many of the peptides identified in Rpb8-TAP are also observed in the other purifications at similar levels. Using Rpb8-TAP as the training data, we calculated Oi values as described. As shown in Fig. 6B, the use of Rpb8-TAP as the model data was still not sufficient to correct the peptide sampling such that all RNAPII subunits were detected in 1:1 amounts.
Quantitation of Low Level Associated Proteins Involved in RNA polymerase II Elongation
In addition to the core components of the RNAP complexes, we found several known accessory proteins that are involved in various aspects of transcription. This finding was especially true for RNAPII, the smallest of the three complexes, for which we found several known elongation factors associated at low levels with the core complex (Supplemental Table 4). In order to gain further biological insights from this data set, we looked for reproducible enrichment of accessory proteins in each of the RNA polymerase purifications using GOstat (30). As shown in Fig. 7A, we focused on three gene ontology (GO) categories that showed a significant enrichment in each of the three Rpb3-TAP purifications; indicating that these were reproducible interaction partners. The first GO category was “RNA polymerase II transcription elongation factor activity” (GO:0016944) which gave p values ≥ 0.001 (Fig. 7A). The second GO category focused on a specific RNA polymerase II elongation factor complex termed DSIF (GO:0032044) which consists of two proteins that function as a heterodimer: Spt4 and Spt5. DSIF is a transcription elongation factor complex that has been shown to stimulate RNA polymerase II transcription in yeast (37). Interestingly, Spt5 is the only known RNA polymerase elongation factor conserved in bacteria (38). The final category selected from the GO analysis was for a general transcription, TFIIF (GO:0005674), which has been shown to promote both initiation and elongation by RNA polymerase II (39). Considering that the DSIF and TFIIF complexes appeared to be the most enriched accessory proteins in the data set by data set (Supplemental Table 6), we chose to focus on these protein complexes for further analysis.
Fig. 7.

The elongation factor complexes DSIF and TFIIF associate with RNAPII in a dynamic manner. A, Analysis of GO term enrichment using GOstat. The graph shows the p value for each GO category indicated at the top of the figure from GOstat analysis of the proteins identified in the three biological replicates of Rpb3-TAP. B, dNSAF values from Rpb3- and Rpb11-TAP purifications. The average and standard deviations were calculated from the analysis of at least three technical replicate MudPIT runs from each biological sample. C, dNSAF values obtained from Rpb3-TAP comparing the Tfg1 and Tfg2 subunits of TFIIF to their homologs in RNA polymerase I, Rpa49 and Rpa34 (identified in the Rpa190-TAP purifications).
As the GO term enrichment data would suggest, DSIF and TFIIF were reproducibly identified in the Rpb3-TAP purifications and were the most highly enriched proteins in that data set following the RNAPII subunits themselves (Supplemental Table 6). DSIF is an elongation factor complex that has been previous shown to interact with RNAPII in a dynamic fashion (40–43). Recent data has shown that DSIF is not present in the initiation complex, indicating that it is recruited in a dynamic fashion specifically during transcription elongation (44). Alternatively, TFIIF has been shown to be involved in both transcription initiation and elongation (45, 46); although studies in yeast have determined that the occupancy of TFIIF is limited to the promoter also demonstrating a dynamic interaction with RNAPII (44).
In order to confirm that the associated protein interactions were reproducible, we extended our analysis to include three additional RNAPII purifications using Rpb11-TAP as the bait protein. We found that DSIF, TFIIF, and Iwr1 were reproducibly detected in biological replicate analyses of RNAPII purified complexes (Fig. 7B). By looking at the dNSAF values for Spt4 and Spt5, we observed significant variation in the dNSAF values across the three biological replicates that is higher than the variation observed between technical replicates (Fig. 7B, Supplemental Fig. 2). In fact when looking at the correlation of variance (CV) comparing biological replicates and technical replicates, the biological variation is always higher than the technical replicates for the subunits of DSIF and TFIIF (Supplemental Fig. 2). It is intriguing to speculate that the variation in the dNSAF values could reflect the dynamic association of DSIF and TFIIF with RNAPII because these complexes are recruited during specific and distinct stages of the transcription cycle where the main RNAPII complex components persist throughout the transcription cycle (44).
Intriguingly, we observed a different phenomenon when looking at the detection of the RNAPII interacting protein Iwr1. Iwr1 is a fairly uncharacterized protein that was found to interact with RNA polymerase in a large-scale proteomics screen (1). Recent studies have implicated Iwr1 in the formation of the pre-initiation complex (47) and in RNA-directed DNA methylation in plants (48). Our studies found that Iwr1 interacts with RNAPII in a highly reproducible manner, even though it was detected by an ∼79-fold lower number of total spectral counts in the Rpb3- and Rpb11-TAP purifications as compared with RNAPII subunits like Rpb1 (Fig. 7B and Supplemental Table 9). The average dNSAF value of Iwr1 is 20.9 times lower than the average RNA polymerase II subunit dNSAF. For Iwr1, the average number of spectral counts detected across all the technical replicates is 59.6 whereas the average number of spectral counts for the RNAPII subunit Rpb1 across all the technical replicates is 4530.8 (Supplemental Table 9). Therefore, the average number of spectral counts for Iwr1 represents only 1.3% the spectral counts detected for Rpb1. These data indicate that Iwr1 is detected at a significantly lower level than the RNAPII subunits. However, the coefficient of variation for Iwr1 is similar to Rpb1 (Supplemental Fig. 2) indicating that the values for Iwr1 represent our lowest level of reproducible detection in these studies. The consistency of the Iwr1-RNAPII interaction shows the utility of dNSAF calculation for detecting proteins associated in a stable manner, yet at low levels.
As mentioned, the difference in associated protein abundance across biological replicates is also observed for the three subunits of TFIIF: Tfg1, Tfg2, and Taf14. All three proteins show dynamics in their dNSAF values measure across biological replicates with their highest levels observed in replicate 2 and lowest levels in replicate 3 (Fig. 7B). Structural data on RNA polymerase I could provide justification for a relatively high level of TFIIF in RNAPII purifications compared with other initiation factors. Cryo-EM studies on the 14-subunit RNAPI complex revealed that the complex contains a “built-in” TFIIF-like complex that regulated transcription elongation (7). The RNAPI subunits Rpa49 and Rpa34 show weak sequence homology yet reasonable structural homology to the TFIIF components Tfg1 and Tfg2 (also known as Rap74/Rap30) (7). In order to compare the relative enrichment of TFIIF to that of Rpa49/34, we have graphed their average dNSAF values compared with the largest subunits of RNAPII and RNAPI respectively (Fig. 7C). As expected from the Cryo-EM studies (7), Rpa49 and 34 show up at similar levels to that of Rpa190; the largest subunit of RNAPI. Interestingly, the subunits of TFIIF are present at more than 10-fold lower levels than those seen with their structural homologs in RNAPI or to one of the core subunits of RNAPII (Rpb1) (Fig. 7C).
DISCUSSION
We have shown that quantitation using label-free spectral counting is a highly reproducible approach at both the protein and peptide level. However, because unique peptides are differentially detected by the mass spectrometer, some proteins will have a higher number of proteotypic peptides than other proteins. We have shown that this is true for the subunits of RNAPII with some subunits displaying a higher number of spectral counts per unique protein on average. This issue currently prevents the calculation of stoichiometry between protein complex subunits in the same sample without additional supporting data, such as the use of spiked-in peptides (or proteins) at known concentrations (49). The use of other quantitative methods such as peak area quantitation were also not able to adjust for these sampling differences because small proteins with few detectable peptides are still under-represented (data not shown). Although the ability to compare proteins within a biological sample is still a work in progress, the high level of spectral sampling reproducibility between biological replicates supports across sample quantitation by comparing the same peptide in separate analyses when complexes are analyzed under different cellular conditions.
If one can determine the probability of a given peptide to be identified using a certain proteomics platform, then differences in spectral sampling levels can be corrected for when calculating protein abundance levels. We attempted to correct for the differences in the level of spectral sampling by using the APEX protocol as previously reported (23–25). In addition, we used two different types of training data sets: one obtained from the analysis of whole-cell lysate and one obtained from replicate analyses of a highly purified and related set of protein complexes. Use of APEX, however, was also not able to overcome the differences in spectral sampling observed for the different RNA polymerase subunits. This could be explained by the fact that the peptide detectability models are obtained using binary values (n = not detected and Y = detected) for peptide detection in the training data set. The use of discrete values (such as number of spectral counts) may dramatically alter the model based on the training data, because we reproducibly saw some peptides detected once and others that were detected nearly 1000 times during replicate analyses. This 1000-fold difference in peptide detectability for peptides within the same protein shows the importance of using discrete values for future computational tools used for calculating peptide detectability. For this reason, we believe that the best approach for future label-free studies is the development of advanced computational tools that are able to take into consideration the number of spectral counts per peptide during both the modeling portion of the computation and calculation of protein abundance levels. Toward this end, the raw data from our analysis is publically available through Tranche (https://proteomecommons.org) as described in the methods section.
In addition, we have shown that the use of biological replicate analysis using quantitative label-free proteomics can provide insight into the association of low level interacting proteins such as the members of the protein complexes DSIF and TFIIF. Components of DSIF and TFIIF have been shown to dynamically associate with RNAPII during the transcriptional cycle as shown most recently by genome wide occupancy profiling (44). We have shown that the proteins within these complexes display significantly higher variation in their dNSAF values across biological replicates when compared with technical replicates. The lower variation within technical replicates supports the hypothesis that proteins that interact with a purified complex in a dynamic fashion will result in higher variation in the quantitation across different biological replicates. This argument is strengthened by the observation that Iwr1 was detected with a high-level of reproducibility across all replicates despite it being present at lower levels than DSIF and TFIIF (Fig. 7B). Through future development of quantitative methods to compare the relative abundance of proteins within a sample, we will be able to improve quantitation of low level associated proteins and core complex subunits alike.
Acknowledgments
We would like to thank the members of the Washburn and Workman labs for useful discussion and critical reading of this manuscript.
Footnotes
* This work was supported by a postdoctoral fellowship from the NIGMS to A.L.M. (F32GM075541) and funding from the Stowers Institute.
 This article contains supplemental Figs.1–2 and Tables 1–8.
1 The abbreviations used are:
- RNAP
- RNA polymerase
- MuPIT
- multidimensional protein identification technology
- rRNA
- ribosomal RNA
- mRNA
- mitochondrial RNA
- tRNA
- transfer RNA
- dSNAF
- distributed normalized spectral abundance factor
- dSIF
- DRB sensitivity inducing factor
- TFIIF
- transcription factor II F
- LTQ
- linear trap quadrupole
- APEX
- absolute protein expression
- GO
- Gene Ontology.
REFERENCES
- 1. Krogan N. J., Cagney G., Yu H., Zhong G., Guo X., Ignatchenko A., Li J., Pu S., Datta N., Tikuisis A. P., Punna T., Peregrin-Alvarez J. M., Shales M., Zhang X., Davey M., Robinson M. D., Paccanaro A., Bray J. E., Sheung A., Beattie B., Richards D. P., Canadien V., Lalev A., Mena F., Wong P., Starostine A., Canete M. M., Vlasblom J., Wu S., Orsi C., Collins S. R., Chandran S., Haw R., Rilstone J. J., Gandi K., Thompson N. J., Musso G., St Onge P., Ghanny S., Lam M. H., Butland G., Altaf-Ul A. M., Kanaya S., Shilatifard A., O'Shea E., Weissman J. S., Ingles C. J., Hughes T. R., Parkinson J., Gerstein M., Wodak S. J., Emili A., Greenblatt J. F. (2006) Global landscape of protein complexes in the yeast Saccharomyces cerevisiae. Nature 440, 637–643 [DOI] [PubMed] [Google Scholar]
- 2. Gavin A. C., Bösche M., Krause R., Grandi P., Marzioch M., Bauer A., Schultz J., Rick J. M., Michon A. M., Cruciat C. M., Remor M., Höfert C., Schelder M., Brajenovic M., Ruffner H., Merino A., Klein K., Hudak M., Dickson D., Rudi T., Gnau V., Bauch A., Bastuck S., Huhse B., Leutwein C., Heurtier M. A., Copley R. R., Edelmann A., Querfurth E., Rybin V., Drewes G., Raida M., Bouwmeester T., Bork P., Seraphin B., Kuster B., Neubauer G., Superti-Furga G. (2002) Functional organization of the yeast proteome by systematic analysis of protein complexes. Nature 415, 141–147 [DOI] [PubMed] [Google Scholar]
- 3. Collins S. R., Kemmeren P., Zhao X. C., Greenblatt J. F., Spencer F., Holstege F. C., Weissman J. S., Krogan N. J. (2007) Toward a comprehensive atlas of the physical interactome of Saccharomyces cerevisiae. Mol. Cell Proteomics 6, 439–450 [DOI] [PubMed] [Google Scholar]
- 4. Cramer P., Armache K. J., Baumli S., Benkert S., Brueckner F., Buchen C., Damsma G. E., Dengl S., Geiger S. R., Jasiak A. J., Jawhari A., Jennebach S., Kamenski T., Kettenberger H., Kuhn C. D., Lehmann E., Leike K., Sydow J. F., Vannini A. (2008) Structure of eukaryotic RNA polymerases. Annu. Rev. Biophys. 37, 337–352 [DOI] [PubMed] [Google Scholar]
- 5. Gnatt A. L., Cramer P., Fu J., Bushnell D. A., Kornberg R. D. (2001) Structural basis of transcription: an RNA polymerase II elongation complex at 3.3 A resolution. Science 292, 1876–1882 [DOI] [PubMed] [Google Scholar]
- 6. Cramer P., Bushnell D. A., Kornberg R. D. (2001) Structural basis of transcription: RNA polymerase II at 2.8 angstrom resolution. Science 292, 1863–1876 [DOI] [PubMed] [Google Scholar]
- 7. Kuhn C. D., Geiger S. R., Baumli S., Gartmann M., Gerber J., Jennebach S., Mielke T., Tschochner H., Beckmann R., Cramer P. (2007) Functional architecture of RNA polymerase I. Cell 131, 1260–1272 [DOI] [PubMed] [Google Scholar]
- 8. Fernández-Tornero C., Böttcher B., Riva M., Carles C., Steuerwald U., Ruigrok R. W., Sentenac A., Müller C. W., Schoehn G. (2007) Insights into transcription initiation and termination from the electron microscopy structure of yeast RNA polymerase III. Mol. Cell 25, 813–823 [DOI] [PubMed] [Google Scholar]
- 9. Armache K. J., Mitterweger S., Meinhart A., Cramer P. (2005) Structures of complete RNA polymerase II and its subcomplex, Rpb4/7. J. Biol. Chem. 280, 7131–7134 [DOI] [PubMed] [Google Scholar]
- 10. Lorenzen K., Vannini A., Cramer P., Heck A. J. (2007) Structural biology of RNA polymerase III: mass spectrometry elucidates subcomplex architecture. Structure 15, 1237–1245 [DOI] [PubMed] [Google Scholar]
- 11. Ghaemmaghami S., Huh W. K., Bower K., Howson R. W., Belle A., Dephoure N., O'Shea E. K., Weissman J. S. (2003) Global analysis of protein expression in yeast. Nature 425, 737–741 [DOI] [PubMed] [Google Scholar]
- 12. Puig O., Caspary F., Rigaut G., Rutz B., Bouveret E., Bragado-Nilsson E., Wilm M., Séraphin B. (2001) The tandem affinity purification (TAP) method: a general procedure of protein complex purification. Methods 24, 218–229 [DOI] [PubMed] [Google Scholar]
- 13. Mosley A. L., Florens L., Wen Z., Washburn M. P. (2009) A label free quantitative proteomic analysis of the Saccharomyces cerevisiae nucleus. J. Proteomics 72, 110–120 [DOI] [PMC free article] [PubMed] [Google Scholar]
- 14. Washburn M. P., Wolters D., Yates J. R., 3rd (2001) Large-scale analysis of the yeast proteome by multidimensional protein identification technology. Nat. Biotechnol. 19, 242–247 [DOI] [PubMed] [Google Scholar]
- 15. Wolters D. A., Washburn M. P., Yates J. R., 3rd (2001) An automated multidimensional protein identification technology for shotgun proteomics. Anal. Chem. 73, 5683–5690 [DOI] [PubMed] [Google Scholar]
- 16. Eng J. K., McCormack A. L., Yates J. R. (1994) An approach to correlate tandem mass spectral data of peptides with amino acid sequences in a protein database. J. Am. Soc. Mass Spectrometry 5, 976–989 [DOI] [PubMed] [Google Scholar]
- 17. Ozkaynak E., Finley D., Varshavsky A. (1984) The yeast ubiquitin gene: head-to-tail repeats encoding a polyubiquitin precursor protein. Nature 312, 663–666 [DOI] [PubMed] [Google Scholar]
- 18. Ozkaynak E., Finley D., Solomon M. J., Varshavsky A. (1987) The yeast ubiquitin genes: a family of natural gene fusions. EMBO J. 6, 1429–1439 [DOI] [PMC free article] [PubMed] [Google Scholar]
- 19. Tabb D. L., McDonald W. H., Yates J. R., 3rd (2002) DTASelect and Contrast: tools for assembling and comparing protein identifications from shotgun proteomics. J. Proteome Res. 1, 21–26 [DOI] [PMC free article] [PubMed] [Google Scholar]
- 20. Sardiu M. E., Gilmore J. M., Carrozza M. J., Li B., Workman J. L., Florens L., Washburn M. P. (2009) Determining protein complex connectivity using a probabilistic deletion network derived from quantitative proteomics. PLoS One 4, e7310. [DOI] [PMC free article] [PubMed] [Google Scholar]
- 21. Zhang Y., Wen Z., Washburn M. P., Florens L. (2010) Refinements to label free proteome quantitation: how to deal with peptides shared by multiple proteins. Anal. Chem. 82, 2272–2281 [DOI] [PubMed] [Google Scholar]
- 22. Liu W. L., Coleman R. A., Grob P., King D. S., Florens L., Washburn M. P., Geles K. G., Yang J. L., Ramey V., Nogales E., Tjian R. (2008) Structural changes in TAF4b-TFIID correlate with promoter selectivity. Mol. Cell 29, 81–91 [DOI] [PMC free article] [PubMed] [Google Scholar]
- 23. Braisted J. C., Kuntumalla S., Vogel C., Marcotte E. M., Rodrigues A. R., Wang R., Huang S. T., Ferlanti E. S., Saeed A. I., Fleischmann R. D., Peterson S. N., Pieper R. (2008) The APEX Quantitative Proteomics Tool: generating protein quantitation estimates from LC-MS/MS proteomics results. BMC Bioinformatics 9, 529. [DOI] [PMC free article] [PubMed] [Google Scholar]
- 24. Lu P., Vogel C., Wang R., Yao X., Marcotte E. M. (2007) Absolute protein expression profiling estimates the relative contributions of transcriptional and translational regulation. Nat. Biotechnol. 25, 117–124 [DOI] [PubMed] [Google Scholar]
- 25. Vogel C., Marcotte E. M. (2008) Calculating absolute and relative protein abundance from mass spectrometry-based protein expression data. Nat. Protoc. 3, 1444–1451 [DOI] [PubMed] [Google Scholar]
- 26. Keller A., Eng J., Zhang N., Li X. J., Aebersold R. (2005) A uniform proteomics MS/MS analysis platform utilizing open XML file formats. Mol. Syst. Biol. 1, 2005.0017 [DOI] [PMC free article] [PubMed] [Google Scholar]
- 27. Xue X., Wu S., Wang Z., Zhu Y., He F. (2006) Protein probabilities in shotgun proteomics: evaluating different estimation methods using a semi-random sampling model. Proteomics 6, 6134–6145 [DOI] [PubMed] [Google Scholar]
- 28. Frank E., Hall M., Trigg L., Holmes G., Witten I. H. (2004) Data mining in bioinformatics using Weka. Bioinformatics 20, 2479–2481 [DOI] [PubMed] [Google Scholar]
- 29. Cagney G., Amiri S., Premawaradena T., Lindo M., Emili A. (2003) In silico proteome analysis to facilitate proteomics experiments using mass spectrometry. Proteome Sci 1, 5. [DOI] [PMC free article] [PubMed] [Google Scholar]
- 30. Beissbarth T., Speed T. P. (2004) GOstat: find statistically overrepresented Gene Ontologies within a group of genes. Bioinformatics 20, 1464–1465 [DOI] [PubMed] [Google Scholar]
- 31. Bushnell D. A., Kornberg R. D. (2003) Complete, 12-subunit RNA polymerase II at 4.1-A resolution: implications for the initiation of transcription. Proc. Natl. Acad. Sci. U.S.A. 100, 6969–6973 [DOI] [PMC free article] [PubMed] [Google Scholar]
- 32. Liu H., Sadygov R. G., Yates J. R., 3rd (2004) A model for random sampling and estimation of relative protein abundance in shotgun proteomics. Anal. Chem. 76, 4193–4201 [DOI] [PubMed] [Google Scholar]
- 33. Mallick P., Schirle M., Chen S. S., Flory M. R., Lee H., Martin D., Ranish J., Raught B., Schmitt R., Werner T., Kuster B., Aebersold R. (2007) Computational prediction of proteotypic peptides for quantitative proteomics. Nat. Biotechnol. 25, 125–131 [DOI] [PubMed] [Google Scholar]
- 34. Fusaro V. A., Mani D. R., Mesirov J. P., Carr S. A. (2009) Prediction of high-responding peptides for targeted protein assays by mass spectrometry. Nat. Biotechnol. 27, 190–198 [DOI] [PMC free article] [PubMed] [Google Scholar]
- 35. Keller A., Nesvizhskii A. I., Kolker E., Aebersold R. (2002) Empirical statistical model to estimate the accuracy of peptide identifications made by MS/MS and database search. Anal. Chem. 74, 5383–5392 [DOI] [PubMed] [Google Scholar]
- 36. Nesvizhskii A. I., Keller A., Kolker E., Aebersold R. (2003) A statistical model for identifying proteins by tandem mass spectrometry. Anal. Chem. 75, 4646–4658 [DOI] [PubMed] [Google Scholar]
- 37. Hartzog G. A., Wada T., Handa H., Winston F. (1998) Evidence that Spt4, Spt5, and Spt6 control transcription elongation by RNA polymerase II in Saccharomyces cerevisiae. Genes Dev. 12, 357–369 [DOI] [PMC free article] [PubMed] [Google Scholar]
- 38. Hirtreiter A., Damsma G. E., Cheung A. C., Klose D., Grohmann D., Vojnic E., Martin A. C., Cramer P., Werner F. (2010) Spt4/5 stimulates transcription elongation through the RNA polymerase clamp coiled-coil motif. Nucleic Acids Res. 38, 4040–4051 [DOI] [PMC free article] [PubMed] [Google Scholar]
- 39. Tan S., Aso T., Conaway R. C., Conaway J. W. (1994) Roles for both the RAP30 and RAP74 subunits of transcription factor IIF in transcription initiation and elongation by RNA polymerase II. J. Biol. Chem. 269, 25684–25691 [PubMed] [Google Scholar]
- 40. Andrulis E. D., Guzman E., Doring P., Werner J., Lis J. T. (2000) High-resolution localization of Drosophila Spt5 and Spt6 at heat shock genes in vivo: roles in promoter proximal pausing and transcription elongation. Genes Dev. 14, 2635–2649 [DOI] [PMC free article] [PubMed] [Google Scholar]
- 41. Saunders A., Werner J., Andrulis E. D., Nakayama T., Hirose S., Reinberg D., Lis J. T. (2003) Tracking FACT and the RNA polymerase II elongation complex through chromatin in vivo. Science 301, 1094–1096 [DOI] [PubMed] [Google Scholar]
- 42. Kaplan C. D., Morris J. R., Wu C., Winston F. (2000) Spt5 and spt6 are associated with active transcription and have characteristics of general elongation factors in D. melanogaster. Genes Dev. 14, 2623–2634 [DOI] [PMC free article] [PubMed] [Google Scholar]
- 43. Yamaguchi Y., Wada T., Watanabe D., Takagi T., Hasegawa J., Handa H. (1999) Structure and function of the human transcription elongation factor DSIF. J. Biol. Chem. 274, 8085–8092 [DOI] [PubMed] [Google Scholar]
- 44. Mayer A., Lidschreiber M., Siebert M., Leike K., Soding J., Cramer P. (2010) Uniform transitions of the general RNA polymerase II transcription complex. Nat. Struct. Mol. Biol. 17, 1272–1278 [DOI] [PubMed] [Google Scholar]
- 45. Renner D. B., Yamaguchi Y., Wada T., Handa H., Price D. H. (2001) A highly purified RNA polymerase II elongation control system. J. Biol. Chem. 276, 42601–42609 [DOI] [PubMed] [Google Scholar]
- 46. Cojocaru M., Jeronimo C., Forget D., Bouchard A., Bergeron D., Côte P., Poirier G. G., Greenblatt J., Coulombe B. (2008) Genomic location of the human RNA polymerase II general machinery: evidence for a role of TFIIF and Rpb7 at both early and late stages of transcription. Biochem. J. 409, 139–147 [DOI] [PMC free article] [PubMed] [Google Scholar]
- 47. Peiró-Chova L., Estruch F. (2009) The yeast RNA polymerase II-associated factor Iwr1p is involved in the basal and regulated transcription of specific genes. J. Biol. Chem. 284, 28958–28967 [DOI] [PMC free article] [PubMed] [Google Scholar]
- 48. Kanno T., Bucher E., Daxinger L., Huettel B., Kreil D. P., Breinig F., Lind M., Schmitt M. J., Simon S. A., Gurazada S. G., Meyers B. C., Lorkovic Z. J., Matzke A. J., Matzke M. (2010) RNA-directed DNA methylation and plant development require an IWR1-type transcription factor. EMBO Rep 11, 65–71 [DOI] [PMC free article] [PubMed] [Google Scholar]
- 49. Paoletti A. C., Parmely T. J., Tomomori-Sato C., Sato S., Zhu D., Conaway R. C., Conaway J. W., Florens L., Washburn M. P. (2006) Quantitative proteomic analysis of distinct mammalian Mediator complexes using normalized spectral abundance factors. Proc. Natl. Acad. Sci. U.S.A. 103, 18928–18933 [DOI] [PMC free article] [PubMed] [Google Scholar]