

Abstract
Affinity purification of proteins using antibodies coupled to beads and subsequent mass spectrometric analysis has become a standard technique for the identification of protein complexes. With the recent transfer of the isotope dilution mass spectrometry principle (IDMS) to the field of proteomics, quantitative analyses—such as the stoichiometry determination of protein complexes—have become achievable. Traditionally proteins were eluted from antibody-conjugated beads using glycine at low pH or using diluted acids such as HCl, TFA, or FA, but elution was often found to be incomplete. Using the cohesin complex and the anaphase promoting complex/cyclosome (APC/C) as examples, we show that a short 15−60 min predigestion with a protease such as LysC (modified on-bead digest termed protease elution) increases the elution efficiency 2- to 3-fold compared to standard acid elution protocols. While longer incubation periods—as performed in standard on-bead digestion—led to partial proteolysis of the cross-linked antibodies, no or only insignificant cleavage was observed after 15−60 min protease mediated elution. Using the protease elution method, we successfully determined the stoichiometry of the cohesin complex by absolute quantification of the four core subunits using LC-SRM analysis and 19 reference peptides generated with the EtEP strategy. Protease elution was 3-fold more efficient compared to HCl elution, but measurements using both elution techniques are in agreement with a 1:1:1:1 stoichiometry. Furthermore, using isoform specific reference peptides, we determined the exact STAG1:STAG2 stoichiometry within the population of cohesin complexes. In summary, we show that the protease elution protocol increases the recovery from affinity beads and is compatible with quantitative measurements such as the stoichiometry determination of protein complexes.
Keywords: protease elution, immunoadsorption, stoichiometry, protein complex, absolute quantification, EtEP, protein isoforms
Short abstract
A modified on-bead digestion termed “protease elution” increased the recovery of cohesin and APC/C complexes 2- to 3-fold from affinity-beads compared to standard acid elution protocols with only little sample contamination from antibody-peptides in contrast to standard on-bead digestion. Absolute quantification of cohesin revealed a 1:1:1:1 stoichiometry of the four core subunits, and isoform specific quantification revealed a STAG1:STAG2 ratio of 1:12 to 1:15 within the population of cohesin complexes.
Introduction
Proteins assemble into dynamic macromolecular complexes that regulate fundamental cellular processes such as cell cycle progression and mitosis.1,2 Affinity purification coupled to tandem mass spectrometry (AP-MS) has been used extensively to decipher the composition of protein complexes and their networks involved in a variety of biochemical processes in different organisms.2−10 But in contrast to the large number of expression proteomic studies that have generated quantitative data, large-scale AP-MS protein interaction studies have led to mostly qualitative data. Only recently, a small number of studies aimed to investigate the dynamics of protein complexes within protein interaction networks using affinity purification coupled to quantitative MS (AP-QMS) (reviewed in ref (11)).
One promising application of AP-QMS is the determination of protein complex stoichiometry, which is important information about the structural organization of a complex.10,12−16 Accurate and precise quantification is crucial for stoichiometry determination based on absolute quantification of the interacting constituents. Stoichiometry determination is particularly susceptible to errors in sample preparation; for example, it has been shown that choice of protein digest conditions can affect the results for the stoichiometry.(16) As the hydrolysis conditions have to be optimized for every complex to achieve complete digestion, stoichiometry determination has not been addressed in high-throughput studies so far and has therefore been limited in use to the characterization of individual protein complexes.
Immunoadsorption is one of the most widely used methods in biochemistry to purify proteins and their interaction partner(s). It makes use of a specific antibody−antigen interaction and therefore does not necessitate any artificial sequence (tag) incorporated into the “bait” which could interfere with the protein’s function such as the assembly into a macromolecular protein complex. Traditionally proteins are eluted from the antibody beads using glycine at low pH. Chemical labeling with reagents that target primary amines such as iTRAQ, TMT or mTRAQ for relative and absolute quantification are incompatible with the use of glycine.17−19 Therefore protein elution is performed with diluted acids such as HCl, TFA or FA at concentrations of ∼100 mM if chemical labeling using these reagents is to be performed. Independent of the acid elution protocol used incomplete elution from the antibody-conjugated beads is frequently observed. As a direct consequence, less material is available for the LC−MS analysis, leading to lower sequence coverage and lower signal-to-noise ratio in quantification experiments, respectively. Labugger et al. and Chrestensen et al. established an “on-bead digestion” protocol, which led to an increase in sequence coverage in the study of their protein of interest.20,21 In this protocol proteins are reduced, alkylated and subsequently digested for a prolonged period of time (usually overnight) while still bound to the antibody-conjugated beads. Although this protocol has been used in a number of studies7,20−25 several important parameters/factors have not been tested yet; (i) the sample contamination from cleaved antibody peptides when using cross-linked and noncross-linked antibody-conjugated beads, respectively, (ii) a comparison of acid elution methods to the on-bead digestion in a quantitative fashion, (iii) the time period required for efficient elution by the protease. Furthermore, in light of the recent shift toward quantitative interaction studies, there is a need to test the compatibility of the on-bead digestion protocol with quantification strategies such as the absolute quantification of protein complex subunits and the subsequent calculation of complex stoichiometry.
As a model complex for stoichiometry determination based on absolute quantification, we selected the cohesin complex. Cohesin’s main function is to hold sister chromatids together from their synthesis in S-phase of the cell cycle until the metaphase to anaphase transition, where cohesin is removed to allow separation of sister chromatids and exit from mitosis.26,27 Cohesin is an evolutionary well conserved protein complex consisting of four core components; SMC1, SMC3 and RAD21 form a ring-like structure to which STAG binds (reviewed in ref (28)). The exact subunit stoichiometry is not known, but on the basis of electron micrographs and biochemical experiments, a 1:1:1:1 stoichiometry has been proposed. Adding to the cohesin complexity, in somatic cells STAG occurs in two isoforms (STAG1, STAG2) which associate with the cohesin subunits in a mutually exclusive manner.29,30 In other words, cohesin complexes exist in two different populations; STAG1 and STAG2 containing cohesins, respectively. In human cultured HeLa cells, STAG2 was shown to be more abundant than STAG1, but the exact ratio of STAG1:STAG2 containing cohesins is not known.29,30
Here we show by labelfree and absolute quantification that a short 15−60 min predigestion with LysC (modified on-bead digestion termed protease elution) is 2- to 3-fold more efficient than the acid elution protocols. Using 19 reference peptides generated with our EtEP strategy,(31) of which 6 are specific for STAG1 and STAG2, respectively, we determined the cohesin complex stoichiometry and the exact STAG1/STAG2 stoichiometry from exponentially growing HeLa cells.
Methods and Materials
General Chemicals and Reagents
All chemicals purchased were of highest purity available. Trifluoroacetic acid (TFA), hydrochloric acid (HCl), isopropanol and tris(2-carboxyethyl)phosphine hydrochloride (TCEP) were purchased from Sigma-Aldrich (Steinheim, Germany). Formic acid (FA) was obtained from SAFC Biosciences (Andower, U.K.); triethlyammonium bicarbonate (TEAB) and S-methyl thiomethanesulfonate (MMTS) from Fluka (Buchs, Switzerland); and MS-grade modified trypsin was purchased from Promega (Madison, WI). Ultrapure 18-MΩ water was obtained from a Millipore Milli-Q-system (Bedford, MA).
Generation of mTRAQ Heavy Labeled Internal Reference Peptides
Generation of reference peptides was performed essentially as described.(31) In brief, peptides were synthesized by solid-phase Fmoc chemistry and purified on a Vision HPLC instrument (Applied Biosystems, Foster City, CA). According to the EtEP strategy, peptides were then trypsinized, labeled with mTRAQ heavy (ABSCIEX, Foster City, CA), quantified via mTRAQ light labeled equalizer peptide (GVTASVAGAR, amino acid analyzed) and mixed in equimolar amounts (Figure S6, Supporting Information).
Binding of Antibodies to Beads
For immunoadsorption experiments, affinity-purified antibodies were coupled to Affiprep protein A beads (Bio-Rad, Hercules, CA) in a ratio of 1 mg antibodies to 1 mL beads. For purification of cohesin we used an antibody raised against peptide FHDFDQPLPDLDDIDVAQQFSLNQSRVEEC of RAD21 (antibody 575) and for purification of ACP/C we used an antibody raised against peptide CTDADDTQLHAAESDEF of APC3 (antibody 233). Cross-linking 300 μL beads with 300 μg antibody was performed in 20 mM DMP (dimethyl pimelimidate dihydrochloride; Sigma-Aldrich, Steinheim, Germany) in 0.2 M Na-borate pH 9.2 for 30 min at RT. After two wash steps with 3 mL (10 bead volumes (bv)) 0.2 M Tris-HCl at pH 8.0 antibody-conjugated beads were washed twice with 3 mL (10 bv) of 0.1 M glycine at pH 2.0 to remove noncross-linked antibodies and finally washed with 3 mL (10 bv) of 1× PBS.
Immunoadsorption of Cohesin and APC/C
HeLa cells were grown in DMEM supplemented with 10% fetal bovine serum, 0.2 mM l-glutamine and antibiotics (all Invitrogen, Carlsbad, CA). For each immunoadsorption cells from four trays (25 × 25 cm2, ∼70% confluent) were harvested, washed once in 1× PBS and lysed with 15 strokes using a dounce homogenizer in 6 mL lysis buffer (20 mM Hepes pH 7.5, 150 mM NaCl, 10% glycerol, 1% triton X100, 2 mM EDTA and protease inhibitor cocktail mix). For binding, HeLa total cell extract S-20 was incubated with 30 μL antibody-conjugated beads and incubated on a rotary shaker for 90 min at 4 °C. Subsequently, the beads were washed 6 times with 1.5 mL (50 bv) of wash buffer (as lysis buffer but 1% trition X-100 was substituted for 0.2% NP-40). Finally, before elution beads were washed with 1.5 mL (50 bv) of 150 mM NaCl, pelleted and the supernatant was carefully removed.
Acid Elution, Protease Elution and Complex Digestion
For acid elution, 15 μL beads were incubated on a rotary shaker for 3 min at RT with 30 μL (2 bv) of 100 mM glycine pH 2.0, 100 mM HCl, 100 mM FA and 100 mM TFA, respectively. The supernatant was collected and neutralized by adding 1.5 μL (0.1 bv) 2 M NaOH. Finally, the eluate was diluted 1:2 with 1 M TEAB. For protease elution, 15 μL beads were resuspended with 30 μL (2 bv) of 500 mM TEAB and incubated with 500 ng LysC (Wako, Richmond, VA) or trypsin (MS grade trypsin gold, Promega), respectively for the time periods indicated in the results and discussion section. After elution by predigestion the supernatant was collected and diluted with 500 mM TEAB to give the same final volume as after acid elution. Next, differently eluted fractions were reduced in 1 mM TCEP for 30 min at 56 °C and alkylated in 2 mM MMTS for 30 min at RT in the dark. Samples were then further digested by addition of 500 ng of LysC for 14 h at 37 °C followed by a 16 h digest with 1 μg trypsin at 37 °C (in case of LysC elution) or digested by addition of 500 ng trypsin and incubation for 16 h at 37 °C (in case of trypsin elution). Digested samples were then either analyzed on an Orbitrap XL for labelfree quantification or labeled with mTRAQ heavy (HCl elution) according to the manufacturer’s instructions for absolute quantification on a 5500 QTRAP instrument. To assess completeness of mTRAQ labeling a fraction of the labeled sample was analyzed on an Orbitrap XL and spectra were searched against the IPI database using Mascot 2.2 with and without mTRAQ light as variable modification.
Analysis on nano-HPLC Equipped with a Monolithic Column
Thirty μL αAPC3 and αRAD21 antibody-conjugated beads were suspended with 60 μL (2 bv) 500 mM TEAB and incubated with 500 ng trypsin and 500 ng lysC, respectively. After incubation for 1, 4, and 16 h at 37 °C under constant shaking at 1300 rpm in an Eppendorf Thermomixer, 10 μL of the supernatant were collected and proteolysis was stopped by addition of 240 μL 1% TFA. Then 1.5 μL sample diluted in 20 μL 0.1% TFA was separated on a Dionex Ultimate equipped with a 200 μm I.D. monolithic column (PepSwift from Dionex, Amsterdam, The Netherlands) using a gradient from 5% ACN, 0.1% TFA to 80% ACN, 10% TFE, 0.08% TFA over 25 min.
Labelfree Quantification on Orbitrap XL
One fifth of each eluate was separated using a Dionex Ultimate 3000 nanoLC system equipped with a C18 PepMap column (75 μm i.d. × 150 cm length, 3 μm particle size, 100 A pore size) (Dionex, Amsterdam, The Netherlands) using a 55 min gradient from 5% ACN, 0.1% FA to 30% ACN, 0.1% FA followed by a 5 min gradient from 30% ACN, 0.08% FA to 80% ACN, 10% TFA, 0.08% FA. Peptides eluting from the nano-RP-HPLC were analyzed on an LTQ Orbitrap XL mass spectrometer (Thermo Fisher Scientific, Bremen, Germany), equipped with a nanoelectrospray ion source (Proxeon, Odense, Denmark) with an applied voltage of 2 kV. The mass spectrometer was operated in data-dependent mode: 1 full scan (m/z 350−1600) was acquired in the Orbitrap (resolution of 60 000) followed by MS/MS scans of the five most abundant ions in the LTQ. The chosen ions were excluded from further selection for 60 s. Fragment ion data were interpreted using Mascot 2.2 (Matrix Science, London, UK) within the Proteome Discoverer Software (Thermo Fisher Scientific, v 1.2). Data were searched against the human International Protein Index (IPI) database (v 3.74). Following search parameters were used: tryptic peptides; up to 3 missed cleavage sites; oxidation (M), phosporylation (S,T,Y), pyro-glutamate (N-term) as variable modifications and methylthio (C) as fixed modification; peptide mass tolerance of 3 ppm and fragment ion tolerance of 0.5 Da. Extracted ion chromatograms (XICs) of peptides with a Mascot score of ≥25 and which were ranked 1 were extracted using the Precursor Ion Area Detector feature within Proteome Discoverer 1.2 with a mass tolerance of 3 ppm. For labelfree quantification ratios of XICs of peptides identified with all 5 elution methods were calculated relative to glycine elution. Only peptides without chemical modification (such as oxidized methionine, S,T,Y-phosphorylation, N-terminal pyroglutamate) were included in relative quantification.
Absolute Quantification by SRM Analysis on a 5500 QTRAP
Immediately before LC-SRM analysis digested and labeled cohesin was spiked with 25 fmol of each internal reference peptide in case of the experiment shown in Figure 4a and with 10 fmol in case of the experiment shown in Figure 4b. To remove excess of 2-propanol samples were concentrated in a Speed Vac for 10 min to a final volume of approximately 25% of the starting volume and rediluted with 0.1% TFA to identical sample volumes. Samples were then separated on a Dionex Ultimate nano-HPLC equipped with a C18 PepMap column (75 μm ID × 150 mm length, 3 μm particle size, 100 Å pore size) (Dionex, Amsterdam, The Netherlands) using the following gradient of solvents A (5% ACN, 0.1% FA), B (30% ACN, 0.08% FA) and C (80% ACN, 10% TFE, 0.08% FA) at a flow rate of 300 nL/min: from 0% B, 0% C to 100% B, 0% C over 30 min followed by a gradient to 0% B, 90% C over 5 min. Peptides eluting from the nanoLC were analyzed on a 5500 QTRAP instrument (ABSCIEX, Foster City, CA) equipped with a nanoelectrospray source with applied voltage of 2.3 kV. The mass spectrometer was operated in scheduled SRM mode with the following parameters: MRM detection window of 180 s, target scan time of 2 s, curtain gas of 20, ion source gas 1 of 15, declustering potential of 75, entrance potential of 10. Q1 resolution was set to unit and Q3 resolution to low. Pause between mass ranges was set to 2.5 ms. Three SRM transitions per peptide (Table S1, Supporting Information) were selected and optimized for collision energy by direct infusion of internal reference peptides. Collision cell exit potentials (CXP) were calculated by dividing Q3 mass by a factor of 29. Peak integration was performed using MultiQuant 1.2 (ABSCIEX, FosterCity, CA) software and manually reviewed. Light to heavy peak area ratios were calculated over the three transitions and two replicates to calculate absolute amounts loaded on column and complex stoichiometry.
Figure 4.

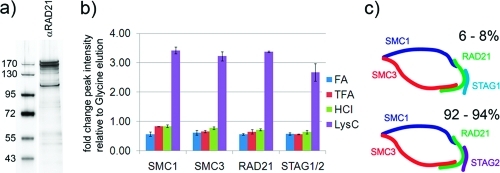
Absolute quantification of isolated cohesin subunits by LC-SRM analysis on a 5500 QTRAP. (a) Comparing 15, 30, and 60 min LysC protease elution. Data are mean ± SD of four measured peptides in case of SMC1, SMC3 and RAD21 and of three measured peptides in case of STAG1 and STAG2, respectively. Measurements of cohesin peptides were performed in duplicate. (b) Calculation of complex stoichiometry relative to the bait (RAD21) protein. (c) Comparing 30 min LysC predigestion and HCl elution. Data are mean ± SD of four measured peptides in case of SMC1, SMC3 and RAD21 and of three measured peptides in case of STAG1 and STAG2, respectively. Measurements of cohesin peptides were performed in duplicate. (d) Calculation of complex stoichiometry relative to the bait (RAD21) protein.
Results and Discussion
Testing the Proteolytic Stability of Cross-Linked Antibody-Conjugated Beads
In the standard on-bead digestion protocol antibody-conjugated beads are incubated for a prolonged period of time with a protease to allow digestion of the purified sample.20−25,32,33 To test the proteolytic stability of the cross-linked antibody beads and therefore to assess a potential sample contamination from antibody peptides, we incubated Affiprep protein A sepharose beads cross-linked with two different antibodies (αAPC3 and αRAD21) with trypsin and LysC, respectively. After 1, 4, and 16 h of incubation, beads were removed by centrifugation and an aliquot of the supernatant was separated using a monolithic column, which allows the simultaneous separation of peptides and proteins (Figure 1). We loaded a volume of the supernatant that corresponded to 2 pmol of antibody (assuming complete proteolysis and hence release of antibody peptides to the supernatant). After 1 h of incubation with trypsin and LysC, respectively no signals other than background were visible in the UV chromatograms, indicating no or only little cleavage of the antibodies. In case of trypsin, after 4 h of incubation the first additional signals were visible, indicating minor cleavage and after 16 h signal intensities stemming from cleaved antibodies were further increased (compare to 1 pmol of trypsinized BSA shown in Figure S1, Supporting Information, and to Figure 3a). In contrast to incubation with trypsin, antibody beads incubated with LysC resulted in no, or only minor, cleavage (after 16 h, αRAD21) of the antibody. The observed higher resistance of the antibodies toward proteolysis when incubated with LysC can most likely be explained by two factors: (i) the trypsin we used is chemically modified to inhibit autolysis and to increase stability whereas the unmodified LysC undergoes autolysis and therefore loses activity during incubation and (ii) trypsin cleaves C-terminal to arginine and lysine whereas LysC only cleaves after lysine, which in turn is chemically modified by the cross-linker. Hence, cross-linking results in one recognizable cleavage site for trypsin but no site for LysC on the surface of the antibody.
Figure 1.

UV chromatograms of proteolyzed cross-linked antibodies analyzed using a monolithic column. αRAD21 (panels (a) and (b)) and αAPC3 (panels (c) and (d)) antibodies cross-linked to AffiPrep A beads were incubated with trypsin and LysC, respectively. At the indicated time points an aliquot, which corresponded to 2 pmol antibody (assuming complete cleavage) was separated using a monolithic column. Increasing absorption in the UV chromatograms indicate proteolytic cleavage of the antibodies. For better illustration, chromatograms are displayed with a 5% time and a 15% signal offset.
Figure 3.

UV chromatograms of proteolyzed cross-linked and noncross-linked antibodies analyzed using a monolithic column. Cohesin was purified using αRAD21 antibody beads. (a) Cross-linked and noncross-linked αRAD21 antibody beads were incubated with LysC for 15 min and an aliquot, which corresponded to 2 pmol antibodies (assuming complete cleavage) was separated using a monolithic column. (b) 50-fold the amount shown in (a) (of cross-linked αRAD21 antibody beads) was separated using a monolithic column, after 15, 30, and 60 min of incubation with LysC. For better illustration chromatograms are displayed with a 5% time and a 15% signal offset.
In none of the studies that employed on-bead digestion a potential contamination from cleaved antibody peptides was assessed, although proteolysis of cross-linked antibodies was described.(34) Due to the fact that the antibody is usually present in excess compared to the purified sample, already minor antibody cleavage, as observed after 4 h of proteolysis, can lead to a significant increase of background unfavorable for subsequent LC-SRM or LC−MS/MS analyses.
To test the influence of antibody proteolysis on MS-based identification we purified cohesin and APC/C and performed on-bead digestion for 1, 4 and 16 h followed by a sequential digestion after separation of beads and sample. MS analysis on an LTQ Orbitrap revealed that the number of peptides identified (Mascot score >25) was highest after only 1 h of on-bead predigestion for elution compared to 4 and 16 h, regardless of the protease used for on-bead predigestion (Table S2, Supporting Information). For example, the known cohesin interactor Wings apart-like (WAPL) was identified with 11 peptides after 1 h LysC elution, with 8 peptides after 4 h LysC elution and with only 3 peptides after 16 h LysC elution. In case trypsin was used for elution this effect was even more pronounced; we identified 9 WAPL peptides after 1 h, 1 peptide after 4 h and no peptide was identified after 16 h predigestion for elution. MS analysis of APC/C eluted with 1, 4 and 16 h on-bead predigestion showed a similar result (Table S3, Supporting Information). These effect most likely results from two factors: (i) the mass spectrometer spends time on sequencing antibody peptides and more importantly (ii) extended on-bead digestion periods result in a dramatically increased protein concentration due to released antibody peptides (Figure 1), which limit the amount of sample that can be loaded onto the column (see Tables S3 and S4 for further details, Supporting Information). For example, of the 16 h trypsin on-bead predigested cohesin sample we could only load 1/5th of the volume compared to the 1 h on-bead predigestion, nevertheless the total amount of protein loaded was considerable higher and close to the columns capacity as judged by the UV chromatogram (not shown). Consequently, to limit the degree of antibody proteolysis and to therefore increase sensitivity, we decided to shorten codigestion of sample and antibodies to 1 h followed by a sequential digestion of the sample after separation from antibody-conjugated beads. Hence we refer to this protocol as “protease elution” rather than “on-bead” digestion.
Affinity Purification of Cohesin and APC/C and Comparison of Elution Protocols by Labelfree Quantification
To test such a “protease elution” protocol in terms of elution efficiency and sample contamination from cleaved antibody peptides we purified cohesin and APC/C by immunoadsorption from soluble extract of HeLa cells, performed labelfree quantification on an Orbitrap XL and compared the results to standard acid elution protocols. Protein complexes were purified using Affiprep beads cross-linked with αRAD21 and with αAPC3 antibodies, respectively and eluted using glycine at pH 2.0 (Figure 2a). Analysis on an Orbitrap XL and Mascot searches of the acquired spectra against the IPI database (v 3.74) identified the four core cohesin subunits within the top 8 identifications and 12 out of 13 APC/C subunits within the top 50 identifications, respectively. In order to allow a quantitative comparison of different elution methods we purified cohesin and APC/C and performed XIC (extracted ion chromatogram) based labelfree quantification on an LTQ Orbitrap XL instrument. Immediately before the elution step, Affiprep beads were split into 5 aliquots and proteins were eluted using 2 bead volumes (bv) of the following reagents; 100 mM glycine pH 2.0, 100 mM HCl, 100 mM FA and 100 mM TFA (Figure S2, Supporting Information). Additionally we resuspended 1 aliquot of beads in 2 bv of 500 mM TEAB buffer and added LysC protease. We selected LysC protease for elution because our standard digest protocol for quantification studies is comprised of a sequential LysC−trypsin double digestion. Additional results obtained using trypsin for elution is presented in the Supporting Information. In the on-bead digestion protocol proteins bound to the antibody beads are incubated with a protease for a prolonged period of time, usually overnight.20−25,32,33 In contrast to standard on-bead digestion and based on the proteolytic stability experiments discussed above we incubated the antibody beads for only 1 h at 37 °C with LysC, arguing that a short predigestion of the bait protein might be sufficient to release the protein complexes from the antibody beads. We therefore refer to this protocol as “protease elution” rather than “on-bead digestion”. Supernatants were collected and subsequently digested as described in the materials and methods section using a LysC−trypsin double digest and identical sample volumes were analyzed on an Orbitrap XL instrument. Spectra were searched against the human IPI database using the Mascot search engine and ion chromatograms (XIC) were extracted through Proteome Discoverer 1.2 software. Labelfree quantification based on XICs of cohesin peptides identified in all 5 samples revealed that elution using HCl, FA and TFA was less efficient than standard glycine elution, while XICs of LysC eluted peptides were on average 3-fold higher compared to glycine elution (Figure 2b and Figure S3, Supporting Information). Labelfree quantification of APC/C subunits showed a similar result; HCl, FA and TFA elution were equally or slightly less efficient, while LysC elution was on average 2-fold more efficient compared to standard glycine elution (Figure 2c and Figure S4, Supporting Information). SDS-PAGE of eluate fractions and the supernatant after boiling the beads in SDS containing buffer (Laemmli buffer) revealed that a considerable portion of the purified protein complexes were not eluted by the acidic buffers (Figure S2, lanes denoted as “beads”, Supporting Information). Using the protease elution protocol, protein complexes are already predigested to smaller fragments. Therefore no conclusion can be drawn from the corresponding lanes on the protein gel with respect to the elution efficiency. However, the 2- to 3-fold more intense XICs after LysC elution correspond well with the tightly bound fraction not eluted using the acidic buffers, suggesting greatly improved if not complete elution after only 1 h of LysC predigestion.
Figure 2.

(a) SDS-PAGE of isolated APC/C and cohesin from soluble extract of HeLa cells. (b) Labelfree quantification of cohesin subunits eluted using different protocols by XIC relative to glycine elution. (c) Labelfree quantification of APC/C subunits eluted using different protocols by XIC relative to glycine elution. Data are mean ± SD of duplicate measurements. See also Figures S3 and S4 for peptide scattering within subunits in the technical duplicates (Supporting Information).
Proteolytic stability tests described above using a monolithic column revealed that no or only a minor amount of antibody is cleaved during the 1 h LysC incubation (Figure 1). However, to verify this result and to compare the degree of sample contamination from the antibody in acid elution versus LysC elution we extracted XICs of identified peptides stemming from the Fc region of the IgG (3 identified in glycine eluate, 7 in LysC eluate of APC/C purification using αAPC3 antibody). XICs of the LysC eluate were on average 20-fold more intense compared to glycine eluate (3 peptides in common) (Figure S5, Supporting Information). Similar results were obtained when the contamination from αRAD21 antibody peptides was evaluated (not shown). But in general, antibody peptides accounted for only a minor amount of the TIC (total ion current) in the glycine and protease eluted sample, respectively (Figure S5, Supporting Information). Hence the protease elution protocol allowed the complete recovery of immunoadsorbed protein complexes after only 1 h of incubation with LysC with only very little contamination from antibody peptides.
Can Noncross-Linked Antibody-Conjugated Beads Be Used?
Chemical cross-linking not only covalently attaches the antibody to the Protein A Affiprep beads but also introduces intramolecular cross-links within the antibody. This can affect the binding sites leading to a reduction or even loss in specificity toward the antigen. Therefore, we tested whether noncross-linked antibody-conjugated beads are also compatible with the protease elution method. We purified cohesin using cross-linked and noncross-linked antibody beads and performed LysC elution. To monitor whether the antibody is intrinsically stable to proteolysis or whether chemical cross-linking confers resistance we separated LysC predigested aliquots of the 15 min, 30 and 60 min time-point using a monolithic column. As performed in the initial proteolytic stability experiments we again loaded a volume that corresponded to 2 pmol of antibody (assuming complete digestion). Figure 3a shows UV absorption of the 15 min time point in the range of 1.5−3.5 mAU in case of the noncross-linked antibody and lesser then 0.3 mAU in case of the cross-linked antibody. As 1 pmol digested BSA separated on the same column gives absorption in the range of 2.5−5 mAU (Figure S1, Supporting Information) it can be concluded that the noncross-linked antibody is rapidly predigested and therefore contaminates the sample to an extent unsuitable for further MS analysis. In contrast, when chemically cross-linked, the antibody was again shown to be resistant to proteolysis. To monitor the kinetics of sample protein release from cross-linked antibody-beads we separated a 50-fold greater amount of the sample from the 15 min, 30 and 60 min predigestion time-point again using a monolithic column. Figure 3b shows only a minor increase in UV absorption from the 15 min to the 60 min time-point, indicating rapid predigestion and release of proteins. Subsequent LC−MS/MS analyses revealed that the number of unique peptides identified (Mascot score > 25) from the core cohesin subunits was essentially identical in all three predigestion periods analyzed (Table S4, Supporting Information). Hence, mass spectrometry based identification confirmed the interpretation of the results obtained with the monolithic column. Proteins bound to the affinity beads are sufficiently predigested already after 15 min leading to the release of proteins from the affinity beads.
Absolute Quantification of Cohesin Subunits and Stoichiometry Calculation
To test the robustness and compatibility of the protease elution protocol with AP-QMS strategies we performed absolute quantification of core cohesin subunits, tested whether different protease predigestion periods influence the outcome of stoichiometry determination and compared the obtained results to a standard acid elution protocol.
First, to perform absolute quantification according to the IDMS principle we generated 19 internal reference peptides (Table S1, Supporting Information) using our previously described EtEP method (Figure S6, Supporting Information, and ref (31)). The sequences of selected reference peptides including an N-terminal K/R were blasted against the nonredundant (nr) database and all, but two peptides (VEDELK from SCC1 and EDLLR from STAG1), were found to be proteotypic. LC−MS/MS analysis of affinity purified cohesin identified no other peptides from proteins that share these two peptides, thus allowing inclusion of VEDELK and EDLLR for quantification. Our EtEP method allows the cost-efficient generation of an equimolar mixture of reference peptides of high accuracy by using an “equalizer peptide” to circumvent amino acid analysis and by using the mTRAQ reagent to introduce the isotopic label (Figure S6, Supporting Information). As peptides are only surrogates of the protein to be quantified, we selected 4 peptides per cohesin subunit to increase the accuracy of quantification. In case of STAG, 3 peptides are specific for isoform 1, 3 are specific for isoform 2 and one peptide is specific for both isoforms.
We then set up a scheduled SRM method monitoring 3 transitions each for light (sample) and heavy (reference) peptide (Table S1, Figure S9, Supporting Information). Transitions were optimized for intensity by direct infusion of peptides and ramping of collision energy. To allow accurate quantification by calculating light/heavy ratios we determined the linear range of the reference peptides. This is of particular importance for peptides that will not be close to a light/heavy ratio of 1 and are of low abundance. For our set of peptides this scenario was expected for STAG1 specific peptides as STAG1 was shown to be the less abundant of the two STAG isoforms. For all reference peptides MS detector signal response was linear in the range from 1.56 to 100 fmol and most important, all STAG1 specific peptides showed a linear response from 390 amol to 100 fmol (Figure S7, Supporting Information).
Time course experiments of the protease elution analyzed on the monolithic column and by MS suggested that a 15 min predigestion might be sufficient to release proteins from the affinity beads (Figure 3 and Table S4, Supporting Information). Here, using absolute quantification we validated this finding and determined the complex stoichiometry to test whether different LysC predigestion periods influence the analysis. Figure 4a and b and Figure S8 (Supporting Information) show the result of the SRM analysis where we spiked 25 fmol of each reference peptide to the digested complex eluted by 15 min, 30 and 60 min LysC predigestion, respectively. Apparently LysC predigestion for as short as 15 min is sufficient to release the complex from the antibody, although longer predigestion led to a minor increase in abundance of measured cohesin subunits. Most importantly, measurements and subsequent stoichiometry calculation of all 3 time points are in agreement with a 1:1:1:1 stoichiometry of the four core cohesin subunits.
We also performed absolute quantification from preparations that used trypsin to elute the protein complex from the antibody beads, followed by a single 16 h trypsin digestion overnight (Figures S12−S13, Supporting Information). However, strong differences in quantitative results from peptides derived from the same protein, as well as a high number of missed cleavage sites identified in LC−MS/MS experiments indicated in-complete digestion, a situation not compatible with absolute quantification. This result again highlights the importance of assessing the completeness of sample digestion and the measurement of at least two to three peptides per protein. Results using trypsin elution followed by overnight trypsin digestion are presented in the Supporting Information. Furthermore, because a change in stoichiometry determination after digestion under denaturing conditions was reported,(16) we also performed LysC elution and subsequent LysC−trypsin digestion in the presence of 2 M urea (30 min LysC elution). Measurements and calculation of stoichiometry were again in agreement with a 1:1:1:1 stoichiometry (data not shown).
To test whether the LysC elution protocol introduces a bias in the quantitative composition of complex subunits compared to a standard acid elution we again determined the stoichiometry of cohesin isolated from soluble extract of HeLa cells. As a reference elution protocol we used HCl elution, which was the most efficient mTRAQ compatible elution protocol in the initial labelfree experiments. Quantification using the established SRM method revealed again a 1:1:1:1 stoichiometry of the four cohesin subunits independently of the elution method used (Figure 4c and d). Furthermore, the experiment confirmed the significantly better elution efficiency of the LysC elution (30 min) compared to acid elution. For quantification of STAG1 the higher recovery had practical relevance. We set a minimum transition intensity of 500 cps over background in our SRM method. Calculation of peptide amount was performed by averaging the light/heavy ratios of all three transitions monitored. Due to the low abundance of STAG1, upon HCl elution all three transitions of the peptide YSADAEK were below the threshold, not allowing quantification (not shown). Intensity of EDLLVLR specific transition 499.3→710.4 (b5 fragment) was below the 500 cps threshold, leaving only two transitions for quantification (Figure S10, Supporting Information). Additionally, the calculated absolute amount of STAG1 loaded onto the column was 330 amol and was thus below the tested dynamic range of STAG1 specific reference peptides. In contrast, due to the 3-fold better recovery of the protease elution all YSADAEK and EDLLVLR transitions were above the 500 cps threshold allowing quantification of STAG1 based on all 3 spiked reference peptides. The measured absolute amount of STAG1 was 820 amol and therefore within the tested dynamic range. In summary, the experiments illustrate the superiority of the protease elution method over standard acid elution with respect to recovery from affinity beads. Furthermore, they demonstrate the robustness and also the compatibility of the protease elution protocol with AP-QMS strategies such as the stoichiometry determination of protein complexes.
Stoichiometry determination based on the absolute quantification of interacting subunits requires purification of a homogeneous sample.(12) We selected a αRAD21 antibody for coimmunoadsorption experiments because most if not all RAD21 is found in the 14S cohesin complex, where other subunits have also been detected in subcomplexes of cohesin. For example, SMC1 and SMC3 also exist as a heterodimer.(29) Thus, using a RAD21 antibody allowed us to separate both of the 14S cohesin complexes (STAG1 and STAG2 containing) from cohesin subcomplexes without enriching for free, non cohesin associated RAD21. In the present study we showed for the first time that cohesin from soluble HeLa extract forms a complex with a 1:1:1:1 stoichiometry. This is in agreement with the current structural model of cohesin based on electron micrographs, crystal structure of subunit fragments and available biochemical data (reviewed in ref (28)).
Only a few studies so far reported the quantification of protein isoforms.35−38 We used a total of 7 reference peptides for STAG quantification; three were specific for isoform 1, three were specific for isoform 2 and one measured both isoforms (DGIEFAFK). In all cases measured amounts of DGIEFAFK were within a 10% tolerance of STAG1 + STAG2 amounts, thus increasing the confidence of STAG quantification (Figure S8). It was previously shown by immunoadsorption and Western blot analysis that the ring-like SMC1-SMC3-RAD21 structure preferentially associates with STAG2. The authors concluded from their experiments that the STAG1:STAG2 ratio of cohesin subpopulations is about 1:3 (see Figure 3D in ref (30)). Here, using MS based absolute quantification we determined the STAG1:STAG2 ratio to be in the range of 1:12 to 1:15 in cohesin purified from soluble extract of exponentially growing HeLa cells (Figure 5). The discrepancy could be explained by the limited dynamic range and the semiquantitative nature of quantification based on Western blotting and densitometry.(39)
Figure 5.
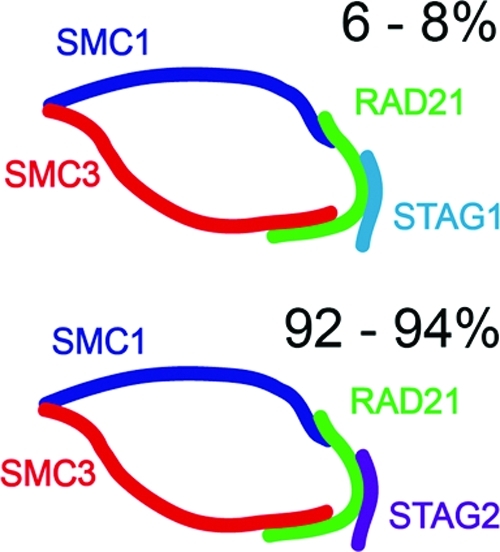
Relative abundance of STAG isoforms in the population of cohesin complexes. Cohesin is predicted to form a ring-like structure (ref (28)) with a subunit stoichiometry of 1:1:1:1 as measured in this study. The relative abundance of STAG1 containing cohesin is 6−8% and that of STAG2 is 92−94% in soluble extract of logarithmically growing HeLa cells.
Conclusion
In the present study, we have shown that a protease mediated elution increased the recovery of cohesin and APC/C from antibody-conjugated affinity beads by a factor of 2 to three. Hence, while acid elution was found to be less efficient, a simple predigestion for 15−60 min was sufficient for greatly improved if not complete recovery without leading to a significant sample contamination from cleaved antibody peptides. Furthermore, absolute quantification and subsequent stoichiometry determination of the cohesin complex demonstrated the robustness and compatibility of the protease elution method with AP-QMS studies. Using this elution technique we have for the first time measured the subunit stoichiometry of the cohesin complex from soluble extract of HeLa cells. The protease elution method is ideally suited for absolute quantification studies where sensitivity is crucial, demonstrated in this study by measuring the exact STAG1:STAG2 stoichiometry within the population of cohesin complexes. It can further be applied to the determination of protein copy numbers due to efficient if not complete recovery from affinity beads (if complete depletion of the protein from the extract is shown). Applied to the identification of protein complexes in AP-QMS studies it has the potential to increase the sensitivity for detecting low abundant interactors, again due to higher recovery compared to acid elution and because of no or only insignificant contamination from cleaved antibody peptides compared to standard on-bead digestion.
Acknowledgments
We are grateful to our colleagues from the Mechtler and the Peters Group: Elisabeth Roitinger, Andreas Schmidt and Thomas Köcher for useful discussions and critical reading of the manuscript, Jim Hutchins for help with immunoadsorption, Venugopal Bhaskara for generously providing antibodies and for useful discussions. Work in the Mechtler and Peters Group is supported by Boehringer Ingelheim, the Austrian Proteomics Platform (APP-III) within the Austrian Genome Research Programme (GEN-AU III) and by the MitoSys project funded by the 7th framework program of the European Union. J.H. was supported by the Austrian Science Foundation (FWF), SFB-F3402, Chromosome Dynamics.
Supporting Information Available
Additional Results and Discussion, monolithic chromatograms, details on the quantification by SRM are given. This material is available free of charge via the Internet at http://pubs.acs.org.
Supplementary Material
References
- Sullivan M.; Morgan D. O. Finishing mitosis, one step at a time. Nat. Rev. Mol. Cell Biol. 2007, 8 (11), 894–903. [DOI] [PubMed] [Google Scholar]
- Hutchins J. R.; Toyoda Y.; Hegemann B.; Poser I.; Heriche J. K.; Sykora M. M.; Augsburg M.; Hudecz O.; Buschhorn B. A.; Bulkescher J.; Conrad C.; Comartin D.; Schleiffer A.; Sarov M.; Pozniakovsky A.; Slabicki M. M.; Schloissnig S.; Steinmacher I.; Leuschner M.; Ssykor A.; Lawo S.; Pelletier L.; Stark H.; Nasmyth K.; Ellenberg J.; Durbin R.; Buchholz F.; Mechtler K.; Hyman A. A.; Peters J. M. Systematic analysis of human protein complexes identifies chromosome segregation proteins. Science 328 (5978), 593–9. [DOI] [PMC free article] [PubMed] [Google Scholar]
- Kuhner S.; van Noort V.; Betts M. J.; Leo-Macias A.; Batisse C.; Rode M.; Yamada T.; Maier T.; Bader S.; Beltran-Alvarez P.; Castano-Diez D.; Chen W. H.; Devos D.; Guell M.; Norambuena T.; Racke I.; Rybin V.; Schmidt A.; Yus E.; Aebersold R.; Herrmann R.; Bottcher B.; Frangakis A. S.; Russell R. B.; Serrano L.; Bork P.; Gavin A. C. Proteome organization in a genome-reduced bacterium. Science 2009, 326 (5957), 1235–40. [DOI] [PubMed] [Google Scholar]
- Gavin A. C.; Bosche M.; Krause R.; Grandi P.; Marzioch M.; Bauer A.; Schultz J.; Rick J. M.; Michon A. M.; Cruciat C. M.; Remor M.; Hofert C.; Schelder M.; Brajenovic M.; Ruffner H.; Merino A.; Klein K.; Hudak M.; Dickson D.; Rudi T.; Gnau V.; Bauch A.; Bastuck S.; Huhse B.; Leutwein C.; Heurtier M. A.; Copley R. R.; Edelmann A.; Querfurth E.; Rybin V.; Drewes G.; Raida M.; Bouwmeester T.; Bork P.; Seraphin B.; Kuster B.; Neubauer G.; Superti-Furga G. Functional organization of the yeast proteome by systematic analysis of protein complexes. Nature 2002, 415 (6868), 141–7. [DOI] [PubMed] [Google Scholar]
- Gavin A. C.; Aloy P.; Grandi P.; Krause R.; Boesche M.; Marzioch M.; Rau C.; Jensen L. J.; Bastuck S.; Dumpelfeld B.; Edelmann A.; Heurtier M. A.; Hoffman V.; Hoefert C.; Klein K.; Hudak M.; Michon A. M.; Schelder M.; Schirle M.; Remor M.; Rudi T.; Hooper S.; Bauer A.; Bouwmeester T.; Casari G.; Drewes G.; Neubauer G.; Rick J. M.; Kuster B.; Bork P.; Russell R. B.; Superti-Furga G. Proteome survey reveals modularity of the yeast cell machinery. Nature 2006, 440 (7084), 631–6. [DOI] [PubMed] [Google Scholar]
- Krogan N. J.; Cagney G.; Yu H.; Zhong G.; Guo X.; Ignatchenko A.; Li J.; Pu S.; Datta N.; Tikuisis A. P.; Punna T.; Peregrin-Alvarez J. M.; Shales M.; Zhang X.; Davey M.; Robinson M. D.; Paccanaro A.; Bray J. E.; Sheung A.; Beattie B.; Richards D. P.; Canadien V.; Lalev A.; Mena F.; Wong P.; Starostine A.; Canete M. M.; Vlasblom J.; Wu S.; Orsi C.; Collins S. R.; Chandran S.; Haw R.; Rilstone J. J.; Gandi K.; Thompson N. J.; Musso G.; St Onge P.; Ghanny S.; Lam M. H.; Butland G.; Altaf-Ul A. M.; Kanaya S.; Shilatifard A.; O’Shea E.; Weissman J. S.; Ingles C. J.; Hughes T. R.; Parkinson J.; Gerstein M.; Wodak S. J.; Emili A.; Greenblatt J. F. Global landscape of protein complexes in the yeast Saccharomyces cerevisiae. Nature 2006, 440 (7084), 637–43. [DOI] [PubMed] [Google Scholar]
- Breitkreutz A.; Choi H.; Sharom J. R.; Boucher L.; Neduva V.; Larsen B.; Lin Z. Y.; Breitkreutz B. J.; Stark C.; Liu G.; Ahn J.; Dewar-Darch D.; Reguly T.; Tang X.; Almeida R.; Qin Z. S.; Pawson T.; Gingras A. C.; Nesvizhskii A. I.; Tyers M. A global protein kinase and phosphatase interaction network in yeast. Science 328 (5981), 1043–6. [DOI] [PMC free article] [PubMed] [Google Scholar]
- Brehme M.; Hantschel O.; Colinge J.; Kaupe I.; Planyavsky M.; Kocher T.; Mechtler K.; Bennett K. L.; Superti-Furga G. Charting the molecular network of the drug target Bcr-Abl. Proc. Natl. Acad. Sci. U.S.A. 2009, 106 (18), 7414–9. [DOI] [PMC free article] [PubMed] [Google Scholar]
- Sowa M. E.; Bennett E. J.; Gygi S. P.; Harper J. W. Defining the human deubiquitinating enzyme interaction landscape. Cell 2009, 138 (2), 389–403. [DOI] [PMC free article] [PubMed] [Google Scholar]
- Gingras A.-C.; Gstaiger M.; Raught B.; Aebersold R. Analysis of protein complexes using mass spectrometry. Nat. Rev. Mol. Cell Biol. 2007, 8 (8), 645–54. [DOI] [PubMed] [Google Scholar]
- Kaake R. M.; Wang X.; Huang L. Profiling of protein interaction networks of protein complexes Using affinity purification and quantitative mass spectrometry. Mol. Cell. Proteomics 2010, 9, 1650–65. [DOI] [PMC free article] [PubMed] [Google Scholar]
- Wepf A.; Glatter T.; Schmidt A.; Aebersold R.; Gstaiger M. Quantitative interaction proteomics using mass spectrometry. Nat. Methods 2009, 6 (3), 203–5. [DOI] [PubMed] [Google Scholar]
- Hochleitner E. O.; Kastner B.; Frohlich T.; Schmidt A.; Luhrmann R.; Arnold G.; Lottspeich F. Protein stoichiometry of a multiprotein complex, the human spliceosomal U1 small nuclear ribonucleoprotein: absolute quantification using isotope-coded tags and mass spectrometry. J. Biol. Chem. 2005, 280 (4), 2536–42. [DOI] [PubMed] [Google Scholar]
- Kito K.; Ota K.; Fujita T.; Ito T. A synthetic protein approach toward accurate mass spectrometric quantification of component stoichiometry of multiprotein complexes. J. Proteome Res. 2007, 6 (2), 792–800. [DOI] [PubMed] [Google Scholar]
- Nanavati D.; Gucek M.; Milne J. L. S.; Subramaniam S.; Markey S. P. Stoichiometry and absolute quantification of proteins with mass spectrometry using fluorescent and isotope-labeled concatenated peptide standards. Mol. Cell. Proteomics 2008, 7 (2), 442–7. [DOI] [PubMed] [Google Scholar]
- Schmidt C.; Lenz C.; Grote M.; Luhrmann R.; Urlaub H. Determination of protein stoichiometry within protein complexes using absolute quantification and multiple reaction monitoring. Anal. Chem. 827, 2784–96. [DOI] [PubMed] [Google Scholar]
- Ross P. L.; Huang Y. N.; Marchese J. N.; Williamson B.; Parker K.; Hattan S.; Khainovski N.; Pillai S.; Dey S.; Daniels S.; Purkayastha S.; Juhasz P.; Martin S.; Bartlet-Jones M.; He F.; Jacobson A.; Pappin D. J. Multiplexed protein quantitation in Saccharomyces cerevisiae using amine-reactive isobaric tagging reagents. Mol. Cell. Proteomics 2004, 3 (12), 1154–69. [DOI] [PubMed] [Google Scholar]
- Thompson A.; Schafer J.; Kuhn K.; Kienle S.; Schwarz J.; Schmidt G.; Neumann T.; Johnstone R.; Mohammed A. K.; Hamon C. Tandem mass tags: a novel quantification strategy for comparative analysis of complex protein mixtures by MS/MS. Anal. Chem. 2003, 758, 1895–904. [DOI] [PubMed] [Google Scholar]
- DeSouza L. V.; Taylor A. M.; Li W.; Minkoff M. S.; Romaschin A. D.; Colgan T. J.; Siu K. W. Multiple reaction monitoring of mTRAQ-labeled peptides enables absolute quantification of endogenous levels of a potential cancer marker in cancerous and normal endometrial tissues. J. Proteome Res. 2008, 7 (8), 3525–34. [DOI] [PubMed] [Google Scholar]
- Labugger R.; Simpson J. A.; Quick M.; Brown H. A.; Collier C. E.; Neverova I.; Van Eyk J. E. Strategy for analysis of cardiac troponins in biological samples with a combination of affinity chromatography and mass spectrometry. Clin. Chem. 2003, 49 (6 Pt 1), 873–9. [DOI] [PubMed] [Google Scholar]
- Chrestensen C. A.; Schroeder M. J.; Shabanowitz J.; Hunt D. F.; Pelo J. W.; Worthington M. T.; Sturgill T. W. MAPKAP kinase 2 phosphorylates tristetraprolin on in vivo sites including Ser178, a site required for 14−3-3 binding. J. Biol. Chem. 2004, 279 (11), 10176–84. [DOI] [PubMed] [Google Scholar]
- Fonovic M.; Verhelst S. H.; Sorum M. T.; Bogyo M. Proteomics evaluation of chemically cleavable activity-based probes. Mol. Cell. Proteomics 2007, 6 (10), 1761–70. [DOI] [PubMed] [Google Scholar]
- Webb D. J.; Schroeder M. J.; Brame C. J.; Whitmore L.; Shabanowitz J.; Hunt D. F.; Horwitz A. R. Paxillin phosphorylation sites mapped by mass spectrometry. J. Cell Sci. 2005, 118 (Pt 21), 4925–9. [DOI] [PubMed] [Google Scholar]
- Speers A. E.; Cravatt B. F. A tandem orthogonal proteolysis strategy for high-content chemical proteomics. J. Am. Chem. Soc. 2005, 127 (28), 10018–9. [DOI] [PMC free article] [PubMed] [Google Scholar]
- Myers-Morales T.; Cowan C.; Gray M. E.; Wulff C. R.; Parker C. E.; Borchers C. H.; Straley S. C. A surface-focused biotinylation procedure identifies the Yersinia pestis catalase KatY as a membrane-associated but non-surface-located protein. Appl. Environ. Microbiol. 2007, 73 (18), 5750–9. [DOI] [PMC free article] [PubMed] [Google Scholar]
- Nasmyth K.; Peters J. M.; Uhlmann F. Splitting the chromosome: cutting the ties that bind sister chromatids. Science 2000, 288 (5470), 1379–85. [DOI] [PubMed] [Google Scholar]
- Peters J. M.; Tedeschi A.; Schmitz J. The cohesin complex and its roles in chromosome biology. Genes Dev. 2008, 22 (22), 3089–114. [DOI] [PubMed] [Google Scholar]
- Nasmyth K.; Haering C. H. Cohesin: its roles and mechanisms. Annu. Rev. Genet. 2009, 43, 525–58. [DOI] [PubMed] [Google Scholar]
- Sumara I.; Vorlaufer E.; Gieffers C.; Peters B. H.; Peters J. M. Characterization of vertebrate cohesin complexes and their regulation in prophase. J. Cell Biol. 2000, 151 (4), 749–62. [DOI] [PMC free article] [PubMed] [Google Scholar]
- Losada A.; Yokochi T.; Kobayashi R.; Hirano T. Identification and characterization of SA/Scc3p subunits in the Xenopus and human cohesin complexes. J. Cell Biol. 2000, 150 (3), 405–16. [DOI] [PMC free article] [PubMed] [Google Scholar]
- Holzmann J.; Pichler P.; Madalinski M.; Kurzbauer R.; Mechtler K. Stoichiometry determination of the MP1-p14 complex using a novel and cost-efficient method to produce an equimolar mixture of standard peptides. Anal. Chem. 2009, 81 (24), 10254–61. [DOI] [PubMed] [Google Scholar]
- Fu Z.; Larson K. A.; Chitta R. K.; Parker S. A.; Turk B. E.; Lawrence M. W.; Kaldis P.; Galaktionov K.; Cohn S. M.; Shabanowitz J.; Hunt D. F.; Sturgill T. W. Identification of yin-yang regulators and a phosphorylation consensus for male germ cell-associated kinase (MAK)-related kinase. Mol. Cell. Biol. 2006, 26 (22), 8639–54. [DOI] [PMC free article] [PubMed] [Google Scholar]
- Jessani N.; Niessen S.; Wei B. Q.; Nicolau M.; Humphrey M.; Ji Y.; Han W.; Noh D. Y.; Yates J. R. 3rd; Jeffrey S. S.; Cravatt B. F. A streamlined platform for high-content functional proteomics of primary human specimens. Nat. Methods 2005, 2 (9), 691–7. [DOI] [PubMed] [Google Scholar]
- Whiteaker J. R.; Zhao L.; Zhang H. Y.; Feng L. C.; Piening B. D.; Anderson L.; Paulovich A. G. Antibody-based enrichment of peptides on magnetic beads for mass-spectrometry-based quantification of serum biomarkers. Anal. Biochem. 2007, 362 (1), 44–54. [DOI] [PMC free article] [PubMed] [Google Scholar]
- Wienkoop S.; Larrainzar E.; Glinski M.; Gonzalez E. M.; Arrese-Igor C.; Weckwerth W. Absolute quantification of Medicago truncatula sucrose synthase isoforms and N-metabolism enzymes in symbiotic root nodules and the detection of novel nodule phosphoproteins by mass spectrometry. J. Exp. Bot. 2008, 59 (12), 3307–15. [DOI] [PMC free article] [PubMed] [Google Scholar]
- Kawakami H.; Ohtsuki S.; Kamiie J.; Suzuki T.; Abe T.; Terasaki T.. Simultaneous absolute quantification of 11 cytochrome P450 isoforms in human liver microsomes by liquid chromatography tandem mass spectrometry with In silico target peptide selection. J. Pharm. Sci., DOI: 10.1002/jps.22255. [DOI] [PubMed]
- Wildsmith K. R.; Han B.; Bateman R. J. Method for the simultaneous quantitation of apolipoprotein E isoforms using tandem mass spectrometry. Anal. Biochem. 2009, 395 (1), 116–8. [DOI] [PMC free article] [PubMed] [Google Scholar]
- Fallon J. K.; Harbourt D. E.; Maleki S. H.; Kessler F. K.; Ritter J. K.; Smith P. C. Absolute quantification of human uridine-diphosphate glucuronosyl transferase (UGT) enzyme isoforms 1A1 and 1A6 by tandem LC-MS. Drug Metab. Lett. 2008, 2 (3), 210–22. [DOI] [PubMed] [Google Scholar]
- Gassmann M.; Grenacher B.; Rohde B.; Vogel J. Quantifying Western blots: pitfalls of densitometry. Electrophoresis 2009, 30 (11), 1845–55. [DOI] [PubMed] [Google Scholar]
Associated Data
This section collects any data citations, data availability statements, or supplementary materials included in this article.