Abstract
The M3 muscarinic acetylcholine receptor (M3R) regulates many fundamental physiological functions. To identify novel M3R-interacting proteins, we used a recently developed yeast two-hybrid screen (split ubiquitin method) to detect interactions among membrane proteins. This screen led to the identification of many novel M3R-associated proteins, including the putative membrane protein transmembrane protein 147 (Tmem147). The amino acid sequence of Tmem147 is highly conserved among mammals, but its physiological roles are unknown at present. We initially demonstrated that Tmem147 could be coimmunoprecipitated with M3Rs in cotransfected mammalian cells (COS-7 cells). Confocal imaging studies showed that Tmem147 was localized to endoplasmic reticulum (ER) membranes and that the Tmem147/M3R interaction occurred in the ER of cotransfected COS-7 cells, resulting in impaired trafficking of the M3R to the cell surface. To study the role of Tmem147 in modulating M3R function in a more physiologically relevant setting, we carried out studies with H508 human colon cancer cells that endogenously express M3Rs and Tmem147. Treatment of H508 cells with carbachol, a hydrolytically stable acetylcholine analog, promoted H508 cell proliferation and activation of the mitogenic kinase, p90RSK. Small interfering RNA-mediated knockdown of Tmem147 expression significantly augmented the stimulatory effects of carbachol on H508 cell proliferation and p90RSK activation. These effects were associated with an increase in the density of cell surface M3Rs. Our data clearly indicate that Tmem147 represents a potent negative regulator of M3R function, most likely by interacting with M3Rs in an intracellular compartment (ER). These findings may lead to new strategies aimed at modulating M3R activity for therapeutic purposes.
Introduction
The M3 muscarinic acetylcholine receptor (M3R) is a prototypic member of the superfamily of class I GPCRs (Wess 1996). After activation by muscarinic agonists, the M3R selectively activates G proteins of the Gq family (Wess 1996). Peripheral M3Rs play a key role in mediating the stimulatory actions of acetylcholine on smooth muscle and glandular tissues (Caulfield and Birdsall, 1998; Eglen, 2005; Wess et al., 2007). It is noteworthy that recent studies with M3R mutant mice suggest that the M3R represents a potential novel target for the treatment of several major pathophysiological conditions, including type 2 diabetes (Gautam et al., 2006), colon cancer (Raufman et al., 2008), growth hormone deficiency (Gautam et al., 2009), and osteoporosis (Shi et al., 2010).
Unfortunately, muscarinic ligands that can activate or block the M3R with a high degree of selectivity are not available at present (Caulfield and Birdsall, 1998; Eglen, 2005; Wess et al., 2007). Moreover, because M3Rs are involved in many physiological functions, the potential use of M3R-selective ligands for therapeutic purposes is likely to be associated with significant side effects. We therefore initiated a new line of research to identify M3R-interacting proteins that modulate M3R expression and/or function. We speculated that this approach might eventually lead to new strategies aimed at modulating M3R function for therapeutic purposes.
Conventional yeast two-hybrid (YTH) screening approaches have identified many GPCR-interacting proteins (Ritter and Hall, 2009; Bockaert et al., 2010). The use of traditional YTH technologies requires that the analyzed proteins are expressed in the nucleus. However, because full-length GPCRs usually require post-translational modifications, such as glycosylation or disulfide bond formation, for proper folding, the nucleus is an unfavorable environment for identifying GPCR-interacting proteins. Furthermore, GPCRs and other transmembrane proteins tend to form aggregates in a nonmembrane environment. To circumvent these difficulties, traditional YTH approaches usually use soluble GPCR fragments, such as the cytosolic C-terminal domain or various intracellular loop regions. It is therefore likely that many GPCR-interacting proteins that require the presence of membrane-embedded full-length GPCRs for high-affinity binding remained unidentified in conventional YTH screens.
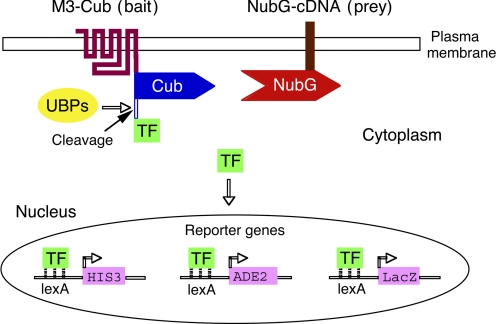
In the present study, we used the split-ubiquitin membrane-based yeast two-hybrid (MbYTH) screen to identify novel M3R-interacting proteins (Stagljar and Fields, 2002; Iyer et al., 2005; Kittanakom et al., 2009). This system offers the great advantage that it does not require nuclear localization of the two interacting proteins to detect protein-protein interactions, as is the case with classic YTH approaches. This screening strategy depends on the association of the N- and C-terminal halves of ubiquitin (referred to as Nub and Cub, respectively), resulting in the release of an artificial transcription factor fused to the C terminus of Cub by ubiquitin-specific proteases (Fig. 1). The transcription factor then enters the nucleus, causing the activation of specific reporter genes (HIS3, ADE2, and LacZ; Fig. 1). Specifically, we used this system to screen a human brain cDNA library for proteins that can interact with the full-length rat M3R in yeast (strain name: NMY51; Dualsystems Biotech AG, Schlieren, Switzerland). For this work, we used a modified version of the M3R (M3R-Cub) that contained the C-terminal Cub sequence followed by an artificial transcription factor as the bait. The cDNA library was constructed in a fashion such that all encoded proteins contained the Nub sequence at their N termini. In this system, proteins that are able to interact with the M3R-Cub fusion protein will lead to the association of Nub and Cub, triggering the release of the artificial transcription factor from M3R-Cub.
Fig. 1.
Scheme of the MbYTH screen used in the present study. To obtain a bait for the MbYTH screen, we first generated a modified version of the rat M3R (M3-Cub) fused at its C terminus to the Cub domain and an artificial transcription factor (TF) (Stagljar and Fields, 2002; Iyer et al., 2005; Kittanakom et al., 2009). Potential M3-Cub-interacting proteins (preys) were expressed by a human brain cDNA library coding for proteins containing an N-terminal Nub tag. The prey can be a cytosolic protein or a membrane protein with an N terminus that is located in the cytoplasm. To decrease the likelihood of spontaneous interactions between the Nub and Cub domains, an Ile→Gly point mutation was introduced into the Nub domain (NubG) (NubG Stagljar and Fields, 2002; Iyer et al., 2005; Kittanakom et al., 2009). As a result, NubG will only efficiently interact with Cub when the two proteins to which the two tags are attached interact with each other, resulting in the formation of a NubG-Cub complex. This complex is recognized by ubiquitin-specific proteases (UBPs), which release the artificial TF from the M3-Cub construct. The TF then enters the nucleus via diffusion and binds to the lexA-binding sites upstream of the HIS3, ADE2, and LacZ reporter genes. Activation of the HIS3 gene allows for yeast growth in histidine-deficient media. The LacZ reporter provides for the colorimetric detection of Gal4p activity.
An Ile→Gly point mutation in the Nub domain (NubI→NubG) greatly reduces the affinity of the Nub/Cub interaction such that the two protein fragments will no longer spontaneously interact (Iyer et al., 2005; Kittanakom et al., 2009). However, the interaction of the bait (attached to Cub) and the prey (attached to NubG) proteins allows the reconstitution of the two halves. The successful interaction between bait and prey proteins can be assayed by monitoring yeast growth in histidine-deficient media or by using a colorimetric test for the expression of β-galactosidase (Fig. 1).
Using this strategy, we identified many novel M3R-associated proteins, including transmembrane protein 147 (Tmem147), an ER resident protein of unknown biological function. Biochemical and pharmacological studies demonstrated that Tmem147 acts as a potent negative regulator of M3R function, most likely by interfering with M3R trafficking to the cell surface. Our data suggest that Tmem147 and other M3R-associated proteins may represent novel targets for modulating M3R activity for the treatment of various human diseases, including colon cancer.
Materials and Methods
Mammalian Expression Plasmids
Plasmids coding for the human M1 and M3 muscarinic receptors containing an N-terminal string of three hemagglutinin (HA) epitope tags [vector, pcDNA3.1(+)] were obtained from the Missouri S&T cDNA Resource Center (http://www.cdna.org). The mammalian expression plasmid coding for the human V2 vasopressin receptor carrying an N-terminal HA tag has been described previously (Schoneberg et al., 1996). The human Tmem147 cDNA in the pOTB7 vector (accession number NM_032635.2) was obtained from the American Type Culture Collection (Manassas, VA). This construct was originally generated by the I.M.A.G.E. Consortium/Mammalian Gene Collection. The Tmem147 coding sequence was subcloned into the pcDNA3.1(−) vector, and a FLAG epitope tag (DYKDDDDK) was inserted after the methionine start codon by using standard PCR mutagenesis techniques. The coding sequences of all constructs were verified by sequencing.
Yeast
Expression Plasmids.
The rat M3R coding sequence containing an N-terminal HA tag (Schöneberg et al., 1995) was subcloned into the pAMBV4 plasmid (Dualsystems Biotech). To generate the M3-Cub construct, overlapping PCR was used to fuse the last amino acid of the M3R coding sequence in frame with the Cub portion of the pAMBV4 plasmid.
Liquid Growth Bioassay.
For radioligand binding and functional studies, the M3R-Cub coding sequence was subcloned into the p416GPD plasmid (Mumberg et al., 1995; Erlenbach et al., 2001) via standard subcloning techniques. A p416GPD-based plasmid coding for the full-length rat M3R (without the Cub portion) has been generated previously (Erlenbach et al., 2001). The two plasmids were transformed into the MPY578q5 yeast strain (Pausch et al., 1998; Erlenbach et al., 2001). This strain contains a genetically modified G protein α-subunit (Gpa1p) in which the last five amino acids of Gpa1p (KIGII) are replaced with the homologous mammalian Gαq (EYNLV) sequence, resulting in agonist-stimulated M3R/G protein coupling and yeast growth in selective media. Overnight yeast cultures were diluted to 105 cells/ml in synthetic complete medium lacking histidine and uracil and containing 5 mM 3-amino-1,2,4-triazole (3-AT). Yeast growth was monitored by recording increases in absorbance at 630 nm in the presence of increasing concentrations of carbachol. Concentration-response curves were analyzed using GraphPad Prism 4.0 (GraphPad Software Inc., San Diego, CA).
Isolation of Crude Membranes and Radioligand Binding Assays.
Crude yeast membrane preparations were prepared from fresh 2-L yeast cultures using a glass bead method described previously (Erlenbach et al., 2001). N-[3H]Methylscopolamine ([3H]NMS) (79–83 Ci/mmol; PerkinElmer Life and Analytical Sciences, Waltham, MA) saturation binding assays were carried out using yeast membrane homogenates (250 μg of protein/tube) as described previously (Erlenbach et al., 2001). In brief, the binding buffer consisted of 25 mM phosphate buffer, pH 7.4, containing 5 mM MgCl2. Binding reactions were carried out for 3 h at 25°C in a 1-ml volume. Six different concentrations of [3H]NMS were used. Nonspecific binding was determined in the presence of 10 μM atropine. Radioligand binding data were analyzed using GraphPad Prism 4.0.
COS-7 Cells
Culture and Transient Transfection.
COS-7 cells were maintained in Dulbecco's modified Eagle's medium supplemented with 10% fetal bovine serum (FBS), 2 mM l-glutamine, 100 U/ml penicillin, and 100 μg/ml streptomycin at 37°C in a humidified 5% CO2 incubator. Approximately 24 h before transfection, ∼106 cells were seeded into 100-mm dishes. Cells were transfected with 4 μg of plasmid DNA per dish. In cotransfection experiments, 2 μg of each plasmid was used. Transfections were carried out using Lipofectamine Plus reagent according to the manufacturer's instructions (Invitrogen, Carlsbad, CA). Cells were collected 48 h after transfection.
Calcium Assay.
We used FLIPR technology (Molecular Devices, Sunnyvale, CA) to measure carbachol-mediated increases in intracellular calcium levels using transiently transfected COS-7 cells. Assays were carried out in duplicate in 96-well plates, as described in detail previously (Scarselli et al., 2007). Emax and EC50 values were obtained from carbachol concentration-response curves analyzed by using GraphPad Prism 4.0 software.
Confocal Microscopy and Antibodies.
COS-7 cells were transiently transfected with plasmid DNA, as described above. Approximately 24 h after transfection, cells were fixed with 2% paraformaldehyde for 10 min and then washed with phosphate-buffered saline (PBS) containing 10% FBS. All studies were carried out with cells that had been permeabilized with 0.2% saponin. To facilitate the detection of the M3R protein, we used a plasmid coding for a modified version of the human M3R containing three N-terminal HA epitope tags (M3R-HA). To visualize the expression of Tmem147, we generated a human Tmem147 construct with an N-terminal FLAG tag (Tmem147-FLAG). Expression of the M3R-HA protein was detected with a mouse anti-HA monoclonal antibody (16b12, IgG1; Covance, Princeton, NJ). The Tmem147-FLAG protein was visualized using a rabbit polyclonal anti-FLAG antibody (Sigma-Aldrich, St. Louis, MO). After extensive washing, Alexa-conjugated fluorescent secondary antibodies [goat anti-mouse (Alexa-488) or goat anti-rabbit (Alexa-594)] were used (Invitrogen). To determine the intracellular localization of Tmem147, different marker proteins were used. The mouse monoclonal GM130 and EEA1 antibodies (BD Biosciences, San Jose, CA) were used to stain the Golgi complex and early endosomes, respectively. The pDsRed2-ER plasmid (a kind gift from Dr. David Sibley, National Institutes of Health, Bethesda, MD) served to visualize the ER (Free et al., 2007). All images were obtained using a 510 LSM confocal microscope (Carl Zeiss GmbH, Jena, Germany) with a 63 × 1.3 numerical aperture PlanApo objective (for experimental details, see Scarselli and Donaldson, 2009).
Coimmunoprecipitation Studies.
COS-7 cells that had been cotransfected with the M3R-HA and Tmem147-FLAG constructs were collected 48 h after transfection by scraping with ice-cold PBS and centrifugation for 10 min at 4°C at 1000g. Cells from one 100-mm plate were resuspended in 1 ml of solubilization buffer (50 mM HEPES, 1 mM EDTA, 10% glycerol, 1% Triton X-100, 150 mM NaCl, 50 mM NaF, 40 mM sodium pyrophosphate, and Roche complete protease inhibitor cocktail, pH 7.4) for 2 h on a rock-and-roll shaker at 4°C. Then, insoluble material was separated by centrifugation at 20,000g for 30 min at 4°C. Samples were then precleared with 20 μl of protein A agarose (Santa Cruz Biotechnology, Santa Cruz, CA) for 1 h on a rock-and-roll shaker at 4°C and separated by centrifugation at 20,000g for 5 min at 4°C. In the next step, 20 μl of agarose-conjugated mouse anti-HA monoclonal antibody (clone HA-7; Sigma-Aldrich) or 2 μl of rabbit anti-FLAG polyclonal antibody (Sigma-Aldrich) was added to the sample and incubated overnight on a rock-and-roll shaker at 4°C. On the next day, 20 μl of protein A agarose was added to the samples treated with the anti-FLAG antibody, followed by a 1-h incubation on a rock-and-roll shaker at 4°C. To collect immunoprecipitated products, samples were centrifuged at maximum speed in an Eppendorf 5417R tabletop centrifuge (Eppendorf North America, New York, NY) at 4°C and washed three times with 1 ml of solubilization buffer containing 200 mM NaCl and once with Tris-EDTA, pH 7.4. Then, 45 μl of 2× NuPAGE LDS sample buffer was added to the agarose beads, followed by a 30-min incubation at 50°C. Samples were then quickly vortexed and centrifuged at maximum speed for 5 min, and dithiothreitol was added to a final concentration of 10 mM. Samples were run on NuPAGE 4 to 12% Bis-Tris gels with MOPS SDS running buffer (Invitrogen). Proteins were transferred onto nitrocellulose membranes using NuPAGE transfer buffer (Invitrogen). Membranes were blocked with 5% milk and first probed with either goat anti-M3R polyclonal antibody (C-20; Santa Cruz Biotechnology) or rabbit polyclonal anti-FLAG antibody (Sigma-Aldrich), followed by incubation with donkey anti-goat IgG-HRP (1:10,000; Santa Cruz Biotechnology) or donkey anti-rabbit IgG-HRP (1:10,000; GE Healthcare, Chalfont St. Giles, Buckinghamshire, UK) secondary antibody, respectively. Immunoreactive bands were detected using SuperSignal West Pico Chemiluminescent Substrate and CL-XPosure Film (Pierce Chemical, Rockford, IL).
H508 Cells
Culture and siRNA Treatment.
H508 human colon cancer cells (American Type Culture Collection) were grown in T175 flasks (Costar; Corning Life Science, Lowell, MA) in RPMI 1640 medium (Invitrogen) containing 10% FBS at 37°C in a humidified 5% CO2 incubator. siRNA was introduced into H508 cells via nucleofection when the cells were approximately 75 to 80% confluent. The following siRNAs were used (Ambion, Austin, TX): scrambled negative control siRNA, Tmem147 siRNA, or human M3R siRNA. Cell pellets were resuspended according to the manufacturer's instructions (Amaxa Biosystems, Gaithersburg, MD), and ∼1 to 2 × 10⁶ cells were placed into tubes containing 5 μl of Tmem147 siRNA or control siRNA (20 μM each). The cells were then placed into the nucleofection vials and electroporated using program A-23 of the Nucleofector II device and the Cell Line Nucleofector Kit V according to the manufacturer's instructions (Amaxa Biosystems). Electroporated cells were immediately placed into 12-well plates (Costar; Corning) for binding or six-well plates (Costar; Corning) for Western blotting experiments, respectively. For cell proliferation assays, electroporated cells were seeded into 96-well plates (Costar; Corning). Approximately 24 h after electroporation, H508 cells were washed with PBS, and the medium was replaced with RPMI 1640 medium containing 100 μM carbachol. After 3 days of culture, cells received fresh medium (RPMI 1640 containing 100 μM carbachol) and were cultured for 2 more days. Experiments were carried out 3 to 5 days after nucleofection.
Real-Time qRT-PCR Studies.
Three to 5 days after nucleofection with siRNAs, total RNA was extracted from H508 cells using the QIAGEN RNeasy kit as per manufacturer's instructions (QIAGEN, Valencia, CA). RNA (∼1 μg) was reverse-transcribed using Superscript III First-strand Synthesis SuperMix for qRT-PCR according to the manufacturer's instructions (Invitrogen). qPCR was accomplished on a 7900 HT Fast Real-Time PCR machine (Applied Biosystems, Foster City, CA) using SYBR Green PCR Master Mix (Applied Biosystems). The following primers were used: Tmem147 (human): forward, 5′-tacaacgccttctggaaatgc; reverse, 5′-ccaatgaagtcatagatgc; M3R (human): forward, 5′-atcggtctggcttgggtc; reverse, 5′-cccggaggcacagttctc; and glyceraldehyde-3-phosphate dehydrogenase (internal control): forward, 5′-ccccatggtgtctgagcg; reverse, 5′- cgacagtcagccgcatctt. qPCR experiments were carried out as described in detail by Cheng et al. (2007).
To monitor human M1 to M5 muscarinic receptor transcript levels in H508 cells, we also carried out qRT-PCR studies with RNA prepared from H508 cells that had not been treated with siRNA. For these studies, we used the following primer pairs: M1: forward, 5′-gggcagtgctacatccagttcc; reverse, 5′-cgtgctcggttctctgtctccc; M2: forward, 5′-catatcccgagccagcaagagc; reverse, 5′-gaggcaacagcactgactgagg; M3: forward, 5′-cgagacgagagccatctactcc; reverse, 5′-gaccagggacatccttttccgc; M4: forward, 5′-actgtcgtgggcaacatcctgg; reverse, 5′-cttggtgacgcagaagtagcgg; and M5: forward, 5′-acctgctcagcttagcctgtgc; reverse, 5′-tggaactgtccgcttcccaacc (GenBank accession numbers: M1, AF498915; M2, AF498916; M3, AF498917; M4, AF498918; and M5, AF498919).
Proliferation Assay.
The proliferation of H508 cells was determined using the sulforhodamine B colorimetric assay, as described in detail previously (Skehan et al., 1990; Cheng et al., 2007). After nucleofection, H508 cells were seeded into 96-well plates (∼20,000 cells/well; Corning Life Sciences) and then allowed to recover for 24 h in RPMI 1640 medium containing 10% FBS. The medium was then replaced with serum-free RPMI 1640 medium. Cells were allowed to grow for 5 more days at 37°C in a 5% CO2/95% air atmosphere, either in the absence or presence of 100 μM carbachol. After this 5-day growth period, cells were fixed by adding 50% trichloroacetic acid (TCA) to the growth medium (final concentration of TCA, 10%), incubated for 1 h at 4°C, and then washed five times with distilled water to remove the TCA. Cells were stained for 30 min at room temperature with 50 μl of 0.4% (w/v) sulforhodamine B dissolved in 1% acetic acid and then rinsed four times with 200 μl of 1% acetic acid. Protein-bound dye was extracted with 100 μl of 10 mM Tris for 5 to 10 min on a plate shaker. Color development (optical density) was measured at wavelengths between 540 and 590 nm on a BioTek ELx808 spectrophotometer (BioTek Instruments, Winooski, VT).
Determination of Cell Surface and Total Cellular Muscarinic Receptor Levels.
H508 cells were cultured as described in the previous paragraph. Five days after siRNA treatment, intact H508 cells grown in 12-well plates in the presence of carbachol (100 μM) were incubated with a saturating concentration (1 nM) of [3H]NMS, a hydrophilic muscarinic radioligand that only labels cell surface muscarinic receptors. To determine the levels of total cellular muscarinic receptors, we carried out analogous studies using a saturating concentration (1 nM) of [3H]quinuclidinyl benzilate ([3H]QNB; 50.5 Ci/mmol; PerkinElmer Life and Analytical Sciences), a membrane-permeable muscarinic radioligand. After two washes with binding buffer (25 mM phosphate buffer containing 5 mM MgCl2, pH 7.4), cells were incubated in 0.5 ml of binding buffer with 1 nM [3H]NMS for 90 min at 37°C. Nonspecific binding was measured in the presence of 1 μM atropine. After the 90-min incubation period, cells were washed three times with ice-cold PBS and scraped off the plates using 500 μl of PBS containing 1% Triton X-100. Ten milliliters of Hydrofluor scintillation cocktail (National Diagnostics, Manville, NJ) was then added to the samples, and radioactivity was counted on a Wallac WinSpectral 1414 liquid scintillation counter (PerkinElmer Life and Analytical Sciences). Protein concentrations were determined by using a Bradford assay kit (Pierce Chemical).
Western Blotting Studies.
Five days after siRNA treatment, intact H508 cells grown in six-well plates in the presence of carbachol (100 μM) were first washed and then incubated with 1 ml of RPMI 1640 medium at room temperature in presence or absence of 500 μM carbachol for 10 min. Cells were then scraped off the plates using 250 μl of Western blotting buffer (150 mM NaCl, 10 mM Tris HCl, 1% deoxycholate, 1% NP-40, 0.1% SDS, and 4 mM EDTA) in the presence of protease inhibitors (Complete Midi; Roche Diagnostics, Indianapolis, IN). Proteins were separated on 10% Tris-glycine gels (Sigma-Aldrich) using an SDS-based loading buffer (Quality Biological Inc., Gaithersburg, MD) and then blotted onto nitrocellulose membranes (0.45-μm pore size; Sigma-Aldrich). The phosphorylated (active) form of p90RSK (phospho-p90RSK) was detected via Western blotting using the phospho-p90RSK antibody from Cell Signaling Technology (Danvers, MA) as the primary antibody (1:1000 dilution). Binding of the primary antibody was detected using an HRP-linked secondary anti-rabbit IgG antibody (1:4000 dilution; Cell Signaling Technology). For control purposes, all blots were reprobed with a β-actin antibody (1:1000 dilution; Cell Signaling Technology). Bands were detected by the GeneGnome capture and analysis system (Syngene, Frederick, MD). Band intensities were quantified using the ImageJ program, and data were analyzed using GraphPad Prism 4.0.
RT-PCR Analysis of M3R and Tmem147 Expression in Different Mouse Tissues
cDNAs were prepared from different mouse tissues derived from C57BL/6NTac mice as described by Li et al. (2009). To detect M3R and Tmem147 transcripts, cDNAs were amplified via PCR using the following gene-specific primers pairs: M3R forward, 5′-ACCTGTTCACGACCTACATCA; M3R reverse, 5′-AGTGAGTGGCCTGGTAATAGAAA; Tmem147 forward, 5′-CCACACCTTCCGGCCTGCTG; and Tmem147 reverse, 5′-GCCAAGGTGCTGAGGGCCAG. The PCR amplicon sizes were 158 (M3R) and 156 bp (Tmem147), respectively. The PCR cycling conditions were as follows: 95°C for 2 min followed by 33 cycles at 95°C for 30 s, 56°C for 60 s, and 72°C for 60 s. PCRs were carried out in a final volume of 30 μl of containing 3 μl of the RT reaction product (corresponding to ∼0.1 mg of RNA), 3 μl of GeneAmp 10× PCR buffer (Applied Biosystems), 1 mM each dNTP, 1.3 μM each PCR primer, and 1 unit of recombinant AmpliTaq Gold (Applied Biosystems).
Results
MbYTH Bait Selection and Characterization.
In this study, we used MbYTH to identify novel M3R-interacting proteins. We first cloned the rat M3R coding sequence into the pAMBV4 bait vector (Dualsystems Biotech). The resulting yeast expression plasmid codes for a modified version of the M3R receptor, in which the C terminus of the receptor is fused to the C-terminal portion of ubiquitin (Cub) followed by an artificial transcription factor (Fig. 1). For the sake of simplicity, we refer to this “bait receptor” as M3-Cub in the following. The pAMBV4-M3-Cub plasmid was then transformed into the NMY51 yeast strain (Dualsystems Biotech). [3H]NMS saturation binding studies carried out with yeast membranes demonstrated that the M3-Cub protein was able to bind [3H]NMS with high affinity (pKD = 9.50 ± 0.49; Bmax = 7.4 ± 2.4 fmol/mg; n = 3).
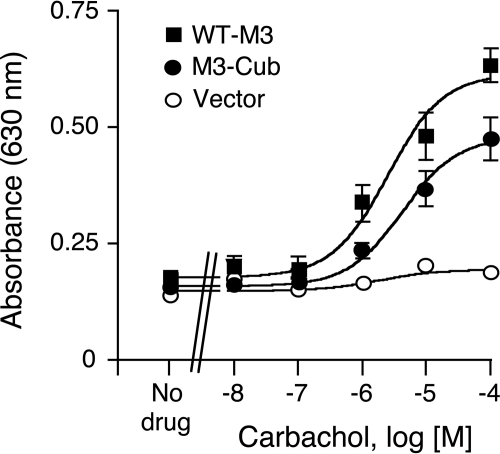
To confirm that the M3-Cub receptor was functional in yeast, we next cloned the M3-Cub coding sequence into the p416GPD yeast expression vector (Mumberg et al., 1995; Erlenbach et al., 2001). The resulting plasmid (p416GPD-M3-Cub) was then transformed into the MPY578q5 yeast strain (Pausch et al., 1998; Erlenbach et al., 2001). For comparison, a p416GPD-based plasmid coding for the wild-type (WT) rat M3R (WT-M3) was also transformed into the same yeast strain. Because of several genetic modifications, the MPY578q5 yeast strain requires productive M3R/G protein coupling for growth in histidine-deficient media (see Materials and Methods for details; Erlenbach et al., 2001). It is noteworthy that the MPY578q5 strain harbors a mutant version of the GPA1 gene coding for a hybrid yeast/mammalian G protein α subunit, in which the last five amino acids of Gpa1p were replaced with the corresponding mammalian Gαq residues (Erlenbach et al., 2001). To monitor muscarinic agonist (carbachol)-induced M3R activation, we measured yeast growth in histidine-deficient media (“yeast liquid growth bioassay”; Fig. 2). Carbachol treatment resulted in concentration-dependent growth of both the M3-Cub- and WT-M3-expressing yeast strains (Fig. 2). No growth response was observed with a control yeast strain transformed with vector DNA (p416GPD; Fig. 2). Carbachol stimulated the growth of M3-Cub- and WT-M3-expressing yeast strains with similar potency (carbachol EC50 values: M3-Cub, 4.5 ± 0.8 μM; WT-M3, 4.9 ± 2.4 μM; n = 3), indicating that the C-terminal Cub tag did not interfere with M3R function in yeast. Taken together, the results of the radioligand binding and functional assays clearly indicate that the M3-Cub receptor is functional in yeast, indicative of proper receptor folding.
Fig. 2.
Carbachol-induced yeast growth mediated by activation of WT-M3 or M3-Cub receptors. The indicated receptors were expressed in the MPY578q5 yeast strain expressing a hybrid chimeric yeast/mammalian G protein α subunit (for details, see Materials and Methods). Yeast growth was measured by determining the absorbance at 630 nm, either in the absence or presence of increasing concentrations of the muscarinic agonist, carbachol. The curves shown are representative of three independent experiments, each carried out in triplicate. Data are given as means ± S.E.M.
Optimization of Screening Conditions.
We carried out a series of pilot experiments to optimize the conditions for the planned MbYTH screen (to reduce the number of false positives). The pAMBV4-M3-Cub plasmid coding for the M3-Cub bait was transformed into the NMY51 yeast strain, together with control plasmids coding for Alg5-NubI (positive control), Alg5-NubG (negative control), or pADL-Nx (empty vector). Alg5-NubI is a yeast membrane protein modified with a WT Nub tag. The NubI tag usually interacts spontaneously with any Cub-containing construct (Iyer et al., 2005; Kittanakom et al., 2009). The Nub portion of Alg5-NubG contains the Ile→Gly point mutation at position 13, reducing the affinity of the Nub tag for Cub (Iyer et al., 2005; Kittanakom et al., 2009). This mutant Nub tag will only interact with a Cub-containing bait when the two tags are brought into proximity through an interaction between the attached bait and prey proteins (Iyer et al., 2005; Kittanakom et al., 2009).
We initially plated the cotransformants on −Leu/−Trp plates to select for yeast clones containing both the Cub- and Nub-containing plasmids. We then monitored the growth of cotransformants in −Leu/−Trp/−His/−Ade media (the proper association of Nub and Cub fragments results in the activation of the HIS3 reporter gene and allows yeast growth in media lacking histidine; for details, see Materials and Methods). To suppress background growth, 3-AT (10 or 25 mM), an agent that blocks one of the key enzymes involved in histidine biosynthesis, was added to the medium.
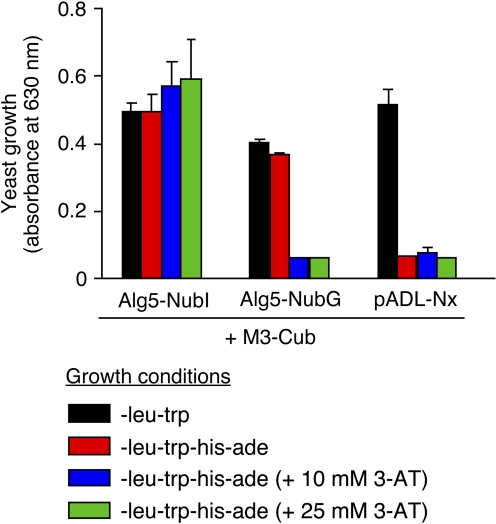
As expected, cotransformation of the M3-Cub construct with pADL-Nx vector DNA did not result in yeast growth in histidine-deficient media (Fig. 3). However, cotransformation of M3-Cub with Alg5-NubI allowed yeast growth under the same experimental conditions (independent of the absence or presence of 3-AT), indicating that the Cub portion of the M3-Cub fusion protein was folded properly. In contrast, M3-Cub was unable to interact with Alg5-NubG under high stringency conditions (10 or 25 mM 3-AT; Fig. 3). To minimize background growth (false negatives), we therefore decided to carry out the planned MbYTH screen in the presence of 25 mM 3-AT.
Fig. 3.
Yeast growth assay used to establish optimal conditions for the planned MbYTH screen. The pAMBV4-M3-Cub plasmid was transformed into the NMY51 yeast strain, together with the indicated control plasmids [Alg5-NubI, Alg5-NubG, or pADL-Nx (empty vector)]. Yeast growth was measured by determining the absorbance at 630 nm. The compositions of the media used are indicated in the inset. Yeast growth was determined in the absence or presence of the indicated concentrations of 3-AT, an agent that blocks one of the key enzymes involved in histidine biosynthesis. The data shown are representative of three independent experiments, each carried out in triplicate.
Identification of Candidate Proteins Able to Interact with M3-Cub in Yeast.
Because the M3R is widely expressed throughout the brain, we used the M3-Cub construct as a bait to screen the NX031 human adult brain cDNA library for M3R-interacting proteins (complexity of the library: ∼2 × 10⁶ independent clones; Dualsystems Biotech). This cDNA library was constructed in a fashion that all encoded proteins contained an N-terminal NubG tag. We transformed the NX031 library with the M3-Cub construct and then screened 2.4 × 10⁶ transformants for growth on selective media (−Leu/−Trp/−His/−Ade) containing 25 mM 3-AT. This screen led to the identification of 68 potential M3R-interacting proteins, including proteins known to associate with the M3R such as calmodulin 2 (Lucas et al., 2006) or ARF1 (Mitchell et al., 2003). The identity of the Nub-containing proteins was verified by DNA sequencing, followed by BLAST analysis. The recovered proteins were classified into eight categories (for details, see Supplemental Table 1).
In a series of control experiments, we cotransformed all recovered Nub clones into the NMY51 yeast strain with either M3-Cub or Alg5-Cub. The cotransformants were then assayed for growth in selective media and their ability to induce color formation in a β-galactosidase assay. This analysis confirmed that all recovered Nub clones were able to interact with the M3-Cub protein in yeast. However, none of the Nub proteins was capable of interacting with Alg5-Cub, indicative of the selectivity of the interaction of M3-Cub with the recovered Nub proteins.
It is noteworthy that one full-length protein, Tmem147 (alternative name, NIFIE14; accession number NM_032635.2), was recovered 11 independent times. Tmem147 is predicted to represent an integral membrane protein that spans the membrane six or seven times (HHMTOP or TMHMM programs). It consists of 224 amino acids and has a calculated molecular mass of 26.2 kDa. The amino acid sequence of Tmem147 is highly conserved among mammalian species (the human, rat, bovine, and mouse sequences are 99% identical; see Supplemental Fig. S1 for details). The UniGene database for EST profiles indicates that Tmem147 is widely expressed throughout the body. The function of Tmem147 remains unknown at present. We therefore decided to carry out studies with mammalian cells to examine the potential effect of Tmem147 on regulating M3R expression and function.
Tmem147 Interacts With the M3R in Cotransfected Mammalian Cells.
We first wanted to verify that the M3R/Tmem147 interaction also occurred in mammalian cells. Because it was difficult to detect M3R/Tmem147 complexes in physiological tissues because of the lack of suitable antibodies, we carried out coimmunoprecipitation studies using cotransfected COS-7 cells. To facilitate these experiments, we generated a human Tmem147 construct with an N-terminal FLAG tag (Tmem147-FLAG) and used a modified version of the human M3R containing three N-terminal HA epitope tags (M3R-HA).
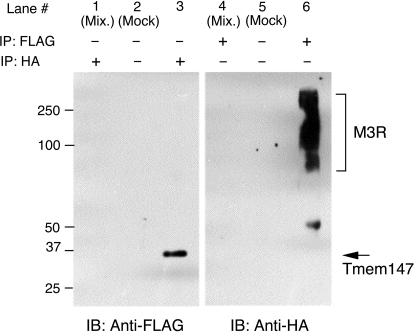
We first prepared membranes from COS-7 cells cotransfected with the Tmem147-FLAG and M3R-HA constructs. After membrane lysis, the M3R-HA was immunoprecipitated with an anti-HA antibody, followed by Western blotting studies using an anti-FLAG antibody (Fig. 4, left). The anti-FLAG antibody detected a single immunoreactive band, corresponding in size to Tmem147-FLAG (∼30 kDa). In a reciprocal fashion, Tmem147-FLAG was immunoprecipitated with an anti-FLAG antibody, followed by Western blotting studies using an anti-HA antibody to identify Tmem147-associated M3Rs (Fig. 4, right). The anti-HA antibody detected a broad spectrum of immunoreactive species ranging in size from ∼70 to >250 kDa. The estimated molecular mass of the M3R-HA protein is ∼70 kDa. However, the M3R is known to undergo heterogeneous glycosylation at five N-terminal asparagine residues (Wess, 1996) and, like most other GPCRs, can form dimeric or oligomeric complexes (Zeng and Wess, 1999; Goin and Nathanson, 2006). These factors are most likely responsible for the rather broad spectrum of M3R bands detected by the anti-HA antibody. The Tmem147-FLAG and M3R-HA bands were not observed in mock coimmunoprecipitation experiments in which cell lysates were incubated with protein A agarose only (in the absence of antibodies) or in control experiments in which membranes prepared from COS-7 cells expressing either Tmem147-FLAG or M3R-HA had been mixed (Fig. 4). The results of the coimmunoprecipitation studies strongly support the concept that Tmem147 interacts with the M3R in mammalian cells.
Fig. 4.
Coimmunoprecipitation of Tmem147 with M3Rs in cotransfected COS-7 cells. The Tmem147 construct that was used for coimmunoprecipitation studies contained an N-terminal FLAG epitope tag (Tmem147-FLAG). Likewise, the M3R construct used (human) contained three consecutive HA epitopes at its N terminus (M3R-HA). Membranes prepared from COS-7 cells that had been cotransfected with the two constructs were solubilized, and proteins were immunoprecipitated with the indicated antibodies. Immunoprecipitates were analyzed via Western blotting using an anti-FLAG (left) or an anti-HA antibody, respectively. Lanes 2, 3, 5, and 6 show the results obtained with cells coexpressing Tmem147-FLAG and M3R-HA. Lanes 1 and 4 show the results of control experiments in which membranes were prepared from COS-7 cells expressing either Tmem147-FLAG or M3R-HA and then mixed. In mock IP experiments, cell lysates were incubated with protein-A agarose in the absence of antibodies.
To examine whether Tmem147 can also bind to other muscarinic receptor subtypes or other class I GPCRs, we carried out analogous coimmunoprecipitation studies with COS-7 cells cotransfected with Tmem147-FLAG- and HA-tagged versions of the M1 muscarinic or the V2 vasopressin receptor subtypes. These studies demonstrated that Tmem147-FLAG could be coimmunoprecipitated with either of the two receptors (Supplemental Fig. S2), suggesting that Tmem147 is able to interact not only with the M3R but also with other class I GPCRs.
Tmem147 Is Found in the ER of Transfected COS-7 Cells.
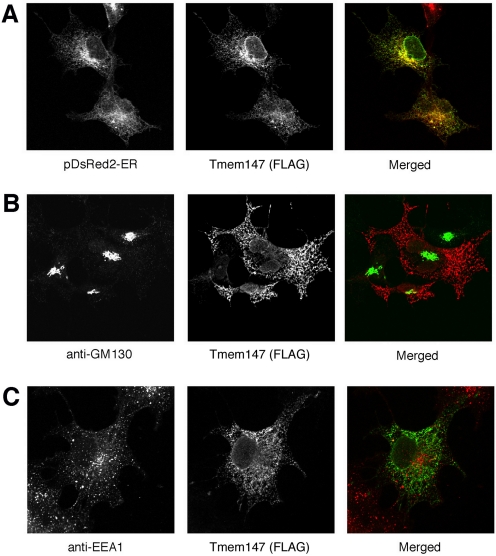
Because it was difficult to detect the expression of endogenous Tmem147 protein in cell lines or physiological tissues because of the lack of suitable antibodies, we studied the subcellular distribution of Tmem147-FLAG after transient expression in COS-7 cells. Confocal microscopic images showed that that Tmem147 was not found on the cell surface but was localized to ER membranes (Fig. 5A). Tmem147 was not present in the Golgi complex (Fig. 5B) or in early endosomes (Fig. 5C), as shown with organelle-specific marker proteins.
Fig. 5.
Tmem147 is found in the ER of transfected COS-7 cells. The subcellular localization of Tmem147 was studied via confocal microscopy using COS-7 cells transiently expressing Tmem147-FLAG. A, Tmem147 is localized to the ER (pDsRed2-ER represents an ER-specific marker) (Free et al., 2007). B and C, Tmem147 is not present in the Golgi (GM130 is a Golgi marker protein) or in early endosomes (EEA1 is a marker protein for early endosomes). All studies were carried out with cells permeabilized with 0.2% saponin. To visualize Tmem147-FLAG, Alexa-594- (red), or Alexa-488-conjugated (green) secondary antibodies were used in B and C, respectively (after incubation with a polyclonal anti-FLAG antibody). For experimental details, see Materials and Methods.
Tmem147 Causes Retention of the M3R in the ER of Cotransfected COS-7 Cells.
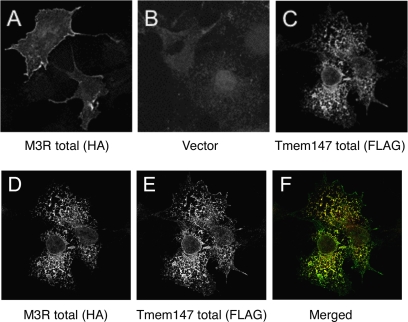
To examine the effect of Tmem147 on the subcellular distribution of the M3R, we carried out studies with COS-7 cells cotransfected with the M3R-HA and Tmem147-FLAG constructs. When expressed alone, the M3R-HA receptor was expressed predominantly on the cell surface, as studied via confocal microscopic analysis of permeabilized cells stained with an anti-HA antibody (Fig. 6A). In contrast, the Tmem147-FLAG protein could only be detected intracellularly, as observed by treating cells with an anti-FLAG antibody (Fig. 6C; also see Fig. 5). After coexpression of the two constructs (M3R-HA and Tmem147-FLAG), cell surface expression of the M3R-HA receptor was barely detectable, and the receptor protein was colocalized with Tmem147-FLAG in the ER (Fig. 6, D–F).
Fig. 6.
Effect of Tmem147 expression on the subcellular distribution of the M3R in cotransfected COS-7 Cells. The subcellular localization of the M3R-HA receptor, either expressed alone or coexpressed with Tmem147-FLAG was studied via confocal microscopy using transfected COS-7 cells. After fixation, cells were permeabilized with 0.2% saponin. A, transfection with the M3R-HA construct alone. Cells were stained with a monoclonal anti-HA antibody followed by incubation with a secondary antibody. Note the intense staining of the M3R-HA protein on the cell surface. B, transfection with vector DNA (pcDNA3.1; control). Cells were treated with the anti-HA antibody to reveal background staining. C, transfection with the Tmem147-FLAG construct alone. Tmem147-FLAG was visualized by using a polyclonal anti-FLAG antibody followed by incubation with a secondary antibody. Note that Tmem147 protein was retained intracellularly (in the ER; see Fig. 5). D to F, cotransfection of COS-7 cells with the M3R-HA and Tmem147-FLAG constructs. Cells were stained with the indicated antibodies. Note that cell surface expression of the M3R-HA receptor was barely visible in the presence of coexpressed Tmem147-FLAG (D) and that the two proteins were colocalized in the ER (D–F). For experimental details, see Materials and Methods.
Tmem147 Expression Impairs M3R Function in Cotransfected COS-7 Cells.
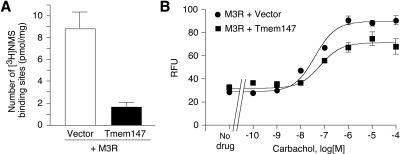
To examine the effect of Tmem147 expression on M3R function, we carried out additional studies using COS-7 cells cotransfected with M3R-HA and Tmem147 plasmid DNA (or vector DNA as a control). Consistent with the outcome of the M3R localization experiments, [3H]NMS saturation binding studies showed a pronounced reduction (by ∼75%) in M3R density after coexpression with Tmem147 (Fig. 7A). [3H]NMS binding affinities (pKD values) for the M3R were not significantly affected by coexpression with Tmem147: M3R + vector (control), 9.60 ± 0.22; and M3R + Tmem147, 9.98 ± 0.26 (n = 3).
Fig. 7.
Effect of Tmem147 on M3R expression levels and M3R-mediated calcium responses in cotransfected COS-7 cells. A, effect of Tmem147 expression on M3R receptor expression levels (Bmax), as determined in [3H]NMS saturation binding assays. B, effect of Tmem147 expression on M3R-mediated calcium responses. Carbachol-induced increases in intracellular calcium levels were measured by using FLIPR technology. All experiments were carried out using COS-7 cells that had been cotransfected with plasmids coding for the human M3R and Tmem147 (see Materials and Methods for details). Data are presented as means ± S.E.M. of three independent experiments carried out in duplicate. RFU, relative fluorescence units.
To assess the functional consequences of Tmem147 coexpression on M3R function, we measured carbachol-mediated increases in intracellular calcium levels in cotransfected COS-7 using FLIPR technology. Carbachol treatment resulted in concentration-dependent calcium responses in both control cells (cotransfected with M3R and vector DNA) and in cells coexpressing M3R and Tmem147 (Fig. 7B). However, M3R-mediated maximum responses (Emax values) were reduced by ∼20% in the presence of Tmem147 (p < 0.05; Fig. 7B).
Studies with H508 Human Colon Cancer Cells Endogenously Expressing M3Rs and Tmem147.
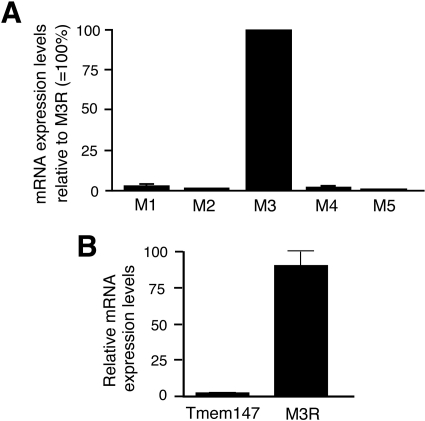
To study the effects of Tmem147 on M3R function in a more physiological setting, we used H508 human colon cancer cells as a model system. Frucht et al. (1999) demonstrated previously that H508 cells express significant numbers of endogenous M3Rs. Real-time qRT-PCR studies indicated that H508 cells almost exclusively express the M3R subtype (the four remaining muscarinic receptor subtypes are expressed only at very low levels; Fig. 8A).
Fig. 8.
Determination of gene expression levels in H508 cells using real-time qRT-PCR. A, M1 to M5 muscarinic receptor mRNA levels in H508 cells. Muscarinic receptor transcript levels were determined by real-time qRT-PCR using total RNA prepared from H508 cells. Data are expressed relative to M3R mRNA levels (100%). B, knockdown of Tmem147 expression after treatment of H508 cells with Tmem147 siRNA. Cells were treated with negative control siRNA or Tmem147 siRNA, as described under Materials and Methods. Data are expressed relative to mRNA levels observed with cells treated with negative control siRNA (100%). Primer sequences are given under Materials and Methods. Data are presented as means ± S.E.M. of three independent experiments carried out in triplicate.
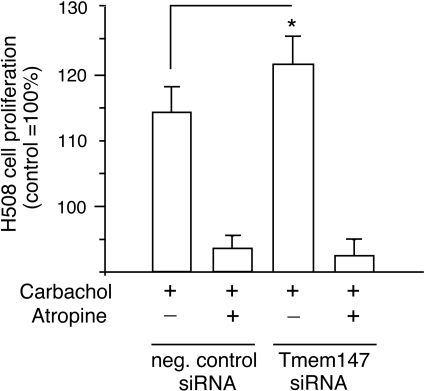
Several studies have shown that muscarinic agonists stimulate the proliferation of H508 cells, most likely by activation of the extracellular signal-regulated kinase pathway and/or transactivation of epidermal growth factor receptors (Frucht et al., 1999; Cheng et al., 2003; Xie et al., 2009; Cheng and Raufman; 2005). To study the potential effect of Tmem147 on M3R-mediated stimulation of H508 cell proliferation, we treated H508 cells with either control siRNA (scrambled siRNA; Ambion) or Tmem147 siRNA (Ambion). Then we incubated H508 cells for 5 days in the absence or presence of carbachol (100 μM) and determined cell growth by using a colorimetric assay (Frucht et al., 1999; Cheng et al., 2003; Xie et al., 2009; Cheng and Raufman; 2005). Under these experimental conditions, carbachol (100 μM) exerts a near-maximal effect on H508 cell proliferation (Frucht et al., 1999). Real-time qRT-PCR studies showed that treatment of H508 cells with Tmem147 siRNA virtually abolished Tmem147 mRNA expression (Fig. 8B). On the other hand, M3R mRNA levels remained unaffected after siRNA-mediated silencing of Tmem147 expression (Fig. 8B). As expected, carbachol treatment promoted the proliferation of H508 cells electroporated with control siRNA (∼15% increase in growth compared with cells not treated with carbachol; Fig. 9). It is noteworthy that this response was significantly more pronounced (p < 0.05) in H508 cells electroporated with Tmem147 siRNA (∼22% increase in growth compared with cells not treated with carbachol; Fig. 9). Carbachol-promoted H508 cell growth could be completely prevented by incubation of cells with atropine (1 μM; Fig. 9).
Fig. 9.
Effect of siRNA-mediated knock-down of Tmem147 expression on the M3R-mediated increase in H508 cell proliferation. Cells were treated with negative control siRNA or Tmem147 siRNA, as described in detail under Materials and Methods. Cells were grown for 5 days in the absence or presence of the muscarinic agonist carbachol (100 μM) either in the absence or presence of the muscarinic antagonist atropine (1 μM). Cell growth was determined by using a colorimetric assay (see Materials and Methods for details). In each individual experiment, cell growth observed with cells that had been treated with control siRNA and had not been exposed to carbachol was set equal to 100%. Results are expressed as means ± S.E.M. of four separate experiments (*, p < 0.05).
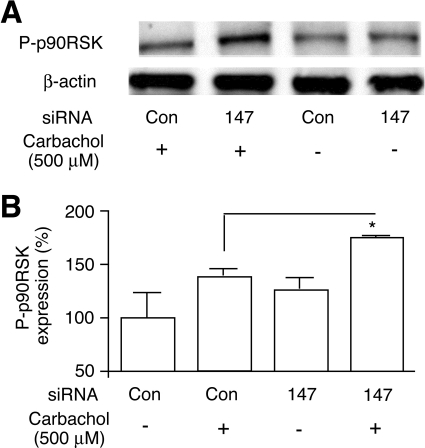
Stimulation of H508 cells with muscarinic agonists leads to the extracellular signal-regulated kinase 1/2-dependent phosphorylation and activation of p90RSK (Cheng et al., 2003; Cheng and Raufman; 2005), a nuclear response protein that represents a key regulator of gene expression and cell cycle progression (Anjum and Blenis, 2008). It is therefore likely that M3R-mediated activation of p90RSKis intimately linked to muscarinic agonist-induced H508 cell proliferation (Cheng et al., 2003; Cheng and Raufman; 2005). Consistent with previous reports, we found that carbachol (500 μM) treatment of H508 cells electroporated with control siRNA stimulated the phosphorylation of p90RSK (Fig. 10). It is noteworthy that carbachol-induced phosphorylation of p90RSK was significantly more pronounced in cells that had been treated with Tmem147 siRNA (p < 0.05; Fig. 10).
Fig. 10.
Effect of siRNA-mediated knock-down of Tmem147 expression in H508 cells on M3R-mediated increases in the expression of phosphorylated p90RSK (P-p90RSK). Cells were treated with negative control siRNA (Con) or Tmem147 siRNA (147) and grown in carbachol medium for 5 days, as described in detail under Materials and Methods. Cells were then acutely stimulated with 500 μM carbachol for 10 min. A, representative Western blot. B, summary of two or three separate immunoblotting experiments. P-p90RSK expression levels are expressed as means ± S.E.M. relative to the levels determined with cells that had been electroporated with negative control siRNA and had not been treated with 500 μM carbachol (100%; *, p < 0.05).
To examine the effect of siRNA-mediated knockdown of Tmem147 expression on cell surface M3R expression levels in H508 cells, we carried out [3H]NMS binding studies with intact H508 cells (note that [3H]NMS is unable to cross the plasma membrane). We found that siRNA-mediated silencing of Tmem147 expression led to a 1.99 (± 0.20)-fold increase (p < 0.05) in the number of cell surface M3Rs, compared with cells treated with control siRNA (number of [3H]NMS binding sites per microgram of H508 cell protein obtained with control samples: 1.21 ± 0.17 × 10⁶; n = 4; assays were carried out at the end of the 5-day incubation period with carbachol medium). To label both cell surface M3Rs and M3Rs located in intracellular compartments, we carried out analogous studies using [3H]QNB, a membrane-permeable muscarinic radioligand. Using control siRNA-treated cells, we found that [3H]QNB labeled ∼3- to 4-fold more M3Rs than [3H]NMS (number of [3H]QNB binding sites per microgram of H508 cell protein obtained with control samples: 4.10 ± 0.60 × 10⁶; n = 2), indicating that a major portion of M3Rs is retained intracellularly under the chosen experimental conditions. siRNA-mediated silencing of Tmem147 expression led to a 1.93 (± 0.16)-fold increase in the number of [3H]QNB binding sites, a value that was not significantly different from that found in the [3H]NMS binding studies (see above). These observations suggest that the increase in cell surface M3R expression observed after knockdown of Tmem147 expression is largely due to an increase in the total amount of correctly folded M3Rs and that the Tmem147/M3R interaction interferes with the proper folding of the receptor protein.
Coexpression of M3R and Tmem147 Transcripts in Several Mouse Tissues.
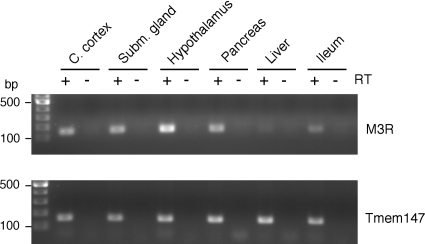
To examine whether Tmem147 transcripts could be detected in tissues where the M3R is known to be expressed physiologically, we subjected total RNA prepared from several mouse tissues to RT-PCR analysis. Using gene-specific primer pairs, we found that M3R and Tmem147 transcripts were coexpressed in all analyzed mouse tissues, including cerebral cortex, submandibular gland, hypothalamus, pancreas, liver, and ileum (Fig. 11).
Fig. 11.
Coexpression of M3R and Tmem147 transcripts in several mouse tissues. Total RNA was prepared from the indicated mouse tissues (C57BL/6NTac mice). RT-PCR studies were carried out as described under Materials and Methods using gene-specific primer pairs (M3R, top; Tmem147, bottom). The sizes of the PCR products were the following: M3R, 158 bp; and Tmem147, 156 bp. RT, reverse transcriptase; C. cortex, cerebral cortex; Subm. gland, submandibular gland.
Discussion
In this study, we used the full-length M3R as a bait in a split ubiquitin MbYTH screen to identify novel M3R-interacting proteins. This strategy led to the recovery of many proteins that were able to interact with the M3R in yeast. It is noteworthy that one full-length protein, Tmem147, was recovered 11 independent times in this screen. Tmem147 is an integral membrane protein of unknown function that is widely expressed in many peripheral and central tissues. The amino acid sequence of Tmem147 is highly conserved (∼99%) among mammals, suggesting that Tmem147 may have important physiological functions. Consistent with the M3R/Tmem147 interaction observed in yeast, we demonstrated that M3R and Tmem147 transcripts were coexpressed in several mouse tissues in which the M3R is known to be expressed physiologically.
Confocal microscopic studies demonstrated that Tmem147 is an ER-membrane-associated protein. It is noteworthy that overexpression of Tmem147 in COS-7 cells led to the intracellular retention of the M3R in the ER, suggesting that Tmem147 regulates the transport of the M3R to the cell surface.
Similar to Tmem147, several other proteins have been identified that can regulate the cell surface expression of certain GPCRs. For example, Bermak et al. (2001) found that DRiP78, an ER membrane-associated protein, can interact with the D1 dopamine receptor, leading to its retention in the ER. Moreover, several chaperones and other escort proteins have been shown to promote cell surface expression of certain GPCRs (Ritter and Hall, 2009). It is noteworthy that heterodimer formation between the GABAB-1 and -2 receptor subtypes is required for efficient trafficking of GABAB receptors to the cell surface (Jones et al., 1998).
Consistent with the M3R/Tmem147 interaction observed in yeast, coimmunoprecipitation studies demonstrated that the M3R was also associated with Tmem147 in cotransfected mammalian cells (COS-7 cells). In agreement with the observation that Tmem147 impairs exit of the M3R from the ER, the number of detectable [3H]NMS binding sites was drastically reduced in COS-7 cells coexpressing the M3R and Tmem147. Tmem147 coexpression also led to reduced M3R-mediated calcium mobilization, probably as a consequence of reduced M3R cell surface expression. Preliminary studies demonstrated that other class I GPCRs, including the M1 muscarinic and the V2 vasopressin receptor subtypes, could also be coimmunoprecipitated with Tmem147 in cotransfected COS-7 cells. It is therefore likely that Tmem147 also regulates the expression and function of other (non-M3R) GPCRs.
Several recent DNA microarray studies have shown that the expression of the Tmem147 gene (NIFIE14) is up-regulated in various human cancers (Basil et al., 2006; Staub et al., 2007; Velazquez et al., 2007), raising the possibility that Tmem147 may play a role tumor formation. In addition, a considerable body of evidence suggests that enhanced M3R activity may contribute to the pathogenesis of colon cancers (Frucht et al., 1999; Cheng et al., 2003; Raufman et al., 2008; Xie et al., 2009; Cheng and Raufman; 2005). For example, Raufman et al. (2008) recently demonstrated that azoxymethane treatment caused significantly fewer colon tumors in M3R knockout mice than in WT litter mates. On the basis of these findings, we decided to explore the possible physiological significance of the M3R/Tmem147 interaction in the H508 colon tumor cell line.
H508 cells are known to express M3Rs endogenously (Frucht et al., 1999). We demonstrated that the M3R is the only muscarinic receptor subtype that is expressed at significant levels in this cell line. In agreement with previous findings, we demonstrated that the hydrolytically stable muscarinic agonist, carbachol, promoted H508 cell proliferation and the phosphorylation of p90RSK. Previous studies also suggest that M3R-mediated activation of p90RSKis intimately linked to carbachol-induced H508 cell proliferation (Cheng et al., 2003; Cheng and Raufman, 2005). siRNA-mediated knockdown of Tmem147 expression in H508 cells led to a significant increase in carbachol-promoted cell proliferation and p90RSK phosphorylation. Knockdown of Tmem147 expression was also associated with a significant increase in the number of M3Rs present on the cell surface, as determined in [3H]NMS radioligand binding studies carried out with intact H508 cells. Taken together, these findings provide convincing evidence that endogenous Tmem147 also regulates the activity of M3Rs endogenously expressed by a colon cancer cell line. It is therefore highly likely that the Tmem147/M3R interaction is also of physiological relevance.
In future studies, we are planning to identify the structural elements that are critical for the observed Tmem147/M3R interaction. These studies should also provide more detailed mechanistic insight into how Tmem147 binding leads to M3R retention in the ER.
After completion of this study, Jin et al. (2010) reported the usefulness of the split ubiquitin two-hybrid screen to identify proteins that can associate with the μ-opioid receptor (MOR). In particular, the authors identified GPR177, the mammalian ortholog of Drosophila melanogaster Wntless, as a novel MOR-interacting protein. Additional experiments indicated that morphine treatment led to enhanced MOR/GPR177 complex formation at the cell periphery and inhibition of Wnt protein secretion, perhaps resulting in decreased neurogenesis (Jin et al., 2010).
In conclusion, these results demonstrate that the split ubiquitin two-hybrid screen (MbYTH screen) represents a powerful approach to identify novel GPCR-interacting proteins. In the present study, we used this strategy to identify many novel M3R-associated proteins, including Tmem147, an ER resident protein. Because the majority of these proteins were not detected in conventional YTH screens, it is likely that most of the M3R-associated proteins that emerged from the MbYTH screen require the presence of the membrane-embedded full-length M3R for high affinity binding. Because M3R-dependent signaling pathways are involved in many important physiological and pathophysiological processes, Tmem147 and other M3R-associated proteins may represent novel targets for modulating M3R activity for therapeutic purposes.
Supplementary Material
Acknowledgments
We thank Drs. Jean-Pierre Raufman and Kunrong Cheng (University of Maryland School of Medicine, Baltimore, MD) for advice and helpful discussions regarding the H508 cell assays.
The online version of this article (available at http://molpharm.aspetjournals.org) contains supplemental material.
This research was supported by the Intramural Research Program of the National Institutes of Health National Institute of Diabetes and Digestive and Kidney Diseases.
Article, publication date, and citation information can be found at http://molpharm.aspetjournals.org.
doi:10.1124/mol.110.067363.
- M3R
- M3 muscarinic receptor
- 3-AT
- 3-amino-1,2,4-triazole
- Cub
- C-terminal portion of ubiquitin
- FBS
- fetal bovine serum
- GPCR
- G protein-coupled receptor
- HA
- hemagglutinin
- NMS
- N-methyl scopolamine
- MbYTH
- membrane-based yeast two-hybrid
- Nub
- N-terminal portion of ubiquitin
- PBS
- phosphate-buffered saline
- QNB
- quinuclidinyl benzilate
- Tmem147
- transmembrane protein 147
- TCA
- trichloroacetic acid
- YTH
- yeast two-hybrid
- bp
- base pair(s)
- ER
- endoplasmic reticulum
- siRNA
- small interfering RNA
- PCR
- polymerase chain reaction
- FLIPR
- fluorometric imaging plate reader
- MOPS
- 3-(N-morpholino)propanesulfonic acid
- HRP
- horseradish peroxidase
- RT-PCR
- reverse transcription-polymerase chain reaction
- qRT-PCR
- quantitative reverse transcription-polymerase chain reaction
- WT
- wild type
- p90RSK
- p90 ribosomal S6 kinase
- MOR
- μ-opioid receptor.
Authorship Contributions
Participated in research design: Rosemond, Rossi, McMillin, Scarselli, and Wess.
Conducted experiments: Rosemond, Rossi, McMillin, and Scarselli.
Performed data analysis: Rosemond, Rossi, McMillin, Scarselli, and Donaldson.
Wrote or contributed to the writing of the manuscript: Rosemond and Wess.
References
- Anjum R, Blenis J. (2008) The RSK family of kinases: emerging roles in cellular signalling. Nat Rev Mol Cell Biol 9:747–758 [DOI] [PubMed] [Google Scholar]
- Basil CF, Zhao Y, Zavaglia K, Jin P, Panelli MC, Voiculescu S, Mandruzzato S, Lee HM, Seliger B, Freedman RS, et al. (2006) Common cancer biomarkers. Cancer Res 66:2953–2961 [DOI] [PubMed] [Google Scholar]
- Bermak JC, Li M, Bullock C, Zhou QY. (2001) Regulation of transport of the dopamine D1 receptor by a new membrane-associated ER protein. Nat Cell Biol 3:492–498 [DOI] [PubMed] [Google Scholar]
- Bockaert J, Perroy J, Bécamel C, Marin P, Fagni L. (2010) GPCR interacting proteins (GIPs) in the nervous system: Roles in physiology and pathologies. Annu Rev Pharmacol Toxicol 50:89–109 [DOI] [PubMed] [Google Scholar]
- Caulfield MP, Birdsall NJ. (1998) International Union of Pharmacology. XVII. Classification of muscarinic acetylcholine receptors. Pharmacol Rev 50:279–290 [PubMed] [Google Scholar]
- Cheng K, Raufman JP. (2005) Bile acid-induced proliferation of a human colon cancer cell line is mediated by transactivation of epidermal growth factor receptors. Biochem Pharmacol 70:1035–1047 [DOI] [PubMed] [Google Scholar]
- Cheng K, Xie G, Raufman JP. (2007) Matrix metalloproteinase-7-catalyzed release of HB-EGF mediates deoxycholyltaurine-induced proliferation of a human colon cancer cell line. Biochem Pharmacol 73:1001–1012 [DOI] [PMC free article] [PubMed] [Google Scholar]
- Cheng K, Zimniak P, Raufman JP. (2003) Transactivation of the epidermal growth factor receptor mediates cholinergic agonist-induced proliferation of H508 human colon cancer cells. Cancer Res 63:6744–6750 [PubMed] [Google Scholar]
- Eglen RM. (2005) Muscarinic receptor subtype pharmacology and physiology. Prog Med Chem 43:105–136 [DOI] [PubMed] [Google Scholar]
- Erlenbach I, Kostenis E, Schmidt C, Hamdan FF, Pausch MH, Wess J. (2001) Functional expression of M1, M3 and M5 muscarinic acetylcholine receptors in yeast. J Neurochem 77:1327–1337 [DOI] [PubMed] [Google Scholar]
- Free RB, Hazelwood LA, Cabrera DM, Spalding HN, Namkung Y, Rankin ML, Sibley DR. (2007) D1 and D2 dopamine receptor expression is regulated by direct interaction with the chaperone protein calnexin. J Biol Chem 282:21285–21300 [DOI] [PubMed] [Google Scholar]
- Frucht H, Jensen RT, Dexter D, Yang WL, Xiao Y. (1999) Human colon cancer cell proliferation mediated by the M3 muscarinic cholinergic receptor. Clin Cancer Res 5:2532–2539 [PubMed] [Google Scholar]
- Gautam D, Han SJ, Hamdan FF, Jeon J, Li B, Li JH, Cui Y, Mears D, Lu H, Deng C, et al. (2006) A critical role for β cell M3 muscarinic acetylcholine receptors in regulating insulin release and blood glucose homeostasis in vivo. Cell Metab 3:449–461 [DOI] [PubMed] [Google Scholar]
- Gautam D, Jeon J, Starost MF, Han SJ, Hamdan FF, Cui Y, Parlow AF, Gavrilova O, Szalayova I, Mezey E, et al. (2009) Neuronal M3 muscarinic acetylcholine receptors are essential for somatotroph proliferation and normal somatic growth. Proc Natl Acad Sci USA 106:6398–6403 [DOI] [PMC free article] [PubMed] [Google Scholar]
- Goin JC, Nathanson NM. (2006) Quantitative analysis of muscarinic acetylcholine receptor homo- and heterodimerization in live cells: regulation of receptor down-regulation by heterodimerization. J Biol Chem 281:5416–5425 [DOI] [PubMed] [Google Scholar]
- Iyer K, Bürkle L, Auerbach D, Thaminy S, Dinkel M, Engels K, Stagljar I. (2005) Utilizing the split-ubiquitin membrane yeast two-hybrid system to identify protein-protein interactions of integral membrane proteins. Sci STKE 2005:pl3 [DOI] [PubMed] [Google Scholar]
- Jin J, Kittanakom S, Wong V, Reyes BA, Van Bockstaele EJ, Stagljar I, Berrettini W, Levenson R. (2010) Interaction of the mu-opioid receptor with GPR177 (Wntless) inhibits Wnt secretion: potential implications for opioid dependence. BMC Neurosci 11:33 [DOI] [PMC free article] [PubMed] [Google Scholar]
- Jones KA, Borowsky B, Tamm JA, Craig DA, Durkin MM, Dai M, Yao WJ, Johnson M, Gunwaldsen C, Huang LY, et al. (1998) GABAB receptors function as a heteromeric assembly of the subunits GABABR1 and GABABR2. Nature 396:674–679 [DOI] [PubMed] [Google Scholar]
- Kittanakom S, Chuk M, Wong V, Snyder J, Edmonds D, Lydakis A, Zhang Z, Auerbach D, Stagljar I. (2009) Analysis of membrane protein complexes using the split-ubiquitin membrane yeast two-hybrid (MYTH) system. Methods Mol Biol 548:247–271 [DOI] [PubMed] [Google Scholar]
- Li JH, Gautam D, Han SJ, Guettier JM, Cui Y, Lu H, Deng C, O'Hare J, Jou W, Gavrilova O, et al. (2009) Hepatic muscarinic acetylcholine receptors are not critically involved in maintaining glucose homeostasis in mice. Diabetes 58:2776–2787 [DOI] [PMC free article] [PubMed] [Google Scholar]
- Lucas JL, Wang D, Sadée W. (2006) Calmodulin binding to peptides derived from the i3 loop of muscarinic receptors. Pharm Res 23:647–653 [DOI] [PubMed] [Google Scholar]
- Mitchell R, Robertson DN, Holland PJ, Collins D, Lutz EM, Johnson MS. (2003) ADP-ribosylation factor-dependent phospholipase D activation by the M3 muscarinic receptor. J Biol Chem 278:33818–33830 [DOI] [PubMed] [Google Scholar]
- Mumberg D, Müller R, Funk M. (1995) Yeast vectors for the controlled expression of heterologous proteins in different genetic backgrounds. Gene 156:119–122 [DOI] [PubMed] [Google Scholar]
- Pausch MH, Price LA, Kajkowski EM, Strnad J, dela Cruz F, Heinrich J, Ozenberger BA, Hadcock JR. (1998) Heterologous G protein-coupled receptors expressed in Saccharomyces cerevisiae: methods for genetic analysis and ligand identification, in Identification and Expression of G Protein-Coupled Receptors (Lynch KR. ed) pp 196–212, Wiley-Liss, New York: [Google Scholar]
- Raufman JP, Samimi R, Shah N, Khurana S, Shant J, Drachenberg C, Xie G, Wess J, Cheng K. (2008) Genetic ablation of M3 muscarinic receptors attenuates murine colon epithelial cell proliferation and neoplasia. Cancer Res 68:3573–3578 [DOI] [PMC free article] [PubMed] [Google Scholar]
- Ritter SL, Hall RA. (2009) Fine-tuning of GPCR activity by receptor-interacting proteins. Nat Rev Mol Cell Biol 10:819–830 [DOI] [PMC free article] [PubMed] [Google Scholar]
- Scarselli M, Donaldson JG. (2009) Constitutive internalization of G protein-coupled receptors and G proteins via clathrin-independent endocytosis. J Biol Chem 284:3577–3585 [DOI] [PMC free article] [PubMed] [Google Scholar]
- Scarselli M, Li B, Kim SK, Wess J. (2007) Multiple residues in the second extracellular loop are critical for M3 muscarinic acetylcholine receptor activation. J Biol Chem 282:7385–7396 [DOI] [PubMed] [Google Scholar]
- Schöneberg T, Liu J, Wess J. (1995) Plasma membrane localization and functional rescue of truncated forms of a G protein-coupled receptor. J Biol Chem 270:18000–18006 [DOI] [PubMed] [Google Scholar]
- Schoneberg T, Yun J, Wenkert D, Wess J. (1996) Functional rescue of mutant V2 vasopressin receptors causing nephrogenic diabetes insipidus by a co-expressed receptor polypeptide. EMBO J 15:1283–1291 [PMC free article] [PubMed] [Google Scholar]
- Shi Y, Oury F, Yadav VK, Wess J, Liu XS, Guo XE, Murshed M, Karsenty G. (2010) Signaling through the M3 muscarinic receptor favors bone mass accrual by decreasing sympathetic activity. Cell Metab 11:231–238 [DOI] [PMC free article] [PubMed] [Google Scholar]
- Skehan P, Storeng R, Scudiero D, Monks A, McMahon J, Vistica D, Warren JT, Bokesch H, Kenney S, Boyd MR. (1990) New colorimetric cytotoxicity assay for anticancer-drug screening. J Natl Cancer Inst 82:1107–1112 [DOI] [PubMed] [Google Scholar]
- Stagljar I, Fields S. (2002) Analysis of membrane protein interactions using yeast-based technologies. Trends Biochem Sci 27:559–563 [DOI] [PubMed] [Google Scholar]
- Staub E, Groene J, Heinze M, Mennerich D, Roepcke S, Klaman I, Hinzmann B, Castanos-Velez E, Pilarsky C, Mann B, et al. (2007) Genome-wide expression patterns of invasion front, inner tumor mass and surrounding normal epithelium of colorectal tumors. Mol Cancer 6:79 [DOI] [PMC free article] [PubMed] [Google Scholar]
- Velazquez EF, Yancovitz M, Pavlick A, Berman R, Shapiro R, Bogunovic D, O'Neill D, Yu YL, Spira J, Christos PJ, et al. (2007) Clinical relevance of neutral endopeptidase (NEP/CD10) in melanoma. J Transl Med 5:2 [DOI] [PMC free article] [PubMed] [Google Scholar]
- Wess J. (1996) Molecular biology of muscarinic acetylcholine receptors. Crit Rev Neurobiol 10:69–99 [DOI] [PubMed] [Google Scholar]
- Wess J, Eglen RM, Gautam D. (2007) Muscarinic acetylcholine receptors: mutant mice provide new insights for drug development. Nat Rev Drug Discov 6:721–733 [DOI] [PubMed] [Google Scholar]
- Xie G, Cheng K, Shant J, Raufman JP. (2009) Acetylcholine-induced activation of M3 muscarinic receptors stimulates robust matrix metalloproteinase gene expression in human colon cancer cells. Am J Physiol Gastrointest Liver Physiol 296:G755–G763 [DOI] [PMC free article] [PubMed] [Google Scholar]
- Zeng FY, Wess J. (1999) Identification and molecular characterization of m3 muscarinic receptor dimers. J Biol Chem 274:19487–19497 [DOI] [PubMed] [Google Scholar]
Associated Data
This section collects any data citations, data availability statements, or supplementary materials included in this article.


