Abstract
Glucuronidation is often recognized as one of the rate-determining factors that limit the bioavailability of flavonols. Hence, design and synthesis of more bioavailable flavonols would benefit from the establishment of predictive models of glucuronidation using kinetic parameters [e.g., Km, Vmax, intrinsic clearance (CLint) = Vmax/Km] derived for flavonols. This article aims to construct position (3-OH)-specific comparative molecular field analysis (CoMFA) models to describe UDP-glucuronosyltransferase (UGT) 1A9-mediated glucuronidation of flavonols, which can be used to design poor UGT1A9 substrates. The kinetics of recombinant UGT1A9-mediated 3-O-glucuronidation of 30 flavonols was characterized, and kinetic parameters (Km, Vmax, CLint) were obtained. The observed Km, Vmax, and CLint values of 3-O-glucuronidation ranged from 0.04 to 0.68 μM, 0.04 to 12.95 nmol/mg/min, and 0.06 to 109.60 ml/mg/min, respectively. To model UGT1A9-mediated glucuronidation, 30 flavonols were split into the training (23 compounds) and test (7 compounds) sets. These flavonols were then aligned by mapping the flavonols to specific common feature pharmacophores, which were used to construct CoMFA models of Vmax and CLint, respectively. The derived CoMFA models possessed good internal and external consistency and showed statistical significance and substantive predictive abilities (Vmax model: q2 = 0.738, r2 = 0.976, rpred2 = 0.735; CLint model: q2 = 0.561, r2 = 0.938, rpred2 = 0.630). The contour maps derived from CoMFA modeling clearly indicate structural characteristics associated with rapid or slow 3-O-glucuronidation. In conclusion, the approach of coupling CoMFA analysis with a pharmacophore-based structural alignment is viable for constructing a predictive model for regiospecific glucuronidation rates of flavonols by UGT1A9.
Introduction
Flavonols are widely distributed in regular human diets (D'Archivio et al., 2007). There are nearly 400 natural flavonols reported, and the majority of them have flavonol structural scaffold with hydroxyl (OH) and/or methoxy (OMe) substitutions (Andersen and Markham, 2006). It is now well known that this class of naturally occurring compounds is linked to a variety of health-promoting activities such as antioxidant and anticancer effects (Birt et al., 2001; Ross and Kasum, 2002). However, the undesired biopharmaceutical properties of flavonols (e.g., quercetin and kaempferol), which undergo particularly rapid and extensive phase II metabolism, produced low levels of the parent compounds but high levels of the conjugated forms (e.g., glucuronides or sulfates to a lesser extent) found in the blood (Erlund et al., 2006; Barve et al., 2009).
UDP-glucuronosyltransferases (UGTs) are a family of enzymes that mediate the glucuronidation of endogenous or exogenous compounds. The substrates need to contain one or more nucleophilic groups (e.g., hydroxyl, alcohol, amine, thiol, or carboxylic acid groups) to which the cofactor UDP-glucuronic acid is covalently linked (Jancova et al., 2010). This pattern of structural recognition explains the broad substrate specificity of UGTs and underpins its wide detoxification functionality by turning the substrates to hydrophilic metabolite, which can be readily eliminated (Iyanagi, 2007). In the UGT superfamily, the enzymes of the UGT1A and UGT2B subfamilies contribute significantly to phase II metabolism (Wong et al., 2009). To date, a total of 16 functional isoforms have been identified (nine for UGT1A and seven for UGT2B): UGT1A1, UGT1A3, UGT1A4, UGT1A5, UGT1A6, UGT1A7, UGT1A8, UGT1A9, UGT1A10, UGT2B4, UGT2B7, UGT2B10, UGT2B11, UGT2B15, UGT2B17, and UGT2B28 (Mackenzie et al., 2005). Liver, as the major first-pass metabolizing organ, expresses a variety of UGT isoforms, including UGT1A1, UGT1A3, UGT1A4, UGT1A5, UGT1A6, UGT1A9, UGT2B7, and UGT2B15. In contrast, UGT1A7, UGT1A8, and UGT1A10 are present primarily in the gastrointestinal tract or esophagus (Fisher et al., 2001; Ohno and Nakajin, 2009).
UGT1A9 is a unique enzyme among the nine UGT1A isoforms. UGT1A9 is resistant to detergent and is stable in response to heat treatment at 57°C for 15 min (Fujiwara et al., 2009). Consistent with this observation, our earlier study showed that UGT1A9 was thermostable in metabolizing prunetin (an isoflavone) at 37°C for more than 8 h (Joseph et al., 2007). Moreover, UGT1A9 demonstrated greater proficiency in glucuronidating flavonoids. In the study by Chen et al. (2008), the catalyzing efficiency (Vmax/Km) of UGT1A9 was higher than that of UGT1A3. It has also been observed that UGT1A9 ranks within the top three isoforms that most effectively metabolize isoflavones, flavones, and flavonols (Tang et al., 2009, 2010). The good correlation between glucuronidation rates derived from UGT isoforms (UGT1A9 plus UGT1A1) and those from human liver microsomes highlight the fact that UGT1A9 contributes significantly to the glucuronidation activity of liver microsomes in metabolizing flavonoids (Tang et al., 2010).
It is therefore hypothesized that a poor flavonol substrate of UGT1A9 will have less efficient glucuronidation in vivo, which could lead to higher bioavailability. One approach to finding the poor substrate (with potential for high bioavailability) is to test every compound experimentally, which is labor- and cost-intensive. Alternatively, a quantitative structure-activity relationship (QSAR) can be established. Approaches to predicting biological activities by building QSAR models are usually from two directions: structure-based or ligand-based. Because of a lack of mammalian UGT crystal structures, ligand-based approaches [e.g., 2D/3D QSAR, pharmacophore modeling, and comparative molecular field analysis (CoMFA)] have been applied to establish quantitative or qualitative structure-glucuronidation relationships (Sorich et al., 2008). Predictive regression and pharmacophore models have been generated with UGT1A1 and UGT1A4 by using structurally diverse compounds (Sorich et al., 2002; Smith et al., 2003). However, attempts to develop predictive QSAR for substrates of UGT1A9 have been unsuccessful (Miners et al., 2004). On the other hand, CoMFA was used to examine a series of 18 compounds (triphenylalkyl carboxylic acid analog) that inhibited glucuronidation of bilirubin by UGT1A1; the resulting model allowed good prediction of inhibitory potency (Said et al., 1996).
CoMFA is a 3D QSAR technique (Cramer et al., 1988) that aims to derive a correlation between the biological activity of ligands and their structural characteristics (i.e., steric and electrostatic properties). The final validated CoMFA model can be used to design novel ligands and predict the biological activities thereof. CoMFA methodology has been widely and successfully used to model interactions between proteins and many types of biological ligands such as enzyme inhibitors (Barreca et al., 1999; Holder et al., 2007), CYP2D6 substrates (Haji-Momenian et al., 2003), and antifungal agents (Wei et al., 2005).
It is still not fully understood which characteristics make flavonol a good or poor UGT1A9 substrate. UGT1A9 often generates multiple monoglucuronide isomers from a single flavonoid that bears more than one conjugation site. For example, two glucuronides were generated from 3,7-dihydroxylfavone (Tang et al., 2010), three glucuronides were generated from galangin and luteolin (Otake et al., 2002; Chen et al., 2008), and four glucuronides were generated from quercetin (Chen et al., 2008). Currently, there is no method that can be used to predict the kinetic parameters of glucuronidation for polyphenolic compounds such as flavonol. It is assumed that the difficulties arose from the approach that seeks to build a single model that will predict the rates of glucuronidation at multiple sites. We believe that a new predictive algorithm is needed to account for glucuronidation at all phenolic groups (-OH) in flavonols. This algorithm must consist of multiple regiospecific (position-specific) models, which can separately predict the glucuronidation rates on a particular position (e.g., 3-O-glucuronidation in flavonols), and the addition of glucuronidation rates from the multiple positions will represent the total glucuronidation rates or overall metabolic susceptibility. Therefore, the objective of this article is to construct a position (3-OH)-specific CoMFA model to predict 3-O-glucuronidation. 3-O-glucuronidation was chosen because it is the most active position in UGT1A9-mediated glucuronidation (Otake et al., 2002; Tang et al., 2010). Kinetics parameters (Km, Vmax, CLint) of UGT1A9-mediated 3-O-glucuronidation with 30 flavonols were determined. The Vmax and CLint datasets were used to construct their respective position-specific (3-OH) CoMFA models, based on molecular alignments generated from a defined pharmacophore search. Contour maps from CoMFA provided insightful structural characteristics associated with rapidly or slowly metabolized flavonol substrates for 3-O-glucuronidation.
Materials and Methods
Materials.
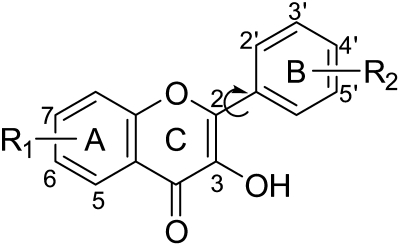
Expressed human UGT1A9 isoform (Supersomes) were purchased from BD Gentest (Woburn, MA). The recombinant UGT1A9 displayed a Km value of 25.8 ± 4.47 μM and a Vmax value of 148 ± 7.03 pmol/mg/min when it was used to glucuronidate the probe substrate propofol (Supplemental Fig. S1). Uridine diphosphoglucuronic acid, alamethicin, d-saccharic-1,4-lactone monohydrate, and magnesium chloride were purchased from Sigma-Aldrich (St. Louis, MO). Ammonium acetate was purchased from J. T. Baker (Phillipsburg, NT). Thirty flavonols (Fig. 1 and Table 1) were purchased from Indofine Chemicals (Hillsborough, NJ). The flavonols structurally differ in number and position of substituents [hydroxyl (-OH) or methoxy (-OMe)] on the A-ring or B-ring. Particularly, compounds 16 and 27 have methyl groups at C6. C3′ and C4′ of compound 16 are cosubstituted by the methylenedioxy group. All other materials (typically analytical grade or better) were used as received.
Fig. 1.
Backbone of flavonol structures (see Table 1 for the definitions of the substituents). Compared with flavonols, flavones lack 3-OH on the 2-phenylbenzopyran scaffold.
TABLE 1.
Flavonols used in the work (see Fig.1 for chemical structures)
| Compound | Name | Abbreviation | R1 | R2 |
|---|---|---|---|---|
| 1 | 3,2′-Dihydroxyflavone | 32′DHF | 2′-OH | |
| 2 | 3,3′,4′-Trihydroxyflavone | 33′4′THF | 3′-OH;4′-OH | |
| 3 | 3,4′-Dihydroxyflavone | 34′DHF | 4′-OH | |
| 4 | 3,6,4′-Trihydroxyflavone | 364′THF | 6-OH | 4′-OH |
| 5 | 3,6-Dihydroxyflavone | 36DHF | 6-OH | |
| 6 | 3,7-Dihydroxyflavone | 37DHF | 7-OH | |
| 7 | 3-Hydroxy-2′-methoxyflavone | 3H2′MF | 2′-OMe | |
| 8 | 3-Hydroxy-3′-methoxyflavone | 3H3′MF | 3′-OMe | |
| 9 | 3-Hydroxy-4′-methoxyflavone | 3H4′MF | 4′-OMe | |
| 10 | 3-Hydroxy-5,7-dimethoxyflavone | 3H57DMF | 5-OMe; 7-OMe | |
| 11 | 3-Hydroxy-5-methoxyflavone | 3H5MF | 5-OMe | |
| 12 | 3-Hydroxy-6,4′-dimethoxyflavone | 3H64′DMF | 6-OMe | 4′-OMe |
| 13 | 3-Hydroxy-6-methoxyflavone | 3H6MF | 6-OMe | |
| 14 | 3-Hydroxy-7-methoxyflavone | 3H7MF | 7-OMe | |
| 15 | 3-Hydroxyflavone | 3HF | ||
| 16 | 3-Hydroxy-6-methyl-3′,4′-methylenedioxyflavone | Dioxy | 6-Me | 3′,4′-methylenedioxy |
| 17 | Isorhamnetin | Iso | 5-OH; 7-OH | 4′-OH; 3′-OMe |
| 18 | Kaempferol | 3574′QHF | 5-OH; 7-OH | 4′-OH |
| 19 | Morin | 5-OH; 7-OH | 2′-OH; 4′-OH | |
| 20 | Myricetin | Myr | 5-OH; 7-OH | 3′-OH; 4′-OH; 5′-OH |
| 21 | Quercetin | 3573′4′PHF | 5-OH; 7-OH | 3′-OH; 4′-OH |
| 22 | Resokaempferol | 374′THF | 7-OH | 4′-OH |
| 23 | Rhamnetin | Rha | 5-OH; 7-OMe | 4′-OH; 3′-OH |
| 24 | 3,3′-Dihydroxyflavone | 33′DHF | 3′-OH | |
| 25 | 3,5-Dihydroxyflavone | 35DHF | 5-OH | |
| 26 | 3-Hydroxy-2′,3′-dimethoxyflavone | 3H2′3′DMF | 2′-OMe;3′-OMe | |
| 27 | 3-Hydroxy-6-methylflavone | 3H6MeF | 6-Me | |
| 28 | 3-Hydroxy-7,4′-dimethoxyflavone | 3H74′DMF | 7-OMe | 4′-OMe |
| 29 | Fisetin | 7-OH | 3′-OH; 4′-OH | |
| 30 | Galangin | 357THF | 5-OH; 7-OH |
-OH, hydroxyl group; -Me, methyl group; -OMe, methoxyl group.
UGT1A9 Enzyme Kinetics.
Enzyme kinetics parameters of glucuronidation by UGT1A9 were determined by measuring initial glucuronidation rates of flavonols at a series of concentrations. The experimental procedures of UGT assays were exactly the same as those described previously (Joseph et al., 2007; Tang et al., 2009, 2010; Singh et al., 2010). Glucuronidation rates were calculated as the amount of glucuronides formed per protein quantity per reaction time (or nmol/mg/min). Aglycone substrate concentrations in the range of 0.039 to 40 μM were used unless method sensitivity or substrate solubility necessitated otherwise. All experiments were performed in triplicate.
Ultra Performance Liquid Chromatography Analysis of Flavonols and Their Glucuronides.
The Waters (Milford, MA) ACQUITY ultra performance liquid chromatography (UPLC) system was used to analyze the parent compounds and their corresponding glucuronides. UPLC methods for each flavonol and the glucuronides were essentially the same as described previously (Tang et al., 2009, 2010; Singh et al., 2010) with slight modifications. In brief, mobile phase A was 2.5 mM ammonium acetate in purified water (pH 6.5). Mobile phase B was 100% acetonitrile. The mobile phase was run 5 min at a flow rate of 0.45 ml/min with the predetermined gradient (0 min, 10% B; 0–2 min, 10–20% B; 2–3 min, 20–40% B; 3–3.5 min, 40–50% B; 3.5–4 min, 50–90% B; 4–4.5 min, 90% B; 4.5–5 min, 90–10% B). For compound 18 (kaempferol), different mobile phase B and gradient were adopted: mobile phase B, 100% methanol; and gradient, 0 min, 10% B; 0 to 2 min, 10 to 20% B; 2 to 3 min, 20 to 40% B; 3 to 3.5 min, 40 to 50% B; 3.5 to 4 min, 50 to 70% B; 4 to 5 min, 70 to 90% B; 5 to 5.5 min, 90% B; and 5.5 to 6 min, 90 to 100% B. Quantitation of the glucuronide was based on the standard curve of the parent compound and was further calibrated using the conversion factor. The conversion factors (Supplemental Table S1) were generated for 3-O-glucuronides compared with the respective aglycone following the protocol described previously (Tang et al., 2009, 2010). Representative chromatograms and UV spectra are shown in Supplemental Fig. S2.
Glucuronide Structure Confirmation.
Glucuronide structures were confirmed via a three-step process as summarized previously (Singh et al., 2010). First, the glucuronides were hydrolyzed by β-d-glucuronidase to the aglycones. Second, the glucuronides were identified as monoglucuronides that showed mass of [(aglycone's mass) + 176] Da using UPLC/tandem mass spectroscopy, where 176 Da is the mass of single glucuronic acid. The same UPLC/tandem mass spectroscopy instruments and methods described previously (Singh et al., 2010) were applied in this study. Finally, the 3-O-glucuronides were confirmed by the UV spectrum maxima (λmax) shift method (Singh et al., 2010). This method is based on the characteristic UV shifts caused by glucuronic acid substitution on a particular hydroxyl group. In brief, if the 3-hydroxyl group on the flavonol nucleus was glucuronidated, disappearance of UV maxima or hypsochromic shifts (i.e., to shorter wavelength) were observed in band I (∼300–400 nm). The shift in band I associated with the substitution was on the order of 13 to 30 nm. Detailed UV data are shown in Supplemental Fig. S2.
Kinetics Analysis.
Kinetic parameters [Vmax, Km, or Ks (substrate inhibition constant)] were estimated by fitting the initial rate data to Michaelis-Menten and substrate inhibition rate equations by nonlinear least-squares regression. Data analysis was performed with Prism version 5 for Windows (GraphPad Software Inc., San Diego, CA). The goodness of fit was evaluated on the basis of R2 values, residual sum of squares, root mean square (RMS), and residual plots (Christopoulos and Lew, 2000). The Vmax values obtained here are apparent values because the actual concentration of UGT1A9 is unknown.
Pharmacophore Generation and Conformation Search.
Pharmacophore modeling was performed using MOE (molecular operating environment) software, version 2008.10 (Chemical Computing Group, Montreal, Canada). All of the compounds were drawn on the builder module of MOE and subjected to energy minimization at a RMS gradient of 0.00001. The conformational database was created by “conformation import” using the MMFF94x force field for every compound. The force field parameters were kept at their default values of the strain limit of 4 kcal/mol and the conformations limit of 250 conformations/molecule. Compound 15 (3-hydroxyflavone) was used as a reference molecule to develop the pharmacophore query with the “pharmacophore query editor.” A pharmacophore search using the created query was run against the conformational database of flavonols. The best-matched conformer for each flavonol (lowest RMS deviation) was selected, and the alignments were used for CoMFA.
Comparative Molecular Field Analysis.
The 30 flavonol molecules were arbitrarily divided into training (23 compounds) and test (7 compounds) sets as shown in Table 2. The compounds from the test set were assigned by considering their substitution patterns so that the test set compounds could reflect the variations in glucuronidation activity of the training set, and both data sets covered similar diversity in their chemical space. The training set (compounds 1-23; Table 2) was used for CoMFA modeling. The molecular alignments generated from the pharmacophore model were used in CoMFA studies using Sybyl8.0 software (Tripos, St. Louis, MO). Partial charges were recalculated by using the MNDO (modified neglect of diatomic overlap) method. The molecules were placed in a three-dimensional grid (2.0-Å spacing). At each grid point, steric energy (Lennard-Jones potential) and electrostatic energy were calculated. Cross-validated partial least-squares analysis was performed to determine the optimal number of components. The maximal number of components was limited to eight to avoid overfitting. The definitive CoMFA model, which was used for prediction of activity, was built by noncross-validated partial least-squares analysis using the optimal number of components. The q2 (cross-validated r2), cross-validated standard error of prediction, r2 (noncross-validated r2), F values, and S.E. estimate values were computed and are shown in Table 3. Pr2 denotes the probability of obtaining the observed F ratio value by chance alone.
TABLE 2.
Kinetics parameters of UGT1A9 mediated 3-O-glucuronidation with flavonols, together with the predicted Vmax and CLint values from their respective CoMFA models
| Compound | Name | Km | Vmax | CLint (Vmax/Km) | Log (Vmax) |
Log (CLint) |
||
|---|---|---|---|---|---|---|---|---|
| Observeda | Calculatedb | Observeda | Calculatedb | |||||
| μM | nmol/mg/min | ml/mg/min | ||||||
| 1 | 32′DHF | 0.67 | 0.052 | 0.078 | 1.72 | 1.68 | 1.89 | 2.31 |
| 2 | 33′4′THF | 0.10 | 2.2 | 22 | 3.34 | 3.41 | 4.34 | 4.37 |
| 3 | 34′DHF | 0.13 | 1.8 | 14 | 3.25 | 3.30 | 4.14 | 4.06 |
| 4 | 364′THF | 0.31 | 6.8 | 22 | 3.84 | 3.94 | 4.34 | 4.29 |
| 5 | 36DHF | 0.62 | 13 | 21 | 4.11 | 4.08 | 4.32 | 4.31 |
| 6 | 37DHF | 0.22 | 4.6 | 21 | 3.66 | 3.51 | 4.32 | 4.07 |
| 7 | 3H2′MF | 0.21 | 3.8 | 18 | 3.58 | 3.59 | 4.25 | 4.08 |
| 8 | 3H3′MF | 0.063 | 2.9 | 46 | 3.47 | 3.44 | 4.66 | 4.47 |
| 9 | 3H4′MF | 0.059 | 1.9 | 32 | 3.28 | 3.33 | 4.51 | 4.59 |
| 10 | 3H57DMF | 0.13 | 3.3 | 26 | 3.52 | 3.70 | 4.40 | 4.52 |
| 11 | 3H5MF | 0.082 | 1.9 | 24 | 3.29 | 3.24 | 4.36 | 4.11 |
| 12 | 3H64′DMF | 0.043 | 2.2 | 51 | 3.34 | 3.33 | 4.71 | 4.73 |
| 13 | 3H6MF | 0.074 | 5.4 | 73 | 3.73 | 3.66 | 4.86 | 4.84 |
| 14 | 3H7MF | 0.27 | 10 | 37 | 4.01 | 4.00 | 4.57 | 4.62 |
| 15 | 3HF | 0.30 | 2.1 | 7.0 | 3.32 | 3.45 | 3.84 | 4.16 |
| 16 | Dioxy | 0.066 | 6.0 | 91 | 3.78 | 3.69 | 4.96 | 5.20 |
| 17 | Iso | 0.32 | 12 | 38 | 4.09 | 4.17 | 4.59 | 4.81 |
| 18 | 3574′QHF | 0.32 | 1.9 | 6.0 | 3.28 | 3.24 | 3.78 | 3.51 |
| 19 | Morin | 0.68 | 0.040 | 0.060 | 1.60 | 1.62 | 1.77 | 1.86 |
| 20 | Myr | 0.61 | 0.49 | 0.80 | 2.69 | 2.88 | 2.90 | 3.24 |
| 21 | 3573′4′PHF | 0.36 | 3.3 | 9.2 | 3.52 | 3.32 | 3.97 | 3.77 |
| 22 | 374′THF | 0.36 | 2.6 | 7.3 | 3.42 | 3.35 | 3.86 | 3.98 |
| 23 | Rha | 0.23 | 10 | 45 | 4.01 | 3.92 | 4.65 | 4.38 |
| 24c | 33′DHF | 0.11 | 3.1 | 29 | 3.50 | 3.47 | 4.44 | 4.27 |
| 25c | 35DHF | 0.25 | 1.9 | 7.4 | 3.27 | 3.48 | 3.87 | 3.74 |
| 26c | 3H2′3′DMF | 0.52 | 4.4 | 16 | 3.91 | 3.15 | 3.92 | 3.84 |
| 27c | 3H6MeF | 0.0616 | 6.75 | 110 | 3.83 | 3.61 | 5.04 | 4.76 |
| 28c | 3H74′DMF | 0.19 | 8.7 | 46 | 4.25 | 3.80 | 4.66 | 5.02 |
| 29c | Fisetin | 0.63 | 1.5 | 2.3 | 3.16 | 3.34 | 3.38 | 4.01 |
| 30c | 357THF | 0.68 | 7.4 | 11 | 3.87 | 3.95 | 4.04 | 3.83 |
Experimentally determined activities.
Calculated activities using the CoMFA models.
These compounds were used as a test set and are not included in the derivation of equations.
TABLE 3.
Summary of modeling parameters from CoMFA analysis
| Vmax Model | CLint Model | |
|---|---|---|
| q2a | 0.738 | 0.561 |
| SEPb | 0.383 | 0.561 |
| r2c | 0.976 | 0.938 |
| rpredd | 0.735 | 0.630 |
| S.E.e | 0.116 | 0.229 |
| Componentsf | 6 | 4 |
| Fg | 108.836 | 68.436 |
| Pr2 = 0h | 0.000 | 0.000 |
| Fraction | ||
| Steric | 0.395 | 0.450 |
| Electrostatic | 0.605 | 0.550 |
Cross-validated correlation coefficient after the leave-one-out procedure.
Cross-validated standard error of prediction.
Non-cross-validated correlation coefficient.
Correlation coefficient for test set predictions.
Standard error of estimate.
Optimum number of components.
F-test value.
Probability of obtaining the observed F ratio value by chance alone.
Results
Flavonol 3-O-Glucuronidation Kinetics by UGT1A9.
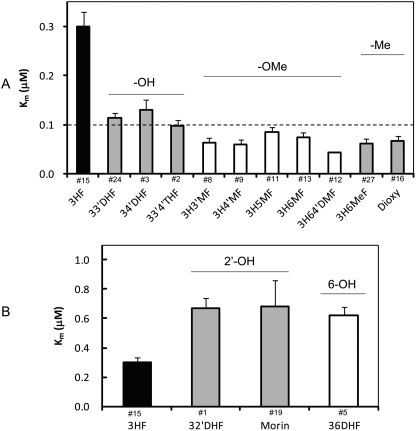
The kinetics profiles and derived kinetics parameters are listed in Supplemental Fig. S3 and Table 2, respectively. The Km values of 3-O-glucuronidation ranged from 0.042 to 0.68 μM (∼1 log unit difference) (Table 2). The unanimous low Km values (< 0.7 μM) suggested that the flavonol analogs bind strongly to the UGT1A9 for 3-OH catalysis. The structural elements contributing to lower Km values (or higher binding affinity) were identified as: substitutions of -OH at positions of C3′ or C4′; -OMe groups at C3′, C4′, C5, or C6; and -Me group at C6 (Fig. 2A). 3H64′DMF (compound 12) had the lowest Km value of 0.04 in the presence of two Km contributing elements (i.e., -OMe at both C4′ and C6). In contrast, -OH substitution at the 2′- or 6-position increased the Km values by >1-fold (Fig. 2B). The Km values reported here were not affected (i.e., increased) by the albumin effects as reported previously (Rowland et al., 2006).
Fig. 2.
Structural modifications affect the Km values of UGT1A9-mediated 3-O-glucuronidation. A, Km values were decreased in the presence of 1, substitutions of -OH at positions of C3′ or C4′; 2, -OMe groups at C3′, C4′, C5, or C6; or 3, -Me group at C6. B, Km values were increased by >1-fold with the additions of 2′-OH or 6-OH. The compound numbers are labeled above the abbreviated chemical names.
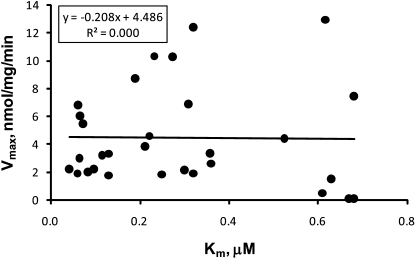
Vmax and CLint values of 3-O-glucuronidation ranged from 0.04 to 12.95 nmol/mg/min and 0.06 to 109.60 ml/mg/min, respectively (Table 2). The turnover of the enzyme (reflected by Vmax) varied more toward the flavonols (∼2.5 log folds) than the Km values. Correlation between Km and Vmax is depicted in Fig. 3. They seemed to be independent of each other with insignificant r2 value (correlation coefficient) of 0.000. Moreover, the ratio of Vmax over Km, CLint, displayed greater divergence (∼3.3 log folds). Vmax best describes the measured susceptibility of chemicals to be glucuronidated, whereas CLint defines the catalytic efficiency of the enzyme toward its substrates at low concentrations. Both Vmax and CLint were used to construct CoMFA models.
Fig. 3.
Scatter plot of Vmax and Km derived from kinetics of UGT1A9-mediated 3-O-glucuronidation of flavonols.
Pharmacophore Modeling.
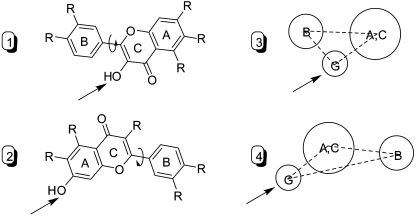
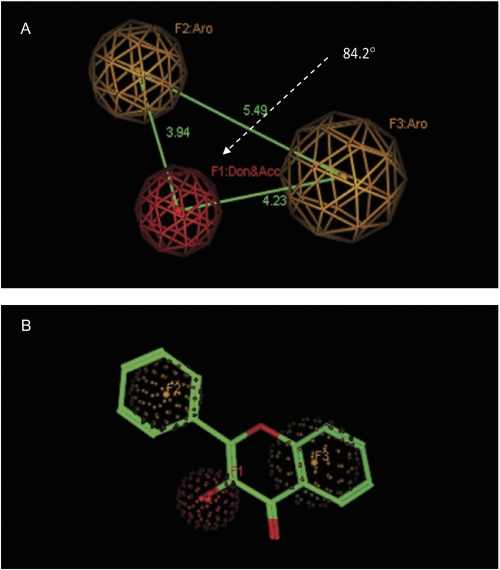
In addition to the glucuronidation site (i.e., hydroxyl group), hydrophobic features were considered in developing UGT isoform-specific pharmacophores, because they had been demonstrated to be critical for interactions between UGTs and their substrates (Sorich et al., 2002, 2008). In flavonol structure, the prominent hydrophobic features are the aromatic rings: B ring and A/C bicyclic ring. Conformation analysis revealed that two distinct orientation modes of flavonol were required to generate 3-O-glucuronide or 7-O-glucuronide (Fig. 4). In this article, the pharmacophore model was built based on 3-hydroxyflavone to capture the common interaction poses for 3-O-glucuronidation. The final pharmacophore query consisted of three features: one glucuronidation site (i.e., hydroxyl group), which is represented by “Don and Acc“ (F1) and two neighboring aromatic regions (F2 and F3), as illustrated graphically (Fig. 5). The “Don and Acc” feature was able to distinguish hydroxyl oxygen from other types of oxygens in the flavonol structures. The distances from the glucuronidation feature to the aromatic regions are 3.9 and 4.2 Å, respectively, and the angle between the glucuronidation feature and the two aromatic regions is 84.2°. The pharmacophore query was used to search against conformation database of 67 flavonoids including those from flavonoid subclasses of flavones, isoflavones, flavanone, chalcone, and flavonols. All of the flavonols were hit to match the three defined pharmacophoric features, whereas other flavonoids did not conform to this pharmacophore model.
Fig. 4.
Two hypothetically distinct flavonol orientations that are required to generate 3-O-glucuronide (1 or 3) and 7-O-glucuronide (2 or 4). Arrows indicate the site of glucuronidation. In 3 and 4, G stands for site of glucuronidation. A, B, and C indicate A-ring, B-ring, and C-ring, respectively.
Fig. 5.
A, 3-OH-specific pharmacophore model composed of one glucuronidation site (red sphere with radius of 1 Å) and two aromatic regions (yellow spheres with radius of 1.2 and 1.5 Å, respectively). B, 3-OH-specific pharmacophore model superimposed with 3HF (compound 15).
CoMFA Models.
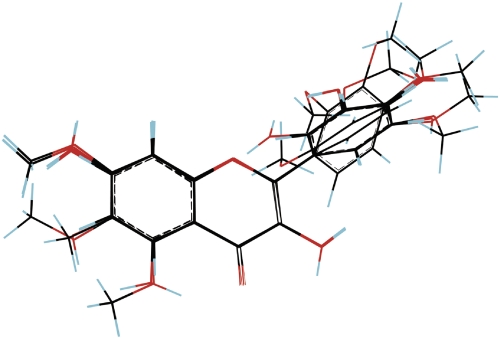
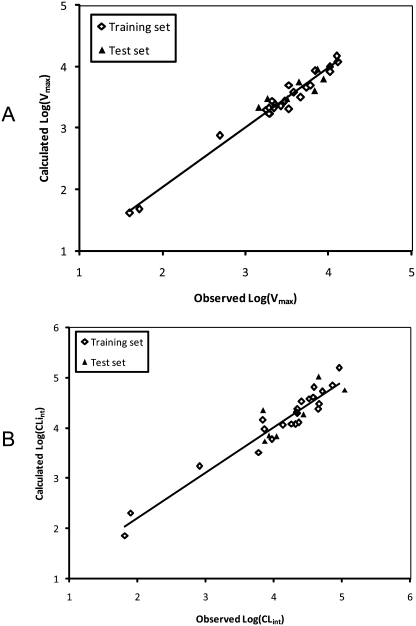
CoMFA modeling was performed using flavonol alignments based on a 3-OH-specific pharmacophore (Fig. 6). The flavonol conformers were presumed to be in the bioactive poses that interact with UGT1A9 to produce 3-O-glucuronides. CoMFA resulted in high-quality models for UGT1A9 (Vmax: q2 = 0.738, r2 = 0.976; CLint: q2 = 0.561, r2 = 0.938) (Table 3). For the Vmax model, the steric field descriptors explained 39.5% of the variance, whereas the electrostatic descriptors explained 60.5%. For the CLint model, the contributing proportions of steric and electrostatic fields to the variance were 45 and 55%, respectively. These models were validated by an external test set of seven compounds not included in the model construction. The predicted r2 values from the Vmax and CLint CoMFA models were found to be 0.735 and 0.630, respectively (Table 3). The predicted activity and experimental activity are listed in Table 2, and the correlations between them are depicted in Fig. 7.
Fig. 6.
Structural alignment for constructing the 3D QSAR CoMFA model generated from the 3-OH-specific pharmacophore.
Fig. 7.
Correlation between the experimental glucuronidation parameters and the predicted ones from the CoMFA models for the training and test sets (Vmax, A; CLint, B).
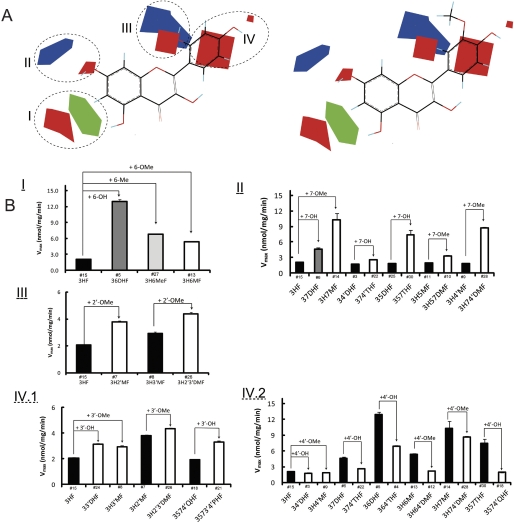
Figs. 8 and 9 show the steric (in green and yellow) and electrostatic (in blue and red) contours of CoMFA. The green contour defines an area where the presence of steric bulky groups would facilitate the UGT reaction. In contrast, the yellow contour indicates a region where bulky groups would diminish glucuronidation (not shown because it is unimportant). The blue contour denotes a space where UGT1A9 metabolism would benefit from electropositive atoms. Conversely, the red contour is a space where the presence of electronegative atoms would favor glucuronidation. Apparently no sterically disfavored regions (i.e., yellow areas) surrounded the molecules, indicating that the cavities of possible active site of UGT1A9 was very large. This was not surprising, because UGT1A9 also efficiently catalyzed compounds that were structurally much larger than flavonols (Luukkanen et al., 2005).
Fig. 8.
A, steric and electrostatic maps from the UGT1A9 CoMFA model of Vmax. Morin (compound 19; left) and isorhamnetin (compound 17; right) are shown inside the field for reference. Green indicates areas in which bulky groups are sterically favorable for glucuronidation. Blue indicates areas in which electropositive atoms are favorable for glucuronidation. Red indicates areas in which electronegative atoms are favorable for glucuronidation. B, matching of the CoMFA to experimental data. I, bulky groups at C6 increased Vmax values. II, 7-OH or 7-OMe increased Vmax values. III, 2′-OMe increased Vmax values. IV1, 3-OH or 3-OMe increased Vmax values. IV2, 4-OH or 4-OMe decreased Vmax values. The compound numbers are labeled above the abbreviated chemical names.
Fig. 9.
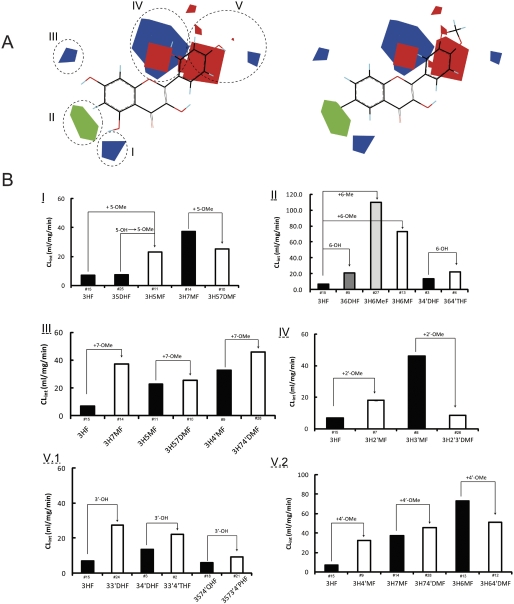
A, steric and electrostatic maps from the UGT1A9 CoMFA model of CLint. Morin (compound 19; left) and dioxy (compound 16; right) are shown inside the field for reference. Green indicates areas in which bulky groups are sterically favorable for glucuronidation. Blue indicates areas in which electropositive atoms are favorable for glucuronidation. Red indicates areas in which electronegative atoms are favorable for glucuronidation. B, matching of the CoMFA to experimental data. I, effect of 5-OMe on CLint was not well defined. II, bulky groups at C6 increased CLint values. III, 7-OMe increased CLint values. IV, effect of 2′-OMe on CLint was not well defined. V1, 3-OH increased CLint values. V2, effect of 4′-OMe on CLint was not well defined. The compound numbers are labeled above the abbreviated chemical names.
Vmax CoMFA Model of UGT1A9.
The contour map obtained from the Vmax CoMFA model is illustrated together with compound 19 (poor substrate; Fig. 8A, left) and compound 17 (good substrate; Fig. 8A, right). In the CoMFA contour map, the green (sterically favorable) and yellow (sterically unfavorable) contours represent 80 and 20% contributions, respectively. The blue (electropositive atom favorable) and red (electronegative atom favorable) contours in the CoMFA electrostatic field make 80 and 20% contributions, respectively. Four regions (designated as I, II, III, and IV) that contain the contours, indicating the relations between the properties of the substrates and Vmax values, were elucidated as follows.
In region I, the steric favorable green contour near the C6 indicates that the bulky group in the contour is important for glucuronidation. This can explain why the Vmax values of 36DHF (6-OH), 3H6MF (6-OMe), and 3H6MeF (6-Me) are generally higher than that of 3HF (6-H) (Fig. 8BI). There is also a red contour positioned (near the green proportion) a bit further from the C6. This contour can be reached and occupied by the hydrogens (electropositive atom) of methoxy group substituted at C6. The placement of electropositive atoms in this red area would disfavor the glucuronidation, which is consistent with the fact that 3H6MF (6-OMe) had lower Vmax than those of 36DHF (6-OH) and 3H6MeF (6-Me) (Fig. 8BI).
In region II, a small red polyhedron (occupied by electronegative oxygen of 7-OH or 7-OMe) and a blue contour (occupied by hydrogens of 7-OMe) aligned diagonally along the C7. It suggests that an electronegative atoms in the red polyhedron and/or electropositive atoms in the blue contour are favorable for UGT1A9 glucuronidation. Therefore, the presence of 7-OH or 7-OMe would contribute to higher Vmax values. This is supported by the comparisons between the structures and Vmax values: 3HF (7-H) < 37DHF (7-OH) < 3H7MF (7-OMe); 34′DHF (7-H) < 374′THF (7-OH); 35DHF (7-H) < 357THF(7-OH); 3H5MF(7-H) < 3H57DMF (7-OMe) and 3H4′MF (7-H)< 3H74′DMF (7-OMe) (Fig. 8BII).
In region III, the red contour slightly further away from the C2′ suggested an electropositive atom (or hydrogen attached to -OH) substitution would compromise the glucuronidation, as seen from the data that compound 1, 32′DHF, and compound 19, morin (with 2′-OH), had the smallest Vmax values (Table 2). A nearby large blue area that is occupied by multiple electropositive hydrogen atoms of 2′-OMe indicated that 2′-OMe contributes significantly to the glucuronidation. For this reason, 3H2′MF (2′-OMe) and 3H2′3′DMF (2′-OMe) had higher Vmax values than those of 3HF (2′-H) and 3H3′MF (2′-H), respectively (Fig. 8BIII).
For region IV, the big red contour is in the close vicinity of C3′, suggesting that glucuronidation would benefit from electronegative atoms such as oxygen in hydroxyl or methoxy groups placed in this area. This is consistent with the fact that Vmax values are increased in the presence of 3′-OH or 3′-OMe: 3HF (3′-H) < 33′DHF (3′-OH) or 3H3′MF (3′-OMe); 3H2′MF (3′-H) < 3H2′3′DMF (3′-OMe); and 3574′QHF (3′-H) < 3573′4′PHF (3′-OH) (Fig. 8BIV1). There is a small red contour (close to the hydrogen of 4′-OH) that can be occupied by electropositive hydrogens of 4′-OMe. It is suggested that electropositive atoms in or near this contour will be detrimental to the glucuronidation. Therefore, 4′-OH or 4′-OMe most likely would reduce the value of Vmax, which is evidenced from the observations: 3HF (4′-H) > 34′DHF (4′-OH) or 3H4′MF(4′-OMe); 37DHF (4′-H) > 374′THF (4′-OH); 36DHF (4′-H) > 364′THF (4′-OH); 3H6MF(4′-H) > 3H64′DMF(4′-OMe); 3H7MF (4′-H) > 3H74′DMF (4′-OMe); and 357THF (4′-H) > 3574′QHF (4′-OH) (Fig. 8BIV2).
CLint CoMFA Model of UGT1A9.
The contour map obtained from the CLint CoMFA model is shown with compound 19 (poor substrate; Fig. 9A, left) and compound 16 (good substrate; Fig. 9A, right). It is observed that five regions (designated as region I, II, III, IV, and V) contain the contours, indicating the relationships between the properties of the substituents and CLint values. In region I, the blue contour near C5 suggested that electropositive entities placed in this area would result in higher CLint values. This can be demonstrated by the fact that 3H5MF (5-OMe) is more efficiently metabolized than 3HF (5-H) or 35DHF (5-OH) (Fig. 9BI). However, 3H57DMF (5-OMe) had a smaller CLint than 3H7MF (5-H), indicating some uncertainties at this position.
In region II, a green contour presents around C6. It was reasoned that steric bulks substituted at C6 would enhance conjugation activity with higher CLint. This is supported by the fact that 36DHF (6-OH), 3H6MF (6-OMe), and 3H6MeF (6-Me) showed much higher catalytic efficiency than 3HF (6-H), and 364′THF (6-OH) had a higher CLint value than 34′THF (6-H) (Fig. 9BII).
In region III, the blue polyhedron near C7 suggested that the placement of electropositive atoms (e.g., hydrogens of 7-OMe) would increase the metabolism. This is in agreement with the observations (ordered in term of CLint values): 3H7Me (7-OMe) > 3HF (7-H); 3H74′DMF (7-OMe) > 3H4′MF (7-H); and 3H57DMF (7-OMe) > 3H5MF (7-H) (minor difference) (Fig. 9BIII).
In region IV, a red contour appears in the vicinity of C2′, which indicates electropositive atoms placed in this volume would be metabolism-unfavorable. This might explain why 32′DHF (2′-OH) and morin (2′-OH) showed the poorest glucuronidation with the smallest CLint values (Table 2). A nearby large blue area is shown to cover the electropositive hydrogens of 2′-OMe. The presence of 2′-OMe therefore is predicted to enhance the glucuronidation, which is experimentally interpreted by the fact that 3H2′MF (2′-OMe) was more efficiently glucuronidated than 3HF (2′-H). Unexpectedly, 3H2′3′MF (2′-OMe) had a CLint value smaller than that of 3H3′MF (2′-H) (Fig. 9BIV).
In region V, a big red contour shows around C3′/C4′. There is also a small red contour that is occupied by oxygen of 3′-OH. This can be indicate that glucuronidation would benefit from the electronegative atoms (e.g., oxygen of -OH) in the area, as evidenced by the fact that 3HF (3′-H), 34′DHF (3′-H) and 3574′QHF (3′-H) were less metabolized (smaller Clint values) than 33′DHF (3′-OH), 33′4′THF (3′-OH), and 3573′4′PHF (3′-OH), respectively (Fig. 9BV1). A blue contour situates in the vicinity of C4′, which can be occupied by electropositive hydrogens of the 4′-OMe group. It is suggested that CLint will increased in the presence of 4′-OMe, as supported by the fact that 3HF (4′-H) and 3H7MF (4′-H) were less efficiently glucuronidated by 3H4′MF (4′-OMe) and 3H74′DMF (4′-OMe), respectively. However, the addition of 4′-OMe in 3H64′MF did not result in a higher CLint value compared with 3H6MF (4′-H) (Fig. 9BV2).
Discussion
We have constructed successfully for the first time in silico models for glucuronidation of flavonols by human UGT1A9 that focused on predicting Vmax and CLint of 3-O-glucuronidation. 2D/3D QSAR models developed for UGTs (Sorich et al., 2002, 2008; Smith et al., 2004) have predicted the substrate selectivity and/or binding affinity of inhibitors [as reflected by low apparent inhibitor constant (Ki,app)]. However, Vmax or CLint is more relevant for defining the susceptibility of chemicals to be metabolized and reflect the in vivo biotransformation efficiency by individual human UGT isoforms (at low physiological concentrations at or below 1 μM), because higher substrate affinity toward UGTs does not always translate to faster glucuronidation rates. For example, 3-hydroxyflavone (Ki,app = 3.5 μM) binds much strongly to UGT1A9 than naringenin (Ki,app = 219 μM) (Smith et al., 2004), but 3-hydroxyflavone (1.99 ± 0.09 nmol/mg/min) was glucuronidated slower than naringenin (3.26 ± 0.07 nmol/mg/min) at 10 μM by UGT1A9 (rates at additional concentrations are in Supplemental Materials). The relevance of using Vmax or CLint would be even greater if UGT1A9 protein levels in recombinant microsomes and human tissue microsomes could be quantified.
This article validates our approach of quantitatively describing the position (3-OH)-specific (or regiospecific) glucuronidation using in silico models. It directly tackles the challenges of predicting UGT metabolism of flavonols in silico that potentially generate multiple conjugates. Successful implementation of this approach to other hydroxyl groups will allow the estimation of overall glucuronidation of multihydroxyl flavonols (by summation of predicted values from the separate position specific models). It is consistent with the hypothesis of Miners et al. (2004), who stated that “multiple binding modes within the aglycone-binding domain are required to generate multiple metabolites from single substrate that bears more than one nucleophilic group.” Because available 3D QSAR algorithms are based on only one presumed bioactive conformation corresponding to each ligand (i.e., one binding mode), it hinders one-step prediction of formation of multiple monoglucuronides from a single substrate with more than one nucleophilic site. This limitation can be readily observed in the pharmacophore models. Mapping of quercetin into UGT1A9 pharmacophore generated by using the substrates with great structural diversity (Miners et al., 2004) indicates 3′-OH is the only site of glucuronidation, which is in conflict with the fact that UGT1A9 generates multiple glucuronides from quercetin (Chen et al., 2005; Singh et al., 2010).
We chose to model 3-O-glucuronidation of flavonols using CoMFA, a widely recognized 3D QSAR technique for modeling biological properties. The main advantages of CoMFA include: 1) it has the ability to display the model graphically and 2) it allows inference regarding binding pocket geometry. Up to 3155 hits were generated by a PubMed search (conducted on August 20, 2010) using “comparative molecular field analysis” or “CoMFA” as keywords. In contrast, linear or nonlinear regression models based on 2D/3D descriptors showed good predictability, but the interpretation of important features and descriptors is difficult (Sorich et al., 2008). As stated by Chohan et al. (2006), the QSAR model is more like a “black box,” with only computers able to interpret which molecular properties modulate the metabolism.
The predictive CoMFA models of UGT1A9 can be used to guide the design of novel flavonol with desired UGT metabolism or predict 3-O-glucuronidation of untested analogs. From the perspective of reducing metabolism, introduction of multiple electropositive atoms or groups (e.g., hydrogens of -OH) to the B-ring would result in poor 3-O-glucuronidation by UGT1A9. On the contrary, fast conjugation of 3-OH may result from substrates with bulky substituents at C6 or electronegative atoms or groups (e.g., -Cl, -F, and -O of methoxy group) around the B-ring. As advancement is made in quantitation technologies of specific UGT isoforms, it is envisioned that successful prediction of glucuronidation by major metabolizing isoforms would enable the precise estimation of the UGT metabolism at the tissue/organ level (e.g., liver, intestine, and kidney) (Tang et al., 2010). In addition, the CoMFA model highlighted the significant role of electrostatic potential (i.e., electronegative versus electropositive entity) in determining UGT1A9-mediated glucuronidation. This structural property was also shown to be the key descriptor in the successful modeling of UGT1A9-catalyzed glucuronidation of phenols (Ethell et al., 2002). This important information will be used to guide future descriptor selection or model refinement in 2D/3D QSAR modeling of UGT1A9 using a more diverse dataset, because UGT1A9 was shown to present more challenges for in silico modeling (Smith et al., 2004).
The success of CoMFA modeling in turn corroborated the underlying assumption about the alignment of bioactive poses, suggesting the aglycones interact with UGT1A9 protein using a similar mode to generate 3-O-glucuronide. Hence, it lends strong support to the hypothesis that multiple distinct binding modes are required to generate different glucuronide isomers by UGT1A9, if not all UGT1A, isoforms. It is noteworthy that plant UGTs (e.g., UGT71G1, VvGT1, and UGT78G1) with crystal structures possess the big catalytic cavities in the aglycone-binding domain. The binding pocket with sufficient space permits the distinct orientations from single flavonoids that render the respective hydroxyl groups for conjugation (Osmani et al., 2009). Because of the marked similarity of catalytic mechanisms between human and plant UGTs (Patana et al., 2008), UGT1A9 may also have a large aglycone-binding domain that serves as the molecular basis for generating multiple metabolites. This assumed large binding pocket is also supported by the CoMFA contours that did not show any steric disfavoring areas (Figs. 8 and 9). Therefore, only an algorithm that considers all of the active conjugation sites will allow acceptable prediction of the overall glucuronidation rates of flavonols with multiple hydroxyl groups. Because different hydroxyl groups of a flavonol or other flavones may be predominantly metabolized by a particular isoform, this type of modeling must be extended to multiple UGT isoforms if we were able to successfully extend this approach to predict the metabolism of flavonols at all sites.
An interesting discovery is that the linkage between Km and the enzyme turnover is weak if they are present at all (Fig. 3). Our data clearly showed that compared with Vmax or CLint, Km is less susceptible to minor structural changes. In addition, kinetics profiling of positional (3-O- and 7-O-) glucuronidation showed identical Km but divergent Vmax (data not shown). This might indicate that the UGT1A9 protein adopts distinct conformations for aglycone binding and product expelling/releasing, because the turnover is determined in a large part by the departure of product (3-O-glucuronides). This hypothesis is supported by the fact that UGTs undergo dramatic conformation changes during catalysis (Laakkonen and Finel, 2010). Therefore, as mentioned earlier, conventional use of Km or Ki as indicators of substrate selectivity might lead to erroneous interpretation of interaction between substrates and UGT1As. Although independent from Vmax, Km influenced the modeling results between Vmax and CLint. For example, 4′-OMe is unfavorable for Vmax, but favorable for CLint (Figs. 8IV and 9V2).
The predictability of the current model might be compromised by the unevenly distributed activity [e.g., existing gap of 1.8–2.8 for Log (Vmax)], especially when those compounds that are to be predicted have activities fall into the gaps. Refinement of the model seems to be essential by adding those flavonols whose activity can fill in those gaps. However, considering the remarkable similarity of the chemical structures between the modeled compounds, but divergent activity spanning ∼ 3 log orders, the model seemed to be able to sufficiently capture the key chemical characteristics associated with the modeled parameters. This is evidenced by the establishment of a predictive model with strong statistical significance, as well as the consistency between experimental results and the contour maps. Therefore, the current CoMFA models are insightful with acceptable predictability.
In conclusion, 3D QSAR study of UGT1A9 flavonols was carried out using pharmacophore-based CoMFA. The constructed CoMFA models possessed good internal and external consistency and showed statistical significance and predictive abilities (Vmax model: q2 = 0.738, r2 = 0.976, rpred2 = 0.735; CLint model: q2 = 0.561, r2 = 0.938, rpred2 = 0.630). The contour maps from CoMFA clearly indicated key structural characteristics (e.g., electropositive entities at C2′ or C3′) that were associated with poor 3-O-glucuronidation. The results suggested that the approach of coupling CoMFA analysis with pharmacophoric alignments is viable for constructing predictive models regarding regiospecific or 3-O-glucuronidation of flavonols by UGT1A9.
Supplementary Material
Acknowledgments
We thank Dr. Xiaoqiang Wang of the Nobel Foundation for suggestions and comments about this article.
This work was supported by the National Institutes of Health National Institute of General Medical Sciences [Grant GM070737] (to M.H.).
Article, publication date, and citation information can be found at http://jpet.aspetjournals.org.
doi:10.1124/jpet.110.175356.
The online version of this article (available at http://jpet.aspetjournals.org) contains supplemental material.
- UGT
- UDP-glucuronosyltransferase
- CoMFA
- comparative molecular field analysis
- UPLC
- ultra performance liquid chromatography
- CLint
- intrinsic clearance
- 2D
- two-dimensional
- 3D
- three-dimensional
- QSAR
- quantitative structure-activity relationship
- HF
- hydroxyflavone
- DHF
- dihydroxyflavone
- THF
- trihydroxyflavone
- QHF
- tetrahydroxyflavone
- RMS
- root mean square.
Authorship Contributions
Participated in research design: Wu, Zhang, and Hu.
Conducted experiments: Wu, Morrow, and Singh.
Contributed new reagents or analytic tools: Morrow and Zhang.
Performed data analysis: Wu and Hu.
Wrote or contributed to the writing of the manuscript: Wu and Hu.
Other: Hu acquired funding for the research.
References
- Andersen OM, Markham KR. (2006) Flavonoids – Chemistry, Biochemistry and Applications. CRC Taylor & Francis, Boca Raton, FL [Google Scholar]
- Barreca ML, Carotti A, Carrieri A, Chimirri A, Monforte AM, Calace MP, Rao A. (1999) Comparative molecular field analysis (CoMFA) and docking studies of non-nucleoside HIV-1 RT inhibitors (NNIs). Bioorg Med Chem 7:2283–2292 [DOI] [PubMed] [Google Scholar]
- Barve A, Chen C, Hebbar V, Desiderio J, Saw CL, Kong AN. (2009) Metabolism, oral bioavailability and pharmacokinetics of chemopreventive kaempferol in rats. Biopharm Drug Dispos 30:356–365 [DOI] [PMC free article] [PubMed] [Google Scholar]
- Birt DF, Hendrich S, Wang W. (2001) Dietary agents in cancer prevention: flavonoids and isoflavonoids. Pharmacol Ther 90:157–177 [DOI] [PubMed] [Google Scholar]
- Chen Y, Xie S, Chen S, Zeng S. (2008) Glucuronidation of flavonoids by recombinant UGT1A3 and UGT1A9. Biochem Pharmacol 76:416–425 [DOI] [PubMed] [Google Scholar]
- Chen YK, Chen SQ, Li X, Zeng S. (2005) Quantitative regioselectivity of glucuronidation of quercetin by recombinant UDP-glucuronosyltransferases 1A9 and 1A3 using enzymatic kinetic parameters. Xenobiotica 35:943–954 [DOI] [PubMed] [Google Scholar]
- Chohan KK, Paine SW, Waters NJ. (2006) Quantitative structure activity relationships in drug metabolism. Curr Top Med Chem 6:1569–1578 [DOI] [PubMed] [Google Scholar]
- Christopoulos A, Lew MJ. (2000) Beyond eyeballing: fitting models to experimental data. Crit Rev Biochem Mol Biol 35:359–391 [DOI] [PubMed] [Google Scholar]
- Cramer RD, III, Patterson DE, Bunce JD. (1988) Comparative molecular field analysis (CoMFA). 1. Effect of shape on binding of steroids to carrier proteins. J Am Chem Soc 110:5959–5967 [DOI] [PubMed] [Google Scholar]
- D'Archivio M, Filesi C, Di Benedetto R, Gargiulo R, Giovannini C, Masella R. (2007) Polyphenols, dietary sources and bioavailability. Ann Ist Super Sanita 43:348–361 [PubMed] [Google Scholar]
- Erlund I, Freese R, Marniemi J, Hakala P, Alfthan G. (2006) Bioavailability of quercetin from berries and the diet. Nutr Cancer 54:13–17 [DOI] [PubMed] [Google Scholar]
- Ethell BT, Ekins S, Wang J, Burchell B. (2002) Quantitative structure activity relationships for the glucuronidation of simple phenols by expressed human UGT1A6 and UGT1A9. Drug Metab Dispos 30:734–738 [DOI] [PubMed] [Google Scholar]
- Fisher MB, Paine MF, Strelevitz TJ, Wrighton SA. (2001) The role of hepatic and extrahepatic UDP-glucuronosyltransferases in human drug metabolism. Drug Metab Rev 33:273–297 [DOI] [PubMed] [Google Scholar]
- Fujiwara R, Nakajima M, Yamamoto T, Nagao H, Yokoi T. (2009) In silico and in vitro approaches to elucidate the thermal stability of human UDP-glucuronosyltransferase (UGT) 1A9. Drug Metab Pharmacokinet 24:235–244 [DOI] [PubMed] [Google Scholar]
- Haji-Momenian S, Rieger JM, Macdonald TL, Brown ML. (2003) Comparative molecular field analysis and QSAR on substrates binding to cytochrome p450 2D6. Bioorg Med Chem 11:5545–5554 [DOI] [PubMed] [Google Scholar]
- Holder S, Lilly M, Brown ML. (2007) Comparative molecular field analysis of flavonoid inhibitors of the PIM-1 kinase. Bioorg Med Chem 15:6463–6473 [DOI] [PubMed] [Google Scholar]
- Iyanagi T. (2007) Molecular mechanism of phase I and phase II drug-metabolizing enzymes: implications for detoxification. Int Rev Cytol 260:35–112 [DOI] [PubMed] [Google Scholar]
- Jancova P, Anzenbacher P, Anzenbacherova E. (2010) Phase II drug metabolizing enzymes. Biomed Pap Med Fac Univ Palacky Olomouc Czech Repub 154:103–116 [DOI] [PubMed] [Google Scholar]
- Joseph TB, Wang SW, Liu X, Kulkarni KH, Wang J, Xu H, Hu M. (2007) Disposition of flavonoids via enteric recycling: enzyme stability affects characterization of prunetin glucuronidation across species, organs, and UGT isoforms. Mol Pharm 4:883–894 [DOI] [PMC free article] [PubMed] [Google Scholar]
- Laakkonen L, Finel M. (2010) A molecular model of the human UDP-glucuronosyltransferase 1A1, its membrane orientation, and the interactions between different parts of the enzyme. Mol Pharmacol 77:931–939 [DOI] [PubMed] [Google Scholar]
- Luukkanen L, Taskinen J, Kurkela M, Kostiainen R, Hirvonen J, Finel M. (2005) Kinetic characterization of the 1A subfamily of recombinant human UDP-glucuronosyltransferases. Drug Metab Dispos 33:1017–1026 [DOI] [PubMed] [Google Scholar]
- Mackenzie PI, Bock KW, Burchell B, Guillemette C, Ikushiro S, Iyanagi T, Miners JO, Owens IS, Nebert DW. (2005) Nomenclature update for the mammalian UDP glycosyltransferase (UGT) gene superfamily. Pharmacogenet Genomics 15:677–685 [DOI] [PubMed] [Google Scholar]
- Miners JO, Smith PA, Sorich MJ, McKinnon RA, Mackenzie PI. (2004) Predicting human drug glucuronidation parameters: application of in vitro and in silico modeling approaches. Annu Rev Pharmacol Toxicol 44:1–25 [DOI] [PubMed] [Google Scholar]
- Ohno S, Nakajin S. (2009) Determination of mRNA expression of human UDP-glucuronosyltransferases and application for localization in various human tissues by real-time reverse transcriptase-polymerase chain reaction. Drug Metab Dispos 37:32–40 [DOI] [PubMed] [Google Scholar]
- Osmani SA, Bak S, Møller BL. (2009) Substrate specificity of plant UDP-dependent glycosyltransferases predicted from crystal structures and homology modeling. Phytochemistry 70:325–347 [DOI] [PubMed] [Google Scholar]
- Otake Y, Hsieh F, Walle T. (2002) Glucuronidation versus oxidation of the flavonoid galangin by human liver microsomes and hepatocytes. Drug Metab Dispos 30:576–581 [DOI] [PubMed] [Google Scholar]
- Patana AS, Kurkela M, Finel M, Goldman A. (2008) Mutation analysis in UGT1A9 suggests a relationship between substrate and catalytic residues in UDP-glucuronosyltransferases. Protein Eng Des Sel 21:537–543 [DOI] [PubMed] [Google Scholar]
- Ross JA, Kasum CM. (2002) Dietary flavonoids: bioavailability, metabolic effects, and safety. Annu Rev Nutr 22:19–34 [DOI] [PubMed] [Google Scholar]
- Rowland A, Elliot DJ, Williams JA, Mackenzie PI, Dickinson RG, Miners JO. (2006) In vitro characterization of lamotrigine N2-glucuronidation and the lamotrigine-valproic acid interaction.Drug Metab Dispos 34:1055–1062 [DOI] [PubMed] [Google Scholar]
- Said M, Ziegler JC, Magdalou J, Elass A, Vergoten G. (1996) Inhibition of bilirubin Udp-glucuronosyltransferase: a comparative molecular field analysis (COMFA). Quant Struct Act Relat 15:382–388 [Google Scholar]
- Singh R, Wu B, Tang L, Liu Z, Hu M. (2010) Identification of the position of mono-O-glucuronide of flavones and flavonols by analyzing shift in online UV spectrum (λmax) generated from an online diode-arrayed detector. J Agric Food Chem 58:9384–9395 [DOI] [PMC free article] [PubMed] [Google Scholar]
- Smith PA, Sorich MJ, Low LS, McKinnon RA, Miners JO. (2004) Towards integrated ADME prediction: past, present and future directions for modelling metabolism by UDP-glucuronosyltransferases. J Mol Graph Model 22:507–517 [DOI] [PubMed] [Google Scholar]
- Smith PA, Sorich MJ, McKinnon RA, Miners JO. (2003) In silico insights: chemical and structural characteristics associated with uridine diphosphate glucuronosyltransferase substrate selectivity. Clin Exp Pharmacol Physiol 30:836–840 [DOI] [PubMed] [Google Scholar]
- Sorich MJ, Smith PA, McKinnon RA, Miners JO. (2002) Pharmacophore and quantitative structure activity relationship modelling of UDP-glucuronosyltransferase 1A1 (UGT1A1) substrates. Pharmacogenetics 12:635–645 [DOI] [PubMed] [Google Scholar]
- Sorich MJ, Smith PA, Miners JO, Mackenzie PI, McKinnon RA. (2008) Recent advances in the in silico modelling of UDP glucuronosyltransferase substrates. Curr Drug Metab 9:60–69 [DOI] [PubMed] [Google Scholar]
- Tang L, Singh R, Liu Z, Hu M. (2009) Structure and concentration changes affect characterization of UGT isoform-specific metabolism of isoflavones. Mol Pharm 6:1466–1482 [DOI] [PMC free article] [PubMed] [Google Scholar]
- Tang L, Ye L, Singh R, Wu B, Lv C, Zhao J, Liu Z, Hu M. (2010) Use of glucuronidation fingerprinting to describe and predict mono- and dihydroxyflavone metabolism by recombinant UGT isoforms and human intestinal and liver microsomes. Mol Pharm 7:664–679 [DOI] [PMC free article] [PubMed] [Google Scholar]
- Wei DG, Yang GF, Wan J, Zhan CG. (2005) Binding model construction of antifungal 2-aryl-4-chromanones using CoMFA, CoMSIA, and QSAR analyses. J Agric Food Chem 53:1604–1611 [DOI] [PubMed] [Google Scholar]
- Wong YC, Zhang L, Lin G, Zuo Z. (2009) Structure-activity relationships of the glucuronidation of flavonoids by human glucuronosyltransferases. Expert Opin Drug Metab Toxicol 5:1399–1419 [DOI] [PubMed] [Google Scholar]
Associated Data
This section collects any data citations, data availability statements, or supplementary materials included in this article.


