

Abstract
Background
Recent information suggests that the Age-Related Eye Disease Study (AREDS) supplement, enhanced intake of docosahexaenoic acid (DHA) and eicosapentaenoic acid (EPA), and reducing dietary glycaemic index (dGI) are protective against advanced age-related macular degeneration (AMD).
Methods
Dietary information was collected at baseline, and fundus photograph grades were obtained during the 8-year trial period from 2924 eligible AREDS AMD trial participants. Using the eye as the unit of analysis and multifailure Cox proportional-hazards regression, the risk of AMD progression was related to dietary intake in the four arms of the trial.
Results
Independent of AREDS supplementation, higher intakes of DHA (≥64.0 vs <26.0 mg/day) (hazard ratio (HR) = 0.73, 95% confidence interval (CI), 0.57 to 0.94), EPA (≥42.3 vs <12.7 mg/day) (HR = 0.74, 95% CI 0.59 to 0.94), and lower dGI (dGI, <75.2 vs ≥81.5) (HR = 0.76, 95% CI 0.60 to 0.96) were associated with a lower risk for progression to advanced AMD. Participants consuming a lower dGI and higher DHA or EPA had the lowest risk (p value for synergistic interaction <0.001). Only participants in the “placebo” (p value for antagonistic interaction = 0.006) benefited from a higher DHA intake against early AMD progression (HR = 0.58, 95% CI 0.37 to 0.92; Ptrend = 0.01).
Conclusions
The findings show an association of consuming a diet rich in DHA with a lower progression of early AMD. In addition to the AREDS supplement, a lower dGI with higher intakes of DHA and EPA was associated with a reduced progression to advanced AMD.
Age-related macular degeneration (AMD) is a major cause of blindness.1 As the proportion of elderly is growing rapidly, AMD has become a major personal and global public health concern.2 There is no cure for this devastating disease, so there is a high premium on preventing it or delaying its progress to stages resulting in visual loss. Many observational studies suggest that a higher dietary antioxidant intake is associated with reduced risk for AMD, and data from a randomised, placebo-controlled, intervention trial, the Age-Related Eye Disease Study (AREDS), also showed that people at risk of developing advanced AMD would benefit by taking high-dose antioxidants (vitamin C, vitamin E, beta-carotene) plus zinc oxide.3-9 Considerable evidence also suggests that lutein, zeaxanthin and omega-3 fatty acids (docosahexaenoic acid (DHA) and eicosapentaenoic acid (EPA)) may be protective against AMD.3 10 Data from both cross-sectional and prospective studies in the Nutrition and Vision Project of the Nurses’ Health Study11 and the AREDS12 13 suggest that lowering the dietary glycaemic index (dGI; see Assessment of dietary variables) reduces the risk for AMD. However, no study has evaluated the potential interactions between dietary intakes of the above-mentioned nutrients and AREDS supplementation on the risk for AMD. In this study, we used data from the AREDS AMD trial to evaluate these relationships.
METHODS
Study subjects
Detailed recruitment criteria of the AREDS have been described extensively in the AREDS report series. A total of 3640 eligible participants were recruited in the AMD trial and randomly assigned to receive daily oral tablets containing: (1) placebo; (2) antioxidants (vitamin C, 500 mg; vitamin E, 400 IU; and beta carotene, 15 mg); (3) zinc, 80 mg, as zinc oxide and copper, 2 mg, as cupric oxide; or (4) antioxidants plus zinc.4 Zinc was only administered in persons in groups 2–5.4 The flow chart in fig 1 describes the disposition of study subjects (n = 2924 persons) in the present study.
Figure 1.
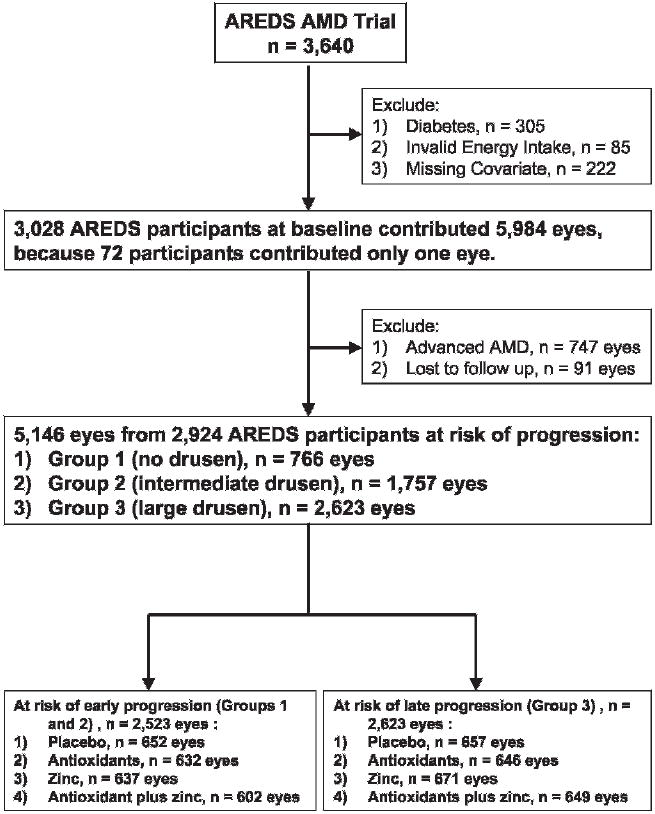
Flow chart describing disposition of eligible participants at risk of age-related macular degeneration (AMD) progression from the Age-Related Eye Disease Study (AREDS) AMD trial.
Procedures
Data on possible risk factors for AMD were obtained from a baseline general physical and ophthalmic examination, a detailed questionnaire on basic characteristics and demographic data, and a validated food-frequency questionnaire (FFQ).
Stereoscopic fundus photographs of the macula were taken and graded at baseline, at the 2-year visit, and annually thereafter during the 8-year (mean: 5.4 years) of follow-up using the AREDS protocol and AMD Classification System.4 Eyes were classified into one of five groups, numbered serially and based on increasing severity of drusen or type of AMD: Group 1, 2 and 3 defined here as early AMD, and Groups 4 and 5 defined here as advanced AMD.12 13
Assessment of outcomes
We considered the time to the first maximal AMD progression of studied eyes during the 8-year study period.13 Progression for a study eye was defined by a more advanced AMD grade (see Procedures) than the baseline grade. An “event” of AMD progression was defined as the occurrence of the first maximal AMD progression in one eye at a single visit (see details in previous publication).13
Assessment of dietary variables
A validated 90-item modified Block FFQ was administered to AREDS participants at baseline.14
Dietary glycaemic index
The glycaemic index (GI), a physiological measure of the glycaemic quality of carbohydrate-containing foods, measures how fast a food raises blood glucose.15 The GI values for foods in the FFQ were either derived from published values using white bread as the reference food or imputed from GI values of comparable foods.16 The dietary glycaemic index (dGI) for each subject was calculated as the weighted average of the GI values for each food item, with the amount of carbohydrate consumed from each food item as the weight (Σ(GIi×Wi)/W).17 Because only available carbohydrate is absorbed in the intestine and enters the blood circulation, fibre content was subtracted from the carbohydrate content.15
All nutritional variables were adjusted for total energy intake using the residuals method.18
Statistical analyses
We used eyes as the unit in our analyses relating dietary risk factors, including vitamin C, vitamin E, beta-carotene, zinc, lutein plus zeaxanthin, DHA, EPA and dGI, to the risk for AMD progression. AMD outcome and time to the first maximal progression during the 8-year follow-up period (see Assessment of outcomes) were used to calculate multivariate-adjusted hazard ratios (HRs) and 95% CIs by Cox proportional-hazards models using SAS (version 9.1; SAS Institute, Cary, North Carolina) PROC PHREG (tables 2-4). The Kaplan–Meier survival curves showed a gradually bifurcated pattern without any obvious crossing, which indicated no profound violation of the proportional hazard assumption.13 The Andersen–Gill multifailure method was applied to the data to estimate the regression coefficients and account for the lack of independence between two eyes from the same individual.13 19 In multivariate models adjusted for the types of AREDS intervention and other covariates, we first evaluated the global relationships in Group 1 or 2 eyes at baseline for early AMD progression and in Group 3 eyes at baseline for progression to advanced AMD (Group 4 or 5) (table 2). Therefore, the global models evaluated the effects of dietary nutrients independent of the type of AREDS intervention. Participants were categorised into quartile groups according to their dietary nutrient intakes or dGI. For nutrient analyses, those in the first (lowest) quartile group of nutrient intake served as the reference. For dGI analysis, those in the fourth (highest) quartile group of dGI (≥81.5) served as the reference. A multiplication interaction term was included in the model to test if the effect of the dietary nutrient varied by types of AREDS intervention. The p value for interaction was derived from the p value of the coefficient for the interaction term of the model. For those dietary nutrients with significant (p<0.05) or suggestive (0.05≤p<0.1) trends or interactions, we further evaluated the relationships stratified by the four types of AREDS intervention (tables 3, 4). All p values were not adjusted for multiple comparisons.
Table 2.
Associations between dietary intakes and risk of age-related macular degeneration (AMD) progression independent of type of Age-Related Eye Disease Study (AREDS) intervention in the AREDS AMD trial*
| Dietary intake | Multivariate-adjusted hazard ratio (95% confidence interval) |
|
|---|---|---|
| Early AMD progression |
Late AMD progression† |
|
| n = 2523 | n = 2623 | |
| Beta-carotene | ||
| Q2 (1.5–2.2 mg/day) | 1.02 (0.85 to 1.22) | 0.97 (0.80 to 1.19) |
| Q3 (2.2–3.2 mg/day) | 0.98 (0.80 to 1.18) | 1.11 (0.90 to 1.37) |
| Q4 (≥3.2 mg/day) | 0.97 (0.77 to 1.21) | 1.24 (0.96 to 1.59) |
| p Value for trend | 0.68 | 0.07 |
| p Value for interaction‡ | 0.66 | 0.56 |
| Docosahexaenoic acid | ||
| Q2 (26.0–41.9 mg/day) | 1.13 (0.95 to 1.34) | 0.97 (0.80 to 1.18) |
| Q3 (41.9–64.0 mg/day) | 0.98 (0.81 to 1.18) | 1.04 (0.85 to 1.28) |
| Q4 (≥64.0 mg/day) | 1.09 (0.88 to 1.35) | 0.73 (0.57 to 0.94) |
| p Value for trend | 0.79 | 0.06 |
| p Value for interaction‡ | 0.006 | 0.71 |
| Eicosapentaenoic acid | ||
| Q2 (12.7–24.6 mg/day) | 1.07 (0.90 to 1.28) | 0.91 (0.75 to 1.11) |
| Q3 (24.6–42.3 mg/day) | 1.01 (0.84 to 1.21) | 1.03 (0.85 to 1.24) |
| Q4 (≥42.3 mg/day) | 1.01 (0.83 to 1.23) | 0.74 (0.59 to 0.94) |
| p Value for trend | 0.88 | 0.08 |
| p Value for interaction‡ | 0.18 | 0.22 |
| Low-glycaemic index§ | ||
| 78.6–81.5 | 1.15 (0.96 to 1.38) | 0.80 (0.67 to 0.97) |
| 75.2–78.6 | 1.05 (0.87 to 1.28) | 0.77 (0.63 to 0.94) |
| <75.2 | 1.03 (0.83 to 1.29) | 0.76 (0.60 to 0.96) |
| p Value for trend | 0.97 | 0.02 |
| p Value for interaction‡ | 0.88 | 0.04 |
All analyses used eyes as the unit. The multivariate-adjusted hazard ratios (HR) (95% CIs) were calculated using the first quartile group of the nutrient intake as the referent and estimated the global effects of nutrients independent of type of AREDS intervention. The following were considered as potential covariates in our analyses: age, gender, education level (college or higher, and high school or less), race (white and others), body mass index (BMI, computed from weight and height; kg/m2), smoking status (past, current, and never), alcohol drinking (g/day), sunlight exposure (h/day), hypertension history, baseline AMD classification, presence of lens opacity, refractive error (hyperopic and myopic), Centrum use during the trial period, total calorie intake, and energy-adjusted dietary variables including carbohydrate, protein, fat, polyunsaturated fatty acids, arachidonic acid, docosahexaenoic acid (DHA), eicosapentaenoic acid (EPA), lutein plus zeaxanthin, folic acid, niacin, riboflavin, thiamine, vitamin C, vitamin E, beta-carotene and zinc. The p value for interaction evaluated if the association varied by type of AREDS intervention. The four interventions are (1) the full AREDS formulation (vitamin C, vitamin E, beta-carotene and zinc), (2) the AREDS antioxidant formulation (vitamin C, vitamin E and beta-carotene), (3) the AREDS zinc formulation and (4) placebo.
Data were also examined for DHA and EPA by progression to Group 4 (geographic atrophy, GA) (HR = 0.63, 95% CI 0.43 to 0.93, p value for trend = 0.12 for DHA; HR = 0.69, 95% CI 0.49 to 0.98, p value for trend = 0.10 for EPA) and Group 5 (neovascular AMD, NV) (HR = 0.77, 95% CI 0.55 to 1.08, p value for trend = 0.15 for DHA; HR = 0.73, 95% CI 0.54 to 0.99, p value for trend = 0.15 for EPA), separately. The results comparing the highest quartile range of intake with the lower 75% further supported the findings that higher intake of DHA (HR = 0.64, 95% CI 0.47 to 0.86 for GA; HR = 0.75, 95% CI 0.58 to 0.96 for NV) or EPA (HR = 0.74, 95% CI 0.56 to 0.98 for GA; HR = 0.74, 95% CI 0.58 to 0.94 for NV) are protective against progression to the two forms of advanced AMD.
The p value for interaction tests if the effect of the dietary nutrient varied by types of AREDS intervention.
The “Low glycaemic index” analyses used the highest quartile group of dietary glycaemic index (dGI) (≥81.5) as the referent.
Table 4.
Associations between dietary intakes and risk of progression to advanced age-related macular degeneration by types of Age-Related Eye Disease Study intervention*
| Dietary intake | Multivariate-adjusted hazard ratio (95% confidence interval) |
|||
|---|---|---|---|---|
| Placebo |
Antioxidants |
Zinc |
Antioxidants plus zinc |
|
| n = 657 | n = 646 | n = 671 | n = 649 | |
| Beta-carotene | ||||
| Q2 (1.5–2.2 mg/day) | 0.96 (0.64 to 1.43) | 1.12 (0.75 to 1.69) | 1.08 (0.74 to 1.57) | 0.80 (0.52 to 1.24) |
| Q3 (2.2–3.2 mg/day) | 0.90 (0.58 to 1.39) | 0.99 (0.64 to 1.52) | 1.00 (0.64 to 1.54) | 1.29 (0.83 to 2.02) |
| Q4 (≥3.2 mg/day) | 1.13 (0.69 to 1.84) | 1.29 (0.78 to 2.15) | 1.05 (0.61 to 1.81) | 1.38 (0.84 to 2.28) |
| p Value for trend | 0.74 | 0.51 | 0.94 | 0.06 |
| p Value for interaction | 0.56 | |||
| Docosahexaenoic acid | ||||
| Q2 (26.0–41.9 mg/day) | 0.89 (0.61 to 1.29) | 0.90 (0.60 to 1.36) | 1.07 (0.70 to 1.64) | 0.97 (0.63 to 1.47) |
| Q3 (41.9–64.0 mg/day) | 0.67 (0.43 to 1.03) | 0.86 (0.57 to 1.29) | 1.60 (1.04 to 2.47) | 1.17 (0.76 to 1.79) |
| Q4 (≥64.0 mg/day) | 0.62 (0.38 to 1.03) | 0.60 (0.36 to 0.99) | 0.91 (0.53 to 1.58) | 0.72 (0.43 to 1.22) |
| p Value for trend | 0.04 | 0.06 | 0.64 | 0.45 |
| p Value for interaction | 0.71 | |||
| Eicosapentaenoic acid | ||||
| Q2 (12.7–24.6 mg/day) | 0.79 (0.53 to 1.16) | 0.75 (0.50 to 1.12) | 1.14 (0.77 to 1.69) | 0.88 (0.57 to 1.35) |
| Q3 (24.6–42.3 mg/day) | 0.71 (0.47 to 1.07) | 0.93 (0.63 to 1.36) | 1.29 (0.86 to 1.94) | 1.19 (0.80 to 1.77) |
| Q4 (≥42.3 mg/day) | 0.70 (0.43 to 1.14) | 0.51 (0.32 to 0.81) | 0.81 (0.50 to 1.33) | 0.84 (0.53 to 1.36) |
| p Value for trend | 0.11 | 0.02 | 0.64 | 0.91 |
| p Value for interaction | 0.22 | |||
| Low-glycaemic index† | ||||
| 78.6–81.5 | 0.71 (0.46 to 1.09) | 0.85 (0.58 to 1.26) | 0.65 (0.44 to 0.95) | 0.96 (0.66 to 1.40) |
| 75.2–78.6 | 0.90 (0.59 to 1.39) | 0.99 (0.66 to 1.50) | 0.63 (0.42 to 0.94) | 0.60 (0.39 to 0.92) |
| <75.2 | 0.84 (0.50 to 1.40) | 1.02 (0.63 to 1.64) | 0.56 (0.36 to 0.89) | 0.69 (0.41 to 1.15) |
| p Value for trend | 0.75 | 0.84 | 0.01 | 0.03 |
| p Value for interaction | 0.04 | |||
All analyses used eyes as the unit. The hazard ratios (95% CIs) were calculated using the first quartile group of the nutrient intake as the referent. The p value for interaction evaluated if the association varied by types of Age-Related Eye Disease Study intervention.
“Low-glycaemic index” analyses used the highest quartile group of dietary glycaemic index (≥81.5) as the referent.
Table 3.
Associations between dietary docosahexaenoic acid intake and risk of early age-related macular degeneration progression by types of Age-Related Eye Disease Study intervention*
| Dietary intake | Multivariate-adjusted hazard ratio (95% confidence interval) |
|||
|---|---|---|---|---|
| Placebo |
Antioxidants |
Zinc |
Antioxidants plus zinc |
|
| n = 652 | n = 632 | n = 637 | n = 602 | |
| Docosahexaenoic acid | ||||
| Q2 (26.0–41.9 mg/day) | 0.79 (0.55 to 1.14) | 1.30 (0.91 to 1.85) | 1.59 (1.12 to 2.28) | 1.06 (0.73 to 1.53) |
| Q3 (41.9–64.0 mg/day) | 0.60 (0.40 to 0.89) | 0.92 (0.61 to 1.39) | 1.26 (0.85 to 1.87) | 1.29 (0.88 to 1.89) |
| Q4 (≥64.0 mg/day) | 0.58 (0.37 to 0.92) | 1.23 (0.81 to 1.87) | 1.46 (0.93 to 2.30) | 1.17 (0.74 to 1.85) |
| p Value for trend | 0.01 | 0.63 | 0.22 | 0.29 |
| p Value for interaction | 0.006 | |||
Using eyes as the unit in Cox proportional-hazards regression, the multivariate-adjusted hazard ratios (95% CIs) were calculated using the first quartile group of docosahexaenoic acid intake (<26.0 mg/day) as the referent. The p value for interaction evaluated if the association varied by type of Age-Related Eye Disease Study intervention.
RESULTS
The characteristics of the 2924 eligible participants were similar to the original AREDS AMD trial participants (n = 3640) (fig 1).4
In the global analyses of the risk for early AMD progression (table 2), we found that the effect of DHA varied by the types of AREDS intervention (p value for interaction = 0.006). Further stratification analyses (table 3) suggest that consuming higher levels of DHA provides benefit among recipients of the AREDS placebo and that there is an antagonistic interaction between dietary DHA intake and use of AREDS supplement on the risk for early AMD progression. Other dietary nutrients show no associations with risk for early AMD progression (data not shown).
In the global analyses of DHA and EPA for progression to advanced AMD (table 2), only those in the highest quartile range of intake (≥64.0 mg/d for DHA, ≥42.3 mg/d for EPA) had a significant ~25% decreased risk for disease compared with the lowest quartile (HR = 0.73, 95% CI 0.57 to 0.94 for DHA; HR = 0.74, 95% CI 0.59 to 0.94 for EPA). There was no difference for the lower three quartiles of intake, and the trend tests were marginally significant (p = 0.06 for DHA, 0.08 for EPA). The results stratified by geographic atrophy and neovascular AMD supported that a higher intake of DHA or EPA is protective against progression to the two forms of advanced AMD (see footnote † in table 2).
The interaction tests (p = 0.71 for DHA; p = 0.22 for EPA) suggest that the associations between dietary intakes and risk of progression to advanced AMD did not vary by type of AREDS intervention. Further stratification analysis (table 4) suggests that a higher omega-3 fatty acid intake is associated with a lower risk for progression to advanced AMD, even in those taking an AREDS “antioxidants” supplement.
Multivariate analysis for the global effect of low-GI (table 2) showed a significant protection against progression to advanced AMD independent of the type of AREDS intervention (p value for trend = 0.02). However, the interaction test (p = 0.04) implied that the degree of the protection may vary by the type of AREDS intervention. Further stratification analysis (table 4) showed that there was a synergistic interaction between low-GI diets and AREDS supplementation. These results suggest that people at risk for advanced AMD should consume a low-GI diet, and those taking AREDS supplement would even benefit more.
Surprisingly, analyses for progression to advanced AMD (table 2) suggested that a higher dietary beta-carotene intake was associated with an increased risk for disease (p value for trend = 0.07). While the interaction test (p = 0.56) indicates that this association does not vary by the types of AREDS intervention, these data (table 4) show that the increased risk is strongest among those who received the AREDS “antioxidants plus zinc” intervention (p for trend = 0.06), that is AREDS supplement users consuming more (upper 50% or ≥2.2 mg/day) beta-carotene from foods had over 50% increased risk for advanced AMD (HR = 1.52, 95% CI 1.10 to 2.11).
We found significant synergistic interactions between the omega-3 fatty acids and “low-GI” (p = 0.0003 for DHA and 0.0001 for EPA), that is higher intakes in omega-3 fatty acids and low-GI are associated with an even lower risk for advanced AMD than either of the two dietary factors alone. Further analysis indicated that individuals in the combined category of the upper 25% of the omega-3 fatty acids (DHA or EPA) and the fourth quartile group of the “Low-GI” had a ~50% reduced risk of progression to advanced AMD compared with the combined category for the lower 75% of the omega-3 fatty acids and the first quartile group of the “Low-GI” (fig 2A for DHA and fig 2B for EPA).
Figure 2.
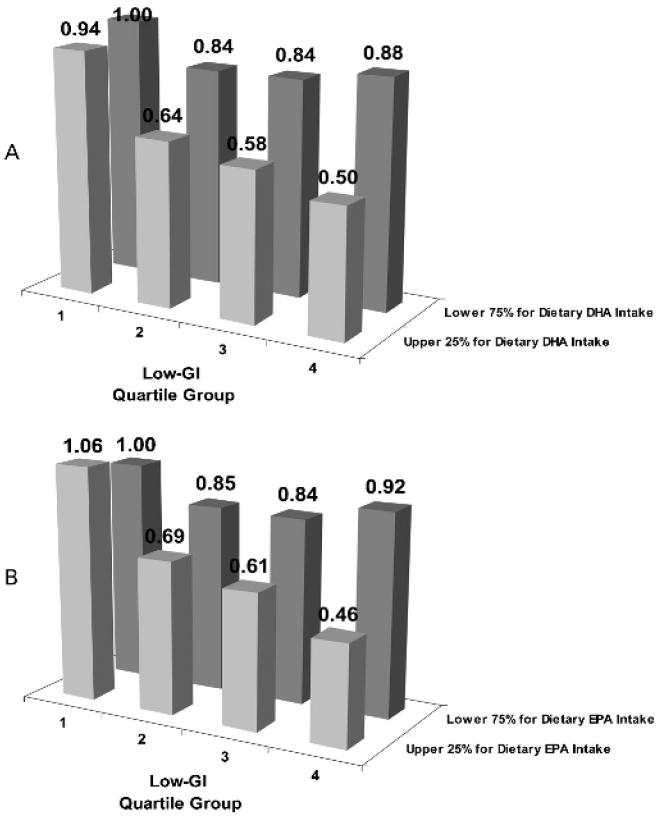
Interaction between omega-3 fatty acids and dietary glycaemic index (dGI) on risk of developing advanced age-related macular degeneration (AMD). p Value for interaction = 0.0003 for docosahexaenoic acid (DHA) (A), 0.0001 for eicosapentaenoic acid (EPA) (B). Using those in the highest quartile group of the dGI (first quartile group of low-GI) and the lower 75% of the omega-3 fatty acids as the referent, the hazard ratios (95% CIs) are 0.84 (0.68 to 1.03), 0.84 (0.67 to 1.05), 0.88 (0.68 to 1.14), 0.94 (0.67 to 1.31), 0.64 (0.45 to 0.91), 0.58 (0.41 to 0.81) and 0.50 (0.34 to 0.73) for DHA. They are 0.85 (0.69 to 1.05), 0.84 (0.67 to 1.05), 0.92 (0.71 to 1.19), 1.06 (0.77 to 1.46), 0.69 (0.49 to 0.97), 0.61 (0.43 to 0.86) and 0.46 (0.31 to 0.68) for EPA.
We found no significant association with the risk for progression to advanced AMD in the analyses of vitamin C, vitamin E, zinc or lutein/zeaxanthin (data not shown).
DISCUSSION
The AREDS formula, which contains ~5, ~6 and ~18 times the Recommended Dietary Allowance (RDA) levels of zinc, vitamin C and vitamin E, respectively, was shown to be protective against progression to advanced AMD in the AREDS cohort, in which a high proportion (67%) of the participants took an additional RDA-level of these nutrients from Centrum during the trial period.4 Given the high levels of the antioxidants from the supplements, it is not surprising that we found that no additional benefit accrued from intake of these nutrients from foods to that offered by taking the AREDS supplement. This finding suggests that there may be a saturating level for these nutrients with respect to macular health.
Because of the potential hazard of lung cancer from beta-carotene, 20 the AREDS supplement is not suggested for smokers. Our observation that high levels of dietary beta-carotene intake may increase the risk for progression to advanced AMD further supports the deletion of beta-carotene from the AREDS formula (table 4 and Results). Because half of the AREDS AMD trial participants received a high dose of beta-carotene from the intervention, and 67% of them took Centrum, the average total intake level for beta-carotene in this cohort was much higher than in other populations. Caution must be taken in interpreting our findings because they were of marginal statistical significance and may be due to the large number of analyses that have been done. However, a recent study from the Blue Mountains Eye Study, Australia, published during the review period of the present study, found that beta-carotene intake from diet alone predicted neovascular AMD, and the association was evident in both ever and never smokers.7
Our results showed a protective effect against progression to advanced AMD in those with the highest (>75th percentile) consumption of omega-3 fatty acids (DHA and EPA) (table 2). This may reflect the fact that Western diets provide low levels of omega-3 fatty acids, and suggest that increasing levels of omega-3 fatty acid intakes would enhance prevention of advanced AMD in a population consuming a Western diet. In our cohort, the 75th percentiles of DHA and EPA intakes were 64.0 and 42.3 mg/day, respectively, which are much lower than the recommended total intake level (650 mg/day) for DHA plus EPA. A dietary strategy for achieving this level is to consume two to three servings per week of cold-water fatty fish, such as salmon, tuna, mackerel, sardines, shellfish and herring.21
Like other western-diet populations, our cohort consumed a large amount of refined carbohydrates (high-GI foods). These data show that a 6-unit reduction in dGI, which is approximately equivalent to replacing the five slices of white bread (GI = 100) with five slices of whole-grain bread (GI = 79) from the daily diet for a person consuming 250 g of total available carbohydrate per day, might eliminate almost 8% of advanced AMD cases in a 5-year period.12 13
Interestingly, the antagonistic DHA-AREDS supplement interaction (table 3) was not observed in our analysis of progression to advanced AMD (table 4). These results may imply that the protective effect of DHA may be through different mechanisms at different stages of AMD progression. Furthermore, taking together the results from early (table 3) and advanced (table 4) AMD analyses, these data also suggest that the timing of different supplementations may be important. One may speculate that a diet rich in omega-3 fatty acids or omega-3 fatty acid supplementation, without the AREDS supplement, might be most protective against progression of early AMD if started at the earliest stages of AMD, while, when combined with the AREDS supplement, it might be most protective with regard to preventing progression to advanced AMD.
It is hypothesised that high-GI diets induce higher post-prandial glycoxidative stress through the formation of advanced glycation end products, glycoxidation, accumulation and precipitation of glycated protein aggregates, and subsequent inflammatory and angiogenic responses.11-13 22 23 In addition, because compensatory hyperlipidaemia in the late postprandial stage after consuming high-GI foods may also play a role in the pathogenesis of AMD, and the protective effect of omega-3 fatty acids may be through modulating the postprandial blood lipid profile,11-13 24 the synergistic interactions of low-GI diets with AREDS supplement (table 4) and high omega-3 fatty acid diet (fig 2) provide further support to our hypothesis.
There may be a concern about dietary change over the study period. However, information derived from FFQs has been considered as valid for measuring long-term dietary intake in epidemiological studies,18 and the non-differential misclassification of dietary intake would modify our result toward no association. Residual confounders could be another concern; however, as discussed in our previous paper,13 it is unlikely that they can totally explain our findings.
The present study adds additional support to the idea that diet and, if necessary, supplementation can be optimised for the prevention of AMD. However, some issues require further study. First, because adverse effects may appear only after long-term use, and the effect of an intervention may vary by different stages of disease development, the duration and timing of an intervention should be evaluated carefully. Nutrient–nutrient interactions may also influence the effect of an intervention at different stages of disease progression and vary in different populations. Although new trials will offer the soundest answers, observational data from post-trial follow-up studies may offer valuable information to address these issues and to plan the next generation of trials.
Table 1.
Characteristics of eligible participants from Age-Related Eye Disease Study (AREDS) age-related macular degeneration trial*
| Characteristics | n = 2924 |
|---|---|
| Age in years, mean (SD) | 69.3 (4.8) |
| Race | |
| White | 2829 (96.8) |
| Others | 95 (3.3) |
| Gender | |
| Female | 1698 (58.1) |
| Education | |
| College or higher | 1855 (63.4) |
| Ever smoked | 1626 (55.6) |
| Hypertension | 1134 (38.8) |
| Centrum use during trial period | 1973 (67.5) |
| Type of AREDS intervention received | |
| Placebo | 735 (25.1) |
| Antioxidants alone | 730 (25.0) |
| Zinc alone | 748 (25.6) |
| Antioxidants plus zinc | 711 (24.3) |
| Dietary intake (mean (SD), servings/week) | |
| Fruits and juices† | 16.1 (10.6) |
| Vegetables‡ | 15.5 (9.3) |
| Fish§ | 1.7 (1.5) |
| Meat¶ | 5.4 (3.2) |
| Dairy products** | 11.1 (6.7) |
| Energy intake (mean (SD), kcal/day) | 1486.3 (562.5) |
Data are given in no (%) otherwise indicated.
“Fruits and juices” included apples, apple sauce, pears, bananas, peaches, apricots, cantaloupe, watermelon, strawberries, oranges, tangerines, grapefruits, orange juice or grapefruit juice, fruit drinks with added vitamin C, and any other fruit, including berries, fruit cocktail and grapes.
“Vegetables” included string beans, green beans, peas, chilli with beans, other beans such as bakes beans, pintos, kidney, limas and lentils, corn, winter squash/baked squash, tomatoes, tomato juice, red chilli sauce, taco sauce, salsa picante, broccoli, cauliflower or brussels sprouts, spinach (raw or cooked), greens (cooked), mustard, turnip, collards, cole slaw, cabbage, sauerkraut, carrots, or mixed vegetables containing carrots, green salad, and any other vegetable, including cooked onions and summer squash.
“Fish” included fried fish or fish sandwich, tuna, tuna salad, tuna casserole and other fish (broiled or baked).
“Meat” included hamburgers, cheeseburgers, meatloaf, beef burritos, tacos, beef (steak, roasts, etc, including sandwiches), beef stew or pot pie with carrots or other vegetables, pork or lamb, including chops, roasts, fried chicken, chicken or turkey (roasted, stew or broiled) including on sandwiches, hot dogs, and ham, baloney, salami and other lunch meats.
“Dairy products” included milk on cereal, cottage cheese, other cheeses and cheese spreads, yogurt or frozen yogurt, ice cream, milk or cream (real) in coffee or tea, whole milk or beverages with whole milk (not including on cereal), 2% milk and beverages with 2% milk (not including on cereal), and skim milk, 1% milk or buttermilk (not including on cereal).
Acknowledgments
We thank all participants and investigators in the AREDS.
Funding: Financial support for this project has been provided by the US Department of Agriculture under agreements, 1950-5100-060-01A (C-JC, AT) and R01-13250 and R03-EY014183-01A2 from the National Institutes of Health (AT); grants (AT) from the Johnson & Johnson Focused Giving Program and American Health Assistance Foundation, and to C-JC from the Ross Aging Initiative.
Footnotes
Contributors: C-JC and GG had full access to all of the data in the study and take responsibility for the integrity of the data and the accuracy of the data analysis. Study concept and design: C-J Chiu. Acquisition of data: RCM and AT. Analysis and interpretation of data: C-JC. Drafting of the manuscript: C-JC, AT. Critical analysis of the manuscript for important intellectual content: C-JC, RK, RCM and AT. Statistical analysis: C-JC. Administrative, technical or material support: GG.
Competing interests: None.
Provenance and peer review: Not commissioned; externally peer reviewed.
Trial registration number: NCT00000145.
References
- 1.Klein R. Overview of progress in the epidemiology of age-related macular degeneration. Ophthalmic Epidemiol. 2007;14:184–7. doi: 10.1080/09286580701344381. [DOI] [PubMed] [Google Scholar]
- 2.Resnikoff S, Pascolini D, Etya’ale D, et al. Global data on visual impairment in the year 2002. Bull World Health Organ. 2004;82:844–51. [PMC free article] [PubMed] [Google Scholar]
- 3.Chiu CJ, Taylor A. Nutritional antioxidants and age-related cataract and maculopathy. Exp Eye Res. 2007;84:229–45. doi: 10.1016/j.exer.2006.05.015. [DOI] [PubMed] [Google Scholar]
- 4.Age-Related Eye Disease Study Research Group. A randomized, placebo-controlled, clinical trial of high-dose supplementation with vitamins C and E, beta carotene, and zinc for age- related macular degeneration and vision loss: AREDS report no.8. Arch Ophthalmol. 2001;119:1417–36. doi: 10.1001/archopht.119.10.1417. [DOI] [PMC free article] [PubMed] [Google Scholar]
- 5.van Leeuwen R, Boekhoorn S, Vingerling JR, et al. Dietary intake of antioxidants and risk of age-related macular degeneration. JAMA. 2005;294:3101–7. doi: 10.1001/jama.294.24.3101. [DOI] [PubMed] [Google Scholar]
- 6.Cho E, Seddon JM, Rosner B, et al. Prospective study of intake of fruits, vegetables, vitamins, and carotenoids and risk of age-related maculopathy. Arch Ophthalmol. 2004;122:883–92. doi: 10.1001/archopht.122.6.883. [DOI] [PubMed] [Google Scholar]
- 7.Tan JS, Wang JJ, Flood V, et al. Dietary antioxidants and the long-term incidence of age-related macular degeneration: the Blue Mountains Eye Study. Ophthalmology. 2008;115:334–41. doi: 10.1016/j.ophtha.2007.03.083. [DOI] [PubMed] [Google Scholar]
- 8.VandenLangenberg GM, Mares-Perlman JA, Klein R, et al. Associations between antioxidant and zinc intake and the 5-year incidence of early age-related maculopathy in the Beaver Dam Eye Study. Am J Epidemiol. 1998;148:204–14. doi: 10.1093/oxfordjournals.aje.a009625. [DOI] [PubMed] [Google Scholar]
- 9.Jampol LM, Ferris FLr. Antioxidants and zinc to prevent progression of age-related macular degeneration. JAMA. 2001;286:2466–8. [PubMed] [Google Scholar]
- 10.SanGiovanni JP, Chew EY, Agrón E, et al. The relationship of dietary omega-3 long-chain polyunsaturated fatty acid intake with incident age-related macular degeneration: AREDS report no. 23. Arch Ophthalmol. 2008;126:1274–9. doi: 10.1001/archopht.126.9.1274. [DOI] [PMC free article] [PubMed] [Google Scholar]
- 11.Chiu CJ, Hubbard LD, Armstrong J, et al. Dietary glycemic index and carbohydrate in relation to early age-related macular degeneration. Am J Clin Nutr. 2006;83:880–6. doi: 10.1093/ajcn/83.4.880. [DOI] [PubMed] [Google Scholar]
- 12.Chiu CJ, Milton RC, Gensler G, et al. Association between dietary glycemic index and age-related macular degeneration in the Age-Related Eye Disease Study. Am J Clin Nutr. 2007;86:180–8. doi: 10.1093/ajcn/86.1.180. [DOI] [PubMed] [Google Scholar]
- 13.Chiu CJ, Milton RC, Klein R, et al. Dietary carbohydrate and progression of age-related macular degeneration, a prospective study from the Age-Related Eye Disease Study. Am J Clin Nutr. 2007;86:1210–18. doi: 10.1093/ajcn/86.4.1210. [DOI] [PubMed] [Google Scholar]
- 14.Kurinij N, Gensler G, Milton R, et al. Development and valuation of a food frequency questionnaire in a randomized trial of eye diseases. International Conference on Dietary Assessment Measures; Phoenix, Arizona. 1998. [Google Scholar]
- 15.Jenkins DJ, Wolever TM, Taylor RH. Glycemic index of foods: a physiological basis for carbohydrate exchange. Am J Clin Nutr. 1981;34:362–6. doi: 10.1093/ajcn/34.3.362. [DOI] [PubMed] [Google Scholar]
- 16.Foster-Powell K, Holt SH, Brand-Miller JC. International table of glycemic index and glycemic load values: 2002. Am J Clin Nutr. 2002;76:5–56. doi: 10.1093/ajcn/76.1.5. [DOI] [PubMed] [Google Scholar]
- 17.Wolever TM, Nguyen PM, Chiasson JL, et al. Determinants of diet glycemic index calculated retrospectively from diet records of 342 individuals with non-insulin-dependent diabetes mellitus. Am J Clin Nutr. 1994;59:1265–9. doi: 10.1093/ajcn/59.6.1265. [DOI] [PubMed] [Google Scholar]
- 18.Willett WC. Nutritional epidemiology. 2. New York: Oxford University Press; 1998. [Google Scholar]
- 19.Andersen PK, Gill RD. Cox’s regression model for counting process: a large sample study. Ann Statist. 1982;10:1100–20. [Google Scholar]
- 20.The Alpha-Tocopherol Beta Carotene Cancer Prevention Study Group. The effect of vitamin E and beta carotene on the incidence of lung cancer and other cancers in male smokers. New Engl J Med. 1994;330:1029–35. doi: 10.1056/NEJM199404143301501. [DOI] [PubMed] [Google Scholar]
- 21.Gebauer SK, Psota TL, Harris WS, et al. n-3 fatty acid dietary recommendations and food sources to achieve essentiality and cardiovascular benefits. Am J Clin Nutr. 2006;83(6 Suppl):1526–35S. doi: 10.1093/ajcn/83.6.1526S. [DOI] [PubMed] [Google Scholar]
- 22.Stitt AW. The Maillard reaction in eye diseases. Ann N Y Acad Sci. 2005;1043:582–97. doi: 10.1196/annals.1338.066. [DOI] [PubMed] [Google Scholar]
- 23.Jenkins DJA, Kendall CWC, Augustin LSA, et al. Glycemic index: overview of implications in health and disease. Am J Clin Nutr. 2002;76(Suppl):266–73S. doi: 10.1093/ajcn/76/1.266S. [DOI] [PubMed] [Google Scholar]
- 24.Anil E. The impact of EPA and DHA on blood lipids and lipoprotein metabolism: influence of apoE genotype. Proc Nutr Soc. 2007;66:60–8. doi: 10.1017/S0029665107005307. [DOI] [PubMed] [Google Scholar]