Abstract
BACKGROUND
Studies of disease associations with γ' fibrinogen, a newly-emerging risk factor for cardiovascular disease, have been hampered by the lack of a standardized and well-characterized assay.
METHODS
We developed an immunometric technique to measure γ' fibrinogen concentrations in plasma, and studied the clinical utility of this test in samples from healthy individuals enrolled in the Framingham Offspring Study and in a separate case/control study of coronary artery disease. Monoclonal antibody 2.G2.H9 specific for the unique carboxyl terminal peptide of the fibrinogen γ' chain was used as capture antibody. Sheep anti-human fibrinogen/horseradish peroxidase conjugate was used for detection, with 3,3',5,5'-tetramethylbenzidine as substrate. We evaluated the linearity, imprecision, analytical specificity, and lower limit of quantification of the assay. The reference interval for γ' fibrinogen was determined in healthy individuals from the Framingham Offspring Study (n=2,879), and associations between γ' fibrinogen and cardiovascular disease risk factors were quantified. The sensitivity and specificity of γ' fibrinogen in evaluating CAD patients (n=133) was determined with receiver-operating characteristic (ROC) curve analysis.
RESULTS
The γ' fibrinogen ELISA had within-run CVs of 13.4% at 0.127 g/L and 4.8% at 0.416 g/L. The limit of quantification at an imprecision of 20% was 0.10 g/L. The reference interval for healthy individuals was 0.088 to 0.551 g/L. ROC curve analysis of results from patients with coronary artery disease yielded an area under the curve of 0.76, with a diagnostic accuracy of 0.78 at a decision threshold of 0.30 g/L.
CONCLUSIONS
γ' fibrinogen shows excellent utility for cardiovascular risk analysis.
Keywords: cardiovascular, disease, fibrinogen, isoform
Introduction
Fibrinogen has a well-documented association with cardiovascular disease; plasma concentrations of total fibrinogen show a strong relationship with myocardial infarction and stroke (1). However, fibrinogen is a heterogeneous mixture of isoforms with varying relative proportions. Alternative mRNA processing and post-translational modifications give rise to several different fibrinogen isoforms with widely varying characteristics (2). In addition, since fibrinogen is a six-chain molecule containing two copies each of the Aα, Bβ, and γ chains, various combinations of altered chains can be assembled, particularly in fibrinogens resulting from heterozygous polymorphisms or mutations (3).
The fibrinogen γ chain has two isoforms, the γA (or simply γ) isoform and the γ' (or γB) isoform (4). The γ' isoform arises from alternative mRNA processing (5, 6) that results in the substitution of the carboxyl terminal four amino acids with a different twenty amino acid sequence. The γ' chain is usually paired with the more common γA chain. γ' fibrinogen typically constitutes approximately 10% of total fibrinogen in plasma, although this percentage can vary widely among individuals (7, 8).
γ' fibrinogen has several biochemical and biophysical properties that distinguish it from the more common γA isoform. Clots made from fibrinogen containing γ' chains in the presence of factor XIII are highly resistant to fibrinolysis (9–11). In addition, the γ' chain contains a binding site for thrombin (12–16), and clots made from γ' fibrinogen have been reported to have an altered clot architecture (11, 17, 18).
Possibly as a result of these properties, recent studies suggest that γ' fibrinogen is a risk factor for cardiovascular disease (19–21). An association has been found between γ' fibrinogen concentrations and prevalent CAD (7), myocardial infarction (8), and stroke (21). An earlier study found an association between the ratio of γ' fibrinogen to total fibrinogen and myocardial infarction (22). Unfortunately, studies on the clinical significance of γ' fibrinogen and thrombotic diseases have been hampered by the lack of a standardized assay with well-described analytical parameters. In this paper, we describe the development and validation of an immunoassay technique for γ' fibrinogen. We also describe the distribution of γ' fibrinogen in the Framingham Offspring Study and describe the clinical utility of this marker for identifying individuals at risk for the development of CAD.
Materials And Methods
MATERIALS
Reagents were obtained from Fisher Scientific, Inc. unless otherwise specified. Monoclonal antibody 2.G2.H9 directed against the γ' chain carboxyl terminus (available from Upstate, Inc.) was used for detection of γ' fibrinogen. Plasminogen-free unfractionated human fibrinogen was obtained from Calbiochem, Inc. Standards for γ' fibrinogen were prepared from plasma obtained from anonymous donors (see below). This study was compliant with the Helsinki Declaration of 1975 and was approved by the OHSU Institutional Review Board; all donors gave informed consent.
FRAMINGHAM OFFSPRING STUDY PLASMA SAMPLES
We obtained 3,300 plasma samples from the Framingham Offspring Study (23). These samples were collected during the 7th examination cycle (between 1998-2001) and were maintained at -70°C until analysis. The samples contained in this study set were obtained from 2,879 individuals with no prior occurrence of cardiovascular disease, and 421 individuals with previously documented cardiovascular disease, as defined previously (23) by the prior occurrence of myocardial infarction, coronary insufficiency, angina pectoris, stroke, transient ischemic attack, or intermittent claudication. Descriptive statistics (mean ± standard deviation for continuous risk factors, count and percent prevalence for dichotomous risk factors and γ' and total fibrinogen) are presented. The significance of the mean/% difference across tertiles was assessed using age- and sex-adjusted analysis of covariance (continuous risk factors) or logistic regression (dichotomous risk factors).
CAD CASE/CONTROL SAMPLES
Data in Fig. 5 are based on our published case/control study of CAD and used with permission of the publishers (7). Briefly, blood was obtained from 133 patients between the ages of 41 and 80 who were referred for elective, outpatient diagnostic cardiac catheterizations. The indications for catheterization included anginal chest pain, positive stress test, valvular heart disease, and preoperative clearance prior to non-cardiac surgery in patients suspected of ischemic heart disease. Cases were defined as patients having luminal narrowing of 50% or greater in at least one major coronary artery or branch. 91 cases of CAD were diagnosed, whereas 42 patients had no angiographic evidence of disease and were used as controls.
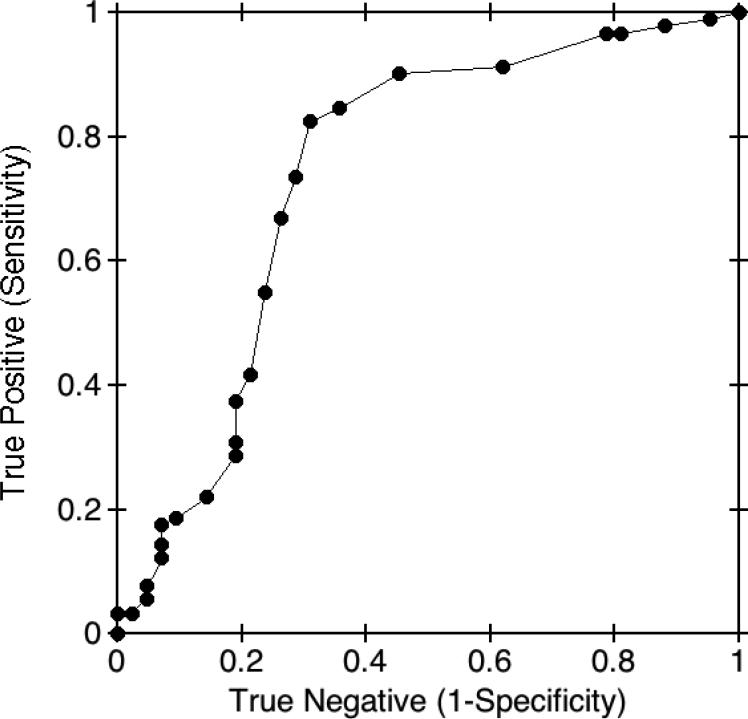
Fig. 5. Receiver-operating characteristic curve for γ' fibrinogen in CAD patients.
γ' fibrinogen concentrations were measured in a prior study (7) in 133 patients referred for elective diagnostic cardiac catheterization. The receiver-operating characteristic curve of γ' fibrinogen concentrations in CAD cases and controls showed an area under the curve of 0.76. A maximum diagnostic accuracy of 0.78 was found at a decision threshold of 0.30 g/L.
Data for γ' fibrinogen concentrations measured in healthy controls showed a non-gaussian distribution. Reference intervals were therefore established on the basis of the central 95th percentile interval. The diagnostic performance of the test for differentiating patients with CAD from those without evidence of the disease was evaluated using Receiver Operating Characteristic (ROC) curve analysis (MedCalc Software). The sensitivity and specificity associated with incremental changes in γ' fibrinogen concentrations were calculated and used to develop the ROC curve.
PREPARATION OF γ' FIBRINOGEN STANDARD
γA/γ' fibrinogen was purified using a modification (9) of a previous DEAE-cellulose chromatographic method (4). To prepare the γ' fibrinogen standard, normal human plasma (George King Biomedical) was first defibrinated by heating for 30 minutes at 56°C followed by centrifugation for 30 minutes at 100,000 × g to remove precipitated fibrinogen. Heat-defibrinated plasma was diluted 1:1000 in a solution of 0.1% fraction V BSA (Sigma) in PBS, consisting of 0.137 mol/L NaCl/2.7 mmol/L KCl/10 mmol/L sodium phosphate, pH 7.4 (Sigma) containing 5 mmol/L EDTA/0.1% Triton X-100 (v/v), and reconstituted to 1.5 μg/mL with DEAE cellulose-purified γA/γ' fibrinogen. Serial dilutions of 0.75, 0.375, 0.188, 0.094, and 0.047 μg/mL were used in duplicate to calibrate our assay.
ANALYTICAL SPECIFICITY OF 2.G2.H9
Monoclonal antibody 2.G2.H9 was prepared in a bioreactor at the Penn State Hybridoma and Cell Culture Laboratory (State College, PA). To assess the specificity of the antibody for γ' fibrinogen, 100 μl of 2.0 μg/mL γA/γA or γA/γ' fibrinogen was coated on 96-well Maxisorp plates (Nunc) in 15 mmol/L Na2CO3/35 mmol/L NaHCO3, pH 9.6 and blocked with 1% (w/v) BSA. Bioreactor supernatant was serially diluted in 120 mmol/L NaCl/10 mmol/L Tris, pH 8.0/0.04% (v/v) Tween 20 and incubated for 1 hour at 37°C, followed by detection with goat anti-mouse IgG/HRP conjugate (Rockland Labs). 1 g/L O-phenylenediamine (Sigma) in 50 mmol/L sodium citrate, pH 4.5/0.03%H2O2 was incubated at 22°C until color development, which was read at 450 nm.
γ' ELISA
Monoclonal antibody 2.G2.H9 was purified as described previously (7). 96-well Maxisorp plates were coated overnight at 4°C with 50 μl per well of a solution of 1.5 μg/mL 2.G2.H9 in PBS. Plates were then blocked for 1 hour at 37°C with BSA in 250 μl PBS/1% BSA/0.1% Triton X-100. Citrated human plasma samples were diluted 1:1000 in PBS/5 mmol/L EDTA/0.1% BSA/0.1% Triton X-100, and 50 μl was added per well in triplicate and incubated for 1 hour at 37°C. Wells were washed three times with 250 μl of PBS/0.1% Triton X-100. HRP-conjugated sheep anti-human fibrinogen (Innovative Research, Inc.) was diluted 1:2500 in PBS/0.1% BSA/0.1% Triton X-100, and 50 μl was added per well, incubating for 1 hour at 37°C. Wells were washed three times with 250 μl of PBS/0.1% Triton X-100. 50 μl of substrate solution, TMB Super Sensitive 1 Component HRP Microwell Substrate (BioFX Laboratories) was added to each well and incubated 30 minutes at 22°C. The substrate reaction was terminated by adding 50 μl of stop solution, 450 nm liquid stop solution for TMB microwell (BioFX Laboratories), and the absorbance was read at 450 nm in a PowerWave XS microplate reader (Bio-Tek). Absorbance values of the standards were fitted to a non-linear equation for a second-degree polynomial by least squares error method with use of Kaleidagraph™ software (Synergy Software).
We determined the precision of our assay as described in CLSI EP15 (24). We evaluated the lower limit of quantification of the assay by analyzing eight separate pools of patient plasma that varied in γ' fibrinogen concentrations from approximately 0.05 to 0.42 g/L.
Results
ANALYTICAL SPECIFICITY OF 2.G2.H9 TOWARDS γ' FIBRINOGEN
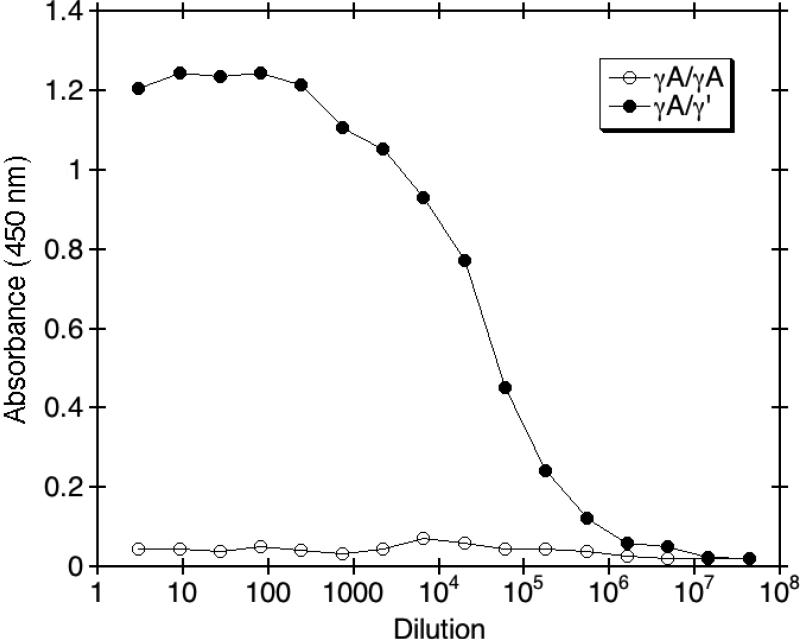
To assess the analytical specificity of anti-γ' monoclonal antibody 2.G2.H9 and its ability to differentiate γ' fibrinogen from γA/γA fibrinogen lacking γ' chains, serial dilutions of antibody were reacted against purified γA/γA or γA/γ' fibrinogen. As shown in Fig. 1, monoclonal antibody 2.G2.H9 showed no measurable reactivity towards γA/γA fibrinogen, even at the lowest dilutions. In addition, 2.G2.H9 showed only minor background reactivity with plasma that was heat-defibrinated to remove fibrinogen. Background absorbance with heat-defibrinated plasma was typically around 0.05 absorbance units (data not shown). These results demonstrate the specificity of the antibody towards γ' fibrinogen, which differs from γA/γA fibrinogen by only 20 out of 1,482 amino acids.
Fig. 1. Analytical specificity of 2.G2.H9 towards γ' fibrinogen.
The analytical specificity of anti-γ' fibrinogen monoclonal antibody 2.G2.H9 and its ability to differentiate γ' fibrinogen from fibrinogen lacking γ' chains was determined by incubating the indicated dilutions of the antibody with γA/γA or γA/γ' fibrinogen in microtiter wells. Goat anti-mouse IgG/HRP conjugate was added for detection, followed by O-phenylenediamine, and the absorbance was quantitated at 450 nm.
γ' FIBRINOGEN STANDARD CURVE
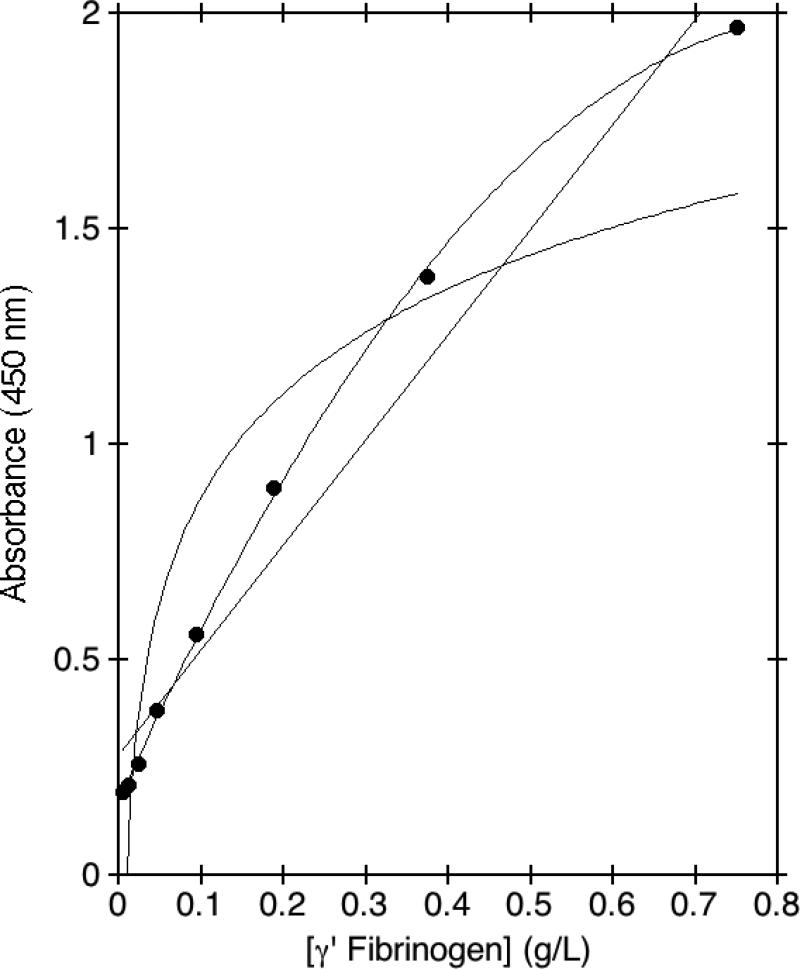
A standard curve was generated using heat-defibrinated plasma that was reconstituted with purified γA/γ' fibrinogen. The standard curve spanned the wide range of plasma concentrations of γ' fibrinogen found in individuals, which can vary nearly 40-fold. This wide range of concentrations necessitated the use of non-linear curve fitting for the standard curve. Fig. 2 shows that on a representative standard curve, a linear curve fit yielded a fairly good approximation, with an R value of 0.980, whereas a logarithmic curve fit was clearly inferior, with an R value of 0.921. However, the linear curve fit showed significant skewing at the extremes of concentrations. A curve fit based on a second degree polynomial empirically provided the best fit, with an R value of 0.99 in this example. Importantly, this curve fit did not deviate at the extremes of concentrations as did the linear curve fit, which allowed all plasma samples to be assayed under the same conditions.
Fig. 2. Curve fitting for the γ' fibrinogen ELISA.
A γ' fibrinogen standard curve was generated using the indicated concentrations of purified γ' fibrinogen reconstituted in heat-defibrinated plasma. Capture antibody was anti-γ' fibrinogen monoclonal antibody 2.G2.H9, and detection antibody was a commercial sheep anti-human fibrinogen/HRP conjugate. TMB substrate absorbance was quantitated at 450 nm. The resulting points were fit either to a linear, logarithmic, or second-degree polynomial curve fit.
PRECISION AND LOWER LIMIT OF QUANTIFICATION
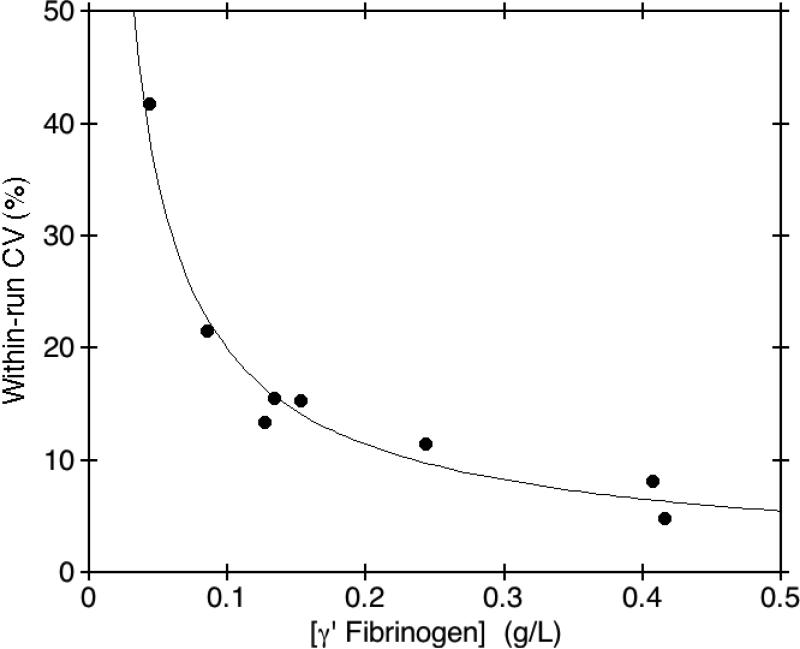
The precision of our method was evaluated by analyzing two separate pools of donor plasma with normal and increased γ' fibrinogen concentrations. The pools were aliquotted into individual tubes, stored frozen at -70°C, and aliquots were analyzed, in duplicate, twice daily for 5 consecutive days. A plasma standard with a mean γ' fibrinogen concentration of 0.127 g/L as established by 20 determinations had a within-run CV of 13.4% and a run-to-run CV of 28.6% with a total of 29.1%, whereas a plasma standard with a mean γ' fibrinogen concentration of 0.416 g/L had a within-run CV of 4.8% and a run-to-run CV of 11.2% with a total of 11.6%. To determine the lower limit of quantification of the method, an aliquot from each of eight pools of donor plasma was measured in triplicate, three times a day, for three consecutive days. The mean γ' fibrinogen concentration measured in each of the eight pools was plotted versus the within-run imprecision calculated for each pool. We defined the lower limit of quantification as that concentration of γ' fibrinogen giving a within-run CV of 20%. Fig. 3 shows that the lower limit of quantification for this assay was 0.10 g/L.
Fig. 3. Limit of quantification for the γ' fibrinogen ELISA.
The limit of quantification of the assay for measurement of γ' fibrinogen concentrations in plasma was determined using eight separate pools of patient plasma. The limit of quantification for the assay was 0.10 g/L, defined as that concentration of γ' fibrinogen giving a within-run CV of 20% or greater.
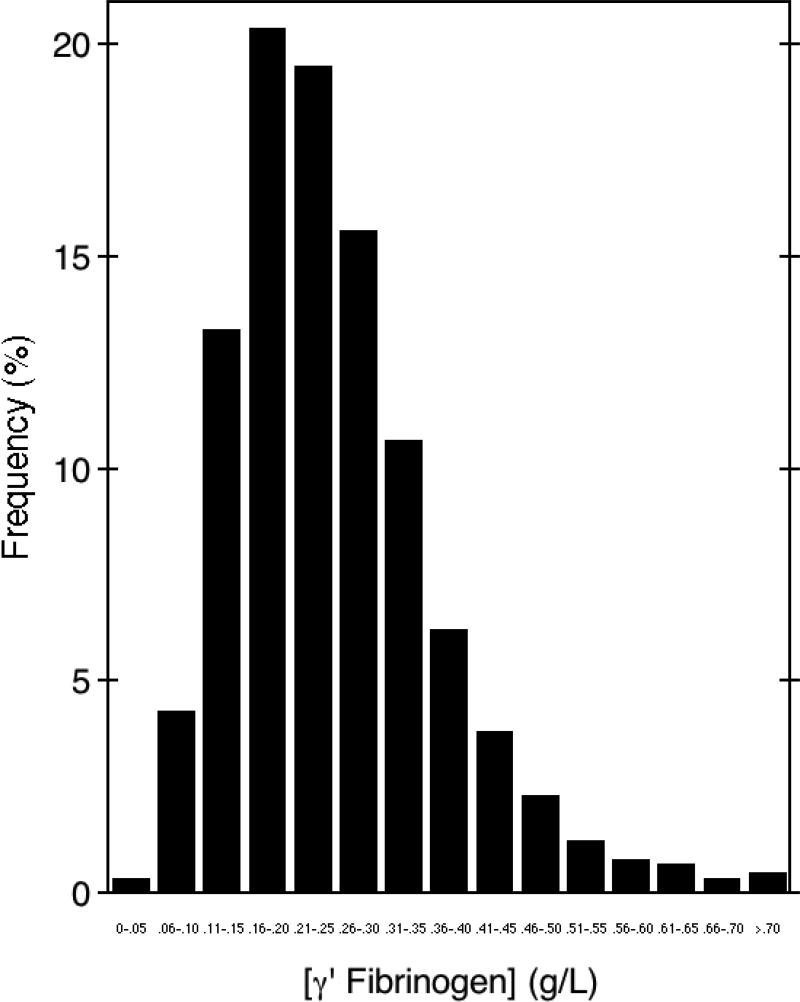
DISTRIBUTION OF γ' FIBRINOGEN IN HUMANS
To establish the reference interval for γ' fibrinogen in plasma, the concentration of γ' fibrinogen was measured in plasma samples obtained from the seventh exam cycle (1998-2001) of the Framingham Offspring Study. We analyzed γ' fibrinogen in participants with no previous history of cardiovascular disease (n=2,879). The characteristics of the entire Framingham Offspring cohort examined in this study are shown in Supplemental Data Table 1. The distribution showed a substantial number of outliers with high concentrations of γ' fibrinogen (Fig. 4). The range of γ' fibrinogen measured in these samples varied nearly 40-fold, from a low of 0.037 g/L to a high of 1.443 g/L. The reference interval, defined as the 2.5th and 97.5th percentile limits for γ' fibrinogen were 0.088 to 0.551 g/L, and the median concentration was 0.234 g/L. These median (2.5th and 97.5th percentiles) values are similar to those reported for 120 samples obtained from healthy blood donors, 0.281 g/L (0.115 – 0.460 g/L) (7) and from 42 healthy controls in a coronary artery disease case/control study (7) who showed a median γ' fibrinogen of 0.242 g/L (0.125 – 0.676 g/L).
Fig. 4. γ' fibrinogen concentrations in healthy individuals from the Framingham Offspring Study.
γ' fibrinogen was measured in 2,879 participants from the Framingham Offspring Study with no previous history of cardiovascular disease. The reference interval of γ' fibrinogen varied nearly 40-fold, from a low of 0.037 g/L to a high of 1.443 g/L. The 2.5th and 97.5th percentile limits for γ' fibrinogen were 0.088 to 0.551 g/L. The median concentration was 0.234 g/L and the mean concentration was 0.255 γ 0.119 g/L (±SD).
We next examined the association between γ' fibrinogen and known cardiovascular disease risk factors in all the available samples from the seventh exam cycle (n=3,300). γ' fibrinogen was significantly (all P<0.05) associated with age, sex, BMI, smoking, diabetes, blood glucose, and triglycerides (Table 1). Each of these risk factors increased significantly with increasing tertiles of γ' fibrinogen. HDL cholesterol showed a statistically significant inverse association with tertiles of γ' fibrinogen. Similar trends were seen in both men and women. In contrast to total fibrinogen concentrations (25), γ' fibrinogen did not show a significant association with systolic blood pressure or total cholesterol. These results suggest that γ' fibrinogen is not simply a surrogate marker for total fibrinogen, but has different associations with known cardiovascular disease risk factors.
Table 1.
Association of γ' Fibrinogen with Traditional Cardiovascular Risk Factors.a
| Factor | γ' Fibrinogen Tertiles | P-Valueb | ||
|---|---|---|---|---|
| | ||||
| Low (0.03655 - 0.19827) (N=1099) | Mid (0.19831 - 0.28564) (N=1100) | High (0.28567 - 1.44290) (N=1100) | ||
| Age (years) | 58.8 (± 9.0) | 60.9 (± 9.6) | 63.5 (± 9.3) | <0.001 |
| Female (%) | 50.3 | 54.7 | 55.5 | 0.023 |
| Body mass index (kg/m2) | 27.5 (± 4.9) | 28.1 (± 5.4) | 28.9 (± 5.6) | <0.001 |
| Cigarette smoking (%) | 13.4 | 11.8 | 14.2 | 0.019 |
| Diabetes mellitus (%) | 10.3 | 11.8 | 17.8 | <0.001 |
| Fasting blood glucose (mmol/L) | 5.69 (± 1.50) | 5.69 (± 1.24) | 6.00 (± 1.74) | <0.001 |
| Systolic blood pressure (mm Hg) | 125.0 (± 18.1) | 126.7 (± 18.2) | 129.5 (± 19.7) | 0.223 |
| Total cholesterol (mmol/L) | 5.23 (± 0.92) | 5.19 (± 0.95) | 5.14 (± 0.98) | 0.112 |
| HDL cholesterol (mmol/L) | 1.44 (± 0.45) | 1.40 (± 0.44) | 1.33 (± 0.43) | <0.001 |
| Triglycerides (mmol/L) | 1.49 (± 0.98) | 1.50 (± 0.96) | 1.66 (± 1.05) | <0.001 |
| Total fibrinogen (g/L) | 3.422 (±0.60) | 3.754 (±0.60) | 4.226 (±0.80) | <0.001 |
| γ' fibrinogen (g/L) | 0.15 (± 0.04) | 0.24 (± 0.02) | 0.39 (± 0.11) | - |
Results are unadjusted mean (±1 standard deviation) or %.
P-values assess the significance of the difference in mean/% across fibrinogen tertiles and are age and sex-adjusted (P-value for age is sex-adjusted only, and P-value for sex is age-adjusted only).
We also investigated the ability of the γ' fibrinogen assay to discriminate between individuals with CAD compared to controls without CAD in order to calculate the optimum decision threshold (26). This cohort (n=133) was investigated in a prior study from our laboratory (7). The mean age of this cohort was 62 (± 10) years old, similar to the Framingham Offspring at cycle 7 (61 (± 10) years old; see Supplemental Data Table 1), although the CAD cohort was more predominantly male (57%). When γ' fibrinogen concentrations were compared between CAD patients and non-CAD patients, γ' fibrinogen concentrations were significantly higher in CAD patients (0.413 ± 0.016 g/L vs. 0.299 ± 0.024 g/L (mean ± SE); P<0.0001), in both men and women. We used ROC curve analysis to evaluate the ability of γ' fibrinogen concentrations to distinguish between patients with CAD and controls. The area under the ROC curve was 0.76 (Fig. 5). The point of the curve showing the optimum diagnostic accuracy was at a γ' fibrinogen concentration of approximately 0.30 g/L. At this cutoff threshold the diagnostic accuracy was 0.78 for discriminating between patients with CAD and controls.
Discussion
The lack of availability of a well described and validated assay for γ' fibrinogen has hindered epidemiologic studies into its association with cardiovascular disease. Our laboratory has published previously a small pilot study that used the anti-γ' fibrinogen monoclonal antibody 2.G2.H9 as capture antibody (7). However, at the time of publication, γA/γ' fibrinogen standard and monoclonal antibody 2.G2.H9 were not available commercially and were purified in our laboratory. Purified γA/γ' fibrinogen standard is now available commercially, as is monoclonal antibody 2.G2.H9, although the present studies were performed with reagents purified in-house as described in our previous study (7).
A major concern in the development of an ELISA for the quantitation of γ' fibrinogen is cross-reactivity towards the major fibrinogen isoform, γA/γA fibrinogen, which lacks γ' chains. Our results show that monoclonal antibody 2.G2.H9 has no measurable cross-reactivity towards γA/γA fibrinogen. This finding is particularly important for epidemiologic studies, since total fibrinogen, the vast majority of which is γA/γA fibrinogen, is already a well-established risk factor for cardiovascular disease (1). In addition, previous findings indicate that there is no significant association between γA/γA fibrinogen concentrations and γ' fibrinogen concentrations in patients with CAD (7). These results suggest that γ' fibrinogen is not simply a surrogate for γA/γA fibrinogen, but rather is an independent marker for CAD.
Our ELISA method showed acceptable precision for measurement of γ' fibrinogen. The optimal cutoff threshold was 0.30 g/L for distinguishing patients with CAD from those without CAD with a within-run %CV <10%. Presumably, automation of the current procedure would allow for more stringent control of our manually performed assay, resulting in better precision. The ELISA method we describe in the current manuscript was performed using manual pipetting and wash steps.
The skewed distribution of γ' fibrinogen in the Framingham Offspring Study samples was unexpected, and was not seen previously in a smaller sampling of 120 plasma samples from Red Cross blood donors (7). This skewed distribution is not dissimilar from distributions of fibrinogen determined using the Clauss assay (27) as well as other circulating biomarkers, such as CRP. Although the Framingham Offspring Study participants in this analysis had no documented history of cardiovascular disease, the male and female participants were drawn from a general community dwelling population. It is likely that some of the participants may have had underlying subclinical cardiovascular disease that had not yet manifested itself as an acute event.
ROC curve analysis showed a diagnostic accuracy of γ' fibrinogen of 0.78 for discriminating patients with CAD, defined as ≥50% narrowing in at least one major coronary artery or branch, from individuals with <50% narrowing. This degree of accuracy was achieved with no adjustment for other variables such as age or gender.
In conclusion, γ' fibrinogen shows promise as a marker for cardiovascular disease. The addition of this marker to other established risk factors such as hsCRP (28) and cholesterol may provide additive predictive value for assessment of risk of adverse cardiac events. Our ELISA method demonstrated good analytical sensitivity and specificity for measurement of γ' fibrinogen. Automation of the current method should allow for more precise measurement of this marker. In addition, we are currently conducting studies to assess the short- and long-term intra-individual biologic variability of γ' fibrinogen in comparison with that of hsCRP and cholesterol. This assay should facilitate future studies of the association of γ' fibrinogen with cardiovascular risk.
Supplementary Material
Supplemental Data Table 1. Characteristics of the Framingham Offspring Cohort at Exam Cycle 7.
Acknowledgments
The authors wish to thank Dr. William Scheuchenzuber at the Penn State Hybridoma and Cell Culture Laboratory for producing 2.G2.H9 and providing the data shown in Fig. 1. This work was supported by the National Heart, Lung and Blood Institute's Framingham Heart Study (Contract No. N01-HC-25195), by grant 0865486G from the American Heart Association (to RSL), and by grants R21-HL-75006 and R21-HL-97298 from the National Heart, Lung and Blood Institute of the NIH and N000140610411 from the Office of Naval Research (to DHF).
Nonstandard abbreviations
- BSA
bovine serum albumin
- CAD
coronary artery disease
- CRP
C-reactive protein
- CV
coefficient of variability
- ELISA
enzyme-linked immunosorbent assay
- HRP
horseradish peroxidase
- PBS
phosphate-buffered saline
- TMB
3,3',5,5'-tetramethylbenzidine
References
- 1.Danesh J, Lewington S, Thompson SG, Lowe GD, Collins R, Kostis JB, et al. Plasma fibrinogen level and the risk of major cardiovascular diseases and nonvascular mortality: an individual participant meta-analysis. JAMA. 2005;294:1799–809. doi: 10.1001/jama.294.14.1799. [DOI] [PubMed] [Google Scholar]
- 2.Lord ST. Fibrinogen and fibrin: scaffold proteins in hemostasis. Curr Opin Hematol. 2007;14:236–41. doi: 10.1097/MOH.0b013e3280dce58c. [DOI] [PubMed] [Google Scholar]
- 3.Verhovsek M, Moffat KA, Hayward CP. Laboratory testing for fibrinogen abnormalities. Am J Hematol. 2008;83:928–31. doi: 10.1002/ajh.21293. [DOI] [PubMed] [Google Scholar]
- 4.Mosesson MW, Finlayson JS, Umfleet RA. Human fibrinogen heterogeneities. III. Identification of γ chain variants. J Biol Chem. 1972;247:5223–7. [PubMed] [Google Scholar]
- 5.Chung DW, Davie EW. γ and γ' chains of human fibrinogen are produced by alternative mRNA processing. Biochemistry. 1984;23:4232–6. doi: 10.1021/bi00313a033. [DOI] [PubMed] [Google Scholar]
- 6.Fornace AJ, Jr, Cummings DE, Comeau CM, Kant JA, Crabtree GR. Structure of the human γ-fibrinogen gene. Alternate mRNA splicing near the 3' end of the gene produces γA and γB forms of γ-fibrinogen. J Biol Chem. 1984;259:12826–30. [PubMed] [Google Scholar]
- 7.Lovely RS, Falls LA, Al-Mondhiry HA, Chambers CE, Sexton GJ, Ni H, Farrell DH. Association of γA/γ' fibrinogen levels and coronary artery disease. Thromb Haemost. 2002;88:26–31. [PubMed] [Google Scholar]
- 8.Mannila MN, Lovely RS, Kazmierczak SC, Eriksson P, Samnegård A, Farrell DH, et al. Elevated plasma fibrinogen γ’ concentration increases risk of myocardial infarction: effects of genetic variation in fibrinogen genes and environmental factors. J Thromb Haemost. 2007;5:766–73. doi: 10.1111/j.1538-7836.2007.02406.x. [DOI] [PubMed] [Google Scholar]
- 9.Falls LA, Farrell DH. Resistance of γA/γ' fibrin clots to fibrinolysis. J Biol Chem. 1997;272:14251–6. doi: 10.1074/jbc.272.22.14251. [DOI] [PubMed] [Google Scholar]
- 10.Collet JP, Nagaswami C, Farrell DH, Montalescot G, Weisel JW. Influence of γ' fibrinogen splice variant on fibrin physical properties and fibrinolysis rate. Arterioscler Thromb Vasc Biol. 2004;24:382–6. doi: 10.1161/01.ATV.0000109748.77727.3e. [DOI] [PubMed] [Google Scholar]
- 11.Siebenlist KR, Mosesson MW, Hernandez I, Bush LA, Di Cera E, Shainoff JR, et al. Studies on the basis for the properties of fibrin produced from fibrinogen-containing γ' chains. Blood. 2005;106:2730–6. doi: 10.1182/blood-2005-01-0240. [DOI] [PMC free article] [PubMed] [Google Scholar]
- 12.Meh DA, Siebenlist KR, Mosesson MW. Identification and characterization of the thrombin binding sites on fibrin. J Biol Chem. 1996;271:23121–5. doi: 10.1074/jbc.271.38.23121. [DOI] [PubMed] [Google Scholar]
- 13.Lovely RS, Moaddel M, Farrell DH. Fibrinogen γ' chain binds thrombin exosite II. J Thromb Haemost. 2003;1:124–31. doi: 10.1046/j.1538-7836.2003.00027.x. [DOI] [PubMed] [Google Scholar]
- 14.Pospisil CH, Stafford AR, Fredenburgh JC, Weitz JI. Evidence that both exosites on thrombin participate in its high affinity interaction with fibrin. J Biol Chem. 2003;278:21584–91. doi: 10.1074/jbc.M300545200. [DOI] [PubMed] [Google Scholar]
- 15.Sabo TM, Farrell DH, Maurer MC. Conformational analysis of γ' peptide (410-427) interactions with thrombin anion binding exosite II. Biochemistry. 2006;45:7434–45. doi: 10.1021/bi060360k. [DOI] [PubMed] [Google Scholar]
- 16.Pineda AO, Chen ZW, Marino F, Mathews FS, Mosesson MW, Di Cera E. Crystal structure of thrombin in complex with fibrinogen γ' peptide. Biophysical Chem. 2007;125:556–559. doi: 10.1016/j.bpc.2006.08.005. [DOI] [PubMed] [Google Scholar]
- 17.Cooper AV, Standeven KF, Ariëns RA. Fibrinogen gamma-chain splice variant γ' alters fibrin formation and structure. Blood. 2003;102:535–40. doi: 10.1182/blood-2002-10-3150. [DOI] [PubMed] [Google Scholar]
- 18.Gersh KC, Nagaswami C, Weisel JW, Lord ST. The presence of γ' chain impairs fibrin polymerization. Thromb Res. 2009;124:356–63. doi: 10.1016/j.thromres.2008.11.016. [DOI] [PMC free article] [PubMed] [Google Scholar]
- 19.Farrell DH. Pathophysiologic roles of the fibrinogen γ chain. Curr Opin Hematol. 2004;11:151–5. doi: 10.1097/01.moh.0000131440.02397.a4. [DOI] [PubMed] [Google Scholar]
- 20.Uitte de Willige S, Standeven KF, Philippou H, Ariëns RA. The pleiotropic role of the fibrinogen γ' chain in hemostasis. Blood. 2009;114:3994–4001. doi: 10.1182/blood-2009-05-217968. [DOI] [PubMed] [Google Scholar]
- 21.Cheung EY, Uitte de Willige S, Vos HL, Leebeek FW, Dippel DW, Bertina RM, de Maat MP. Fibrinogen γ' in ischemic stroke: a case-control study. Stroke. 2008;39:1033–5. doi: 10.1161/STROKEAHA.107.495499. [DOI] [PubMed] [Google Scholar]
- 22.Drouet L, Paolucci F, Pasqualini N, Laprade M, Ripoll L, Mazoyer E, et al. Plasma γA/γ' fibrinogen ratio, a marker of arterial thrombotic activity: a new potential cardiovascular risk factor? Blood Coag Fibrinolysis. 1999;10:S35–9. [PubMed] [Google Scholar]
- 23.Kannel WB, Feinleib M, McNamara PM, Garrison RJ, Castelli WP. An investigation of coronary heart disease in families. The Framingham offspring study. Am J Epidemiol. 1979;110:281–90. doi: 10.1093/oxfordjournals.aje.a112813. [DOI] [PubMed] [Google Scholar]
- 24.CLSI . User Demonstration of Performance for Precision and Trueness; Approved Guideline – Second Edition. CLSI document IP15-A2. Clinical and Laboratory Standards Institute; 940 West Valley Road, Suite 1400, Wayne, PA 19087-1898, USA: 2005. [Google Scholar]
- 25.Fibrinogen Studies Collaboration. Kaptoge S, White IR, Thompson SG, Wood AM, Lewington S, Lowe GD, Danesh J. Associations of plasma fibrinogen levels with established cardiovascular disease risk factors, inflammatory markers, and other characteristics: individual participant meta-analysis of 154,211 adults in 31 prospective studies: the fibrinogen studies collaboration. Am J Epidemiol. 2007;166:867–79. doi: 10.1093/aje/kwm191. [DOI] [PubMed] [Google Scholar]
- 26.Zweig MH, Campbell G. Receiver-operating characteristic (ROC) plots: a fundamental evaluation tool in clinical medicine. Clin Chem. 1993;39:561–77. [PubMed] [Google Scholar]
- 27.Wang TJ, Gona P, Larson MG, Tofler GH, Levy D, Newton-Cheh C, Jacques PF, Rifai N, Selhub J, Robins SJ, Benjamin EJ, D'Agostino RB, Vasan RS. Multiple biomarkers for the prediction of first major cardiovascular events and death. N Engl J Med. 2006;355:2631–9. doi: 10.1056/NEJMoa055373. [DOI] [PubMed] [Google Scholar]
- 28.Levinson SS. Will CRP actually be useful in assessing risk of cardiovascular disease? Fats of Life Newsletter. 2002;XVI(2) Spring. [Google Scholar]
Associated Data
This section collects any data citations, data availability statements, or supplementary materials included in this article.
Supplementary Materials
Supplemental Data Table 1. Characteristics of the Framingham Offspring Cohort at Exam Cycle 7.


