

Abstract
Lentiviruses such as the human immunodeficiency virus (HIV-1) and alpharetroviruses such as Rous Sarcoma virus encode an element that spans the precursor Gag (PrGag) protein capsid (CA) C-terminus, a spacer peptide (SP), and the N-terminus of nucleocapsid (NC). Perturbation of this element causes the assembly of aberrant, non-infectious virus particles. To determine whether this element is conserved in gammaretroviruses such as the Moloney murine leukemia virus (MLV), we examined the effects of insertion mutations in the N-terminal portion of the MLV NC coding region. Interestingly, we found that insertions of as many as twenty residues after the twelfth residue of MLV NC yielded proteins that directed the efficient assembly of virus particles. Virus morphologies and crosslink profiles appeared normal, and assembled viruses retained significant levels of infectivity in single cycle infection assays. Two variants were examined in the context of replicating virus constructs, and the mutations were found to be maintained during multiple rounds of infection in a cell culture system. These results suggest that the alpharetrovirus and lentivirus assembly elements either are not needed for gammaretroviruses, or are replaced by an alternative assembly element. Our results also indicate that the N-terminal region of MLV NC is amenable to genetic manipulation.
Keywords: retrovirus, murine leukemia virus, gag, nucleocapsid
1. Introduction
The structural (Gag) proteins of mammalian and avian retroviruses are translated as polyprotein precursor Gag (PrGag) proteins that are processed by the viral protease (PR) proteins into the mature Gag proteins that define the virus structures (Coffin et al., 1997; Swanstrom and Wills, 1997). The mature Gag proteins of all of these retroviruses include matrix (MA), capsid (CA) and nucleocapsid (NC). Other less well-conserved proteins also are encoded by gag, and the spacings between MA, CA, and NC also vary between avian and mammalian retrovirus types (Coffin et al., 1997; Swanstrom and Wills, 1997). Analysis of the similarities and differences among retrovirus Gag proteins has helped in characterization of the various functions of these proteins, and sequence heterogeneity near the N-termini of NC proteins has prompted us to examine this region.
In general, structural features of the MA, CA, and NC proteins tend to be conserved across retroviruses (Coffin et al., 1997; Swanstrom and Wills, 1997). However, there are some notable differences among retrovirus NC proteins. One feature that distinguishes spumaretroviruses from other retroviruses is the absence of a NC zinc finger motif (Coffin et al., 1997; Swanstrom and Wills, 1997). Another distinction is that gammaretroviruses such as Moloney murine leukemia virus (MLV) have only one NC zinc finger, whereas alpharetroviruses such as Rous sacoma virus (RSV), betaretroviruses such as mouse mammary tumor virus (MMTV), and lentiviruses such has the human immunodeficiency virus type 1 (HIV-1) have two zinc fingers (Coffin et al., 1997; Swanstrom and Wills, 1997). Gammaretroviruses also differ from alpharetroviruses and lentiviruses in that they lack a spacer peptide (SP) between CA and NC. Interestingly, evidence suggests that the region spanning the RSV and HIV-1 CA C-terminus, SP, and the NC N-terminus forms a helix in PrGag proteins, and perturbation of the RSV and HIV-1 SP sequences causes the assembly of aberrant virus particles (Borsetti et al., 1998; Craven et al., 1993; Gross et al., 1998, 2000; Guo and Liang, 2005; Keller et al., 2008; Krausslich et al., 1995; Wright et al., 2007).
Comparison of gammaretrovirus CA-NC juncture sequences shows considerable variability. As illustrated in Figure 1A, shortly after the CA-NC cleavage site, the N-terminal portion of NC is poorly conserved with some differences in length. In particular, relative to MLV, rat leukemia virus (RLV) and gibbon ape leukemia virus (GaLV) carry extra residues, while feline leukemia virus (FLV) and porcine endogenous retrovirus (PER) respectively have five and twelve extra residues (Figure 1A). To examine the structural constraints on this region of gammaretrovirus Gag proteins, we characterized seven insertion mutations in the N-terminal region of MLV NC. Surprisingly, the mutations were well tolerated with regard to virus particle assembly. Insertion of as many as nineteen residues yielded virus cores with wild type (WT) morphologies, and NC crosslinking profiles similar to that of the WT NC proteins. Moreover, except for an insertion of the entire green fluorescence protein (GFP), the mutant viruses replicated in a single cycle infection system, and ones tested in a native virus context were maintained over a number of replication cycles. Our results support the notion that gammaretroviruses do not have strict structural requirements for the N-terminal portion of NC, and that the roles of this region in alpharetroviruses and lentiviruses are covered by other elements in gammaretrovirus PrGag proteins.
Figure 1. Viral variants.
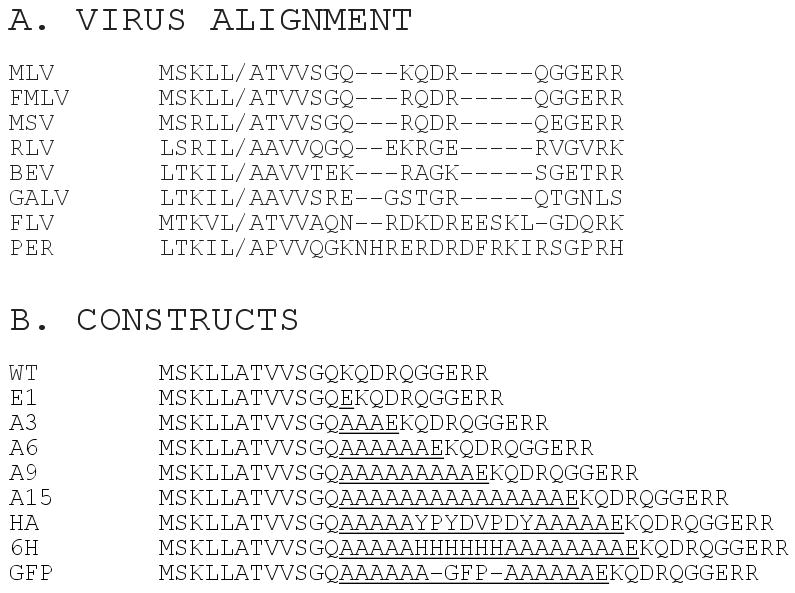
(A) Shown is an amino acid alignment of CA-NC juncture sequences, with the CA-NC cleavage site indicated by the slash, and gaps indicated by dashes. Sequences derive from the following database entries: MLV (Moloney murine leukemia virus, gb AAC82566.1), FMLV (Friend murine leukemia virus, dbj BAA22065.1), MSV (Moloney murine sarcoma virus, gb AAC82570.1), RLV (Rat leukemia virus, gb AAC78248.1), BEV (Baboon endogenous virus, dbj BAA89659.1), GALV (Gibbon ape leukemia virus, gene ID 1491894 gag), FLV (Feline leukemia virus, gene ID: 1724726 gag-pro-pol), and PER (Porcine endogenous retrovirus, gb AAL87855.1). Note that the entire PER NC protein is eleven residues longer than the MLV protein, most of which is due to the insertion shown in the alignment; while the FLV NC is slightly shorter than the MLV NC, due to a C-terminal truncation. (B) Amino acid sequences of WT and Gag variant proteins in the CA-NC juncture regions are shown. The first five residues depicted (MSKLL) represent the last five residues encoded by CA. Inserted residues are underlined, and -GFP- indicates an insertion of the coding region for the green fluorescent protein. Nucleotide sequences are provided in the Materials and Methods section.
2. Methods
2.1 Recombinant DNA constructs
WT and NC insertion mutations were created in the parental MLV expression construct, pXM-GPE that has been described previously (Hansen and Barklis, 1995; McDermott et al., 2000). In some cases, mutations also were transfered into the plasmid ProMoSup, a variant of the Sup virus construct (Reik et al., 1985) that carries a full-length MLV provirus encoding a bacterial suppressor tRNA gene in the U3 region of both long terminal repeats (LTRs): the provirus is cloned between the pBR322 EcoRI and (killed) HindIII sites. Mutations E1, A3, A6 and A9 were generated as oligonucleotide insertions in place of WT MLV RNA nt residues 2070-2081. Mutations A15, HA, 6H and GFP were constructed as oligonucleotide or DNA fragment insertions into the A9 variant, taking advantage of the SacII site created in the A9 construct. Sequences of the mutations in the NC coding region covering WT MLV RNA nt 2070-2081 (NC residues 6-9; GQKQ) are as follows, with inserted nucleotides in bold: WT, GGA CAG AAA CAG; E1, GGC CAG GAG AAA CAG; A3, GGA CAG GCA GCT GCG GAG AAA CAG; A6, GGA CAG GCC GCC GCG GCC GCC GCC GAG AAA CAG; A9, GGA CAG GCC GCC GCC GCG GCC GCT GCA GCC GCC GAG AAA CAG; A15, GGA CAG GCC GCC GCC GCG GCC GCG GCA GCT GCC GCG GCC GCT GCA GCC GCC GAG AAA CAG; HA, GGA CAG GCC GCC GCC GCG GCC TAC CCA TAT GAC GTC CCC GAC TAC GCG GCC GCT GCA GCC GCC GAG AAA CAG; 6H, GGA CAG GCC GCC GCC GCG GCC CAT CAT CAT CAC CAC CAC CAC GCA GCT GCG GCC GCT GCA GCC GCC GAG AAA CAG; GFP, GGA CAG GCC GCC GCC GCG GCC GCG CTA GCG CTA CCG GTC GCC ACC ATG … green fluorescent protein … AAG TCC GGA CTC AGA TCT GCG GCC GCT GCA GCC GCC GAG AAA CAG. Note that for the green fluorescent protein (GFP) construct, the GFP coding region came from pEGFP-C1, and the first and last GFP residue codons are underlined. Other plasmids used were a vesicular stomatitis virus (VSV) glycoprotein expression construct pVSV-G (Scholz et al., 2005, 2008), and B2-BAG (Berwin and Barklis, 1993; Kempler et al., 1993), which is a MLV retroviral vector that expresses the Esherichia coli (E. coli) β-galactosidase (β-gal) protein.
2.2 Cells and viruses
Human 293T cells, mouse 3T3 fibroblasts, and Rat1 fibroblasts were grown in Dulbecco's modified Eagles media (DMEM) supplemented with penicillin, streptomycin, and 10 mM Hepes, pH 7.4. Transient transfections were performed via calcium phosphate precipitation and routinely were performed with 293T cells as described previously (Scholz et al., 2005, 2008). When pXM-GPE or ProMoSup constructs were transfected alone, 24 ug DNA samples were transfected onto 2.5 million cells on 10 cm plates. For collection of cells for biochemical analyses, three days post-transfection, media samples were removed, cells were washed with phosphate buffered saline (PBS; 9.5 mM sodium potassium phosphate [pH 7.4], 137 mM NaCl, 2.7 mM KCl), scraped into 1 ml of PBS, pelleted, aspirated and either used directly or frozen at -80°C for future use. Virus samples for biochemical assays were collected from media samples, cleared by low speed centrifugation 10 min at 4°C. After the clearing step, 10 ml virus samples were centrifuged (197,000 × g, 45 min, 4°C) through 2 ml cushions of 20% sucrose in PBS, while larger volume samples (30-35 ml) were centrifuged (83,000 × g, 2 h, 4°C) through 5 ml cushions of 20% sucrose in PBS. Virus pellets ordinarily were suspended in 0.1 ml PBS per 10 ml of original media, and used immediately or stored at -80°C.
For infection assays using β-gal as a reporter, transfections instead employed 6 ug pVSV-G plus 6 ug B2-BAG plus 12 ug of wt or mutant pXM-GPE plasmids. At three days post-transfection, media samples were filtered through 0.45 micron filters, diluted in growth media as necessary and supplemented with 8 ug/ml polybrene from a 1.6 mg/ml stock. Diluted virus samples (2 ml) were applied to 0.1 million Rat1 cells on 6 well (30 mm diameter) plates, and 5% of the cells from each infection sample were split two days later into 0.1 ml media on 96 well plates. One day after this split, β-gal assays were performed to score infection. To do so, a modification of the standard colorimetric assay (Jones et al., 1990; Scholz et al., 2008; Wang et al., 1994) was used. Specifically, wells were aspirated, supplemented with 40 ul of 0.1% sodium dodecyl sulfate (SDS) in PBS, incubated at 25°C 5 min, and supplemented with PM2 buffer (33 mM NaH2PO4, 66 mM Na2HPO4, 0.1 mM MnCl2, 2 mM MgSO4, 40 mM β-mercaptoethanol [β-Me]). Enzymatic reactions were initiated by the addition of 4 mg/ml 2(ortho)-nitrophenyl-β-D-galactopyranoside (ONPG; Sigma N1127) in PM2, and product formation was measured spectrophotometrically by reading light absorption at 420 nm. Raw 420 nm optical density (OD) values were normalized to viral capsid protein levels (determined by immunoblotting as described below), and infection results then were normalized to results with wt infections performed in parallel.
For infections using ProMoSup viruses, transfections and virus collection steps proceeded as detailed above. One ml filtered virus samples were mixed with 1 ml growth media plus 10 ul 1.6 mg/ml polybrene, applied to 0.25-0.5 million 3T3 or Rat1 cells on 10 cm plates, and the plates were incubated for 3 h with rocking once at 1.5 h. After that, plates were supplemented with 8 ml growth media and grown normally. For maintenance of virus-infected cell lines, cells were split routinely twice a week at 1:10 to 1:40 split ratios. For examination of virus infectivity, filtered media samples from ProMoSup-infected cells were used to infect naive cells, using the protocol outlined above. For scoring ProMoSup infections, infected and mock-infected cells (and their respective virus-containing media samples) were collected for biochemical analysis as described above, and Gag protein levels in the samples were monitored as described below.
2.3 Protein analysis
For routine protein analysis, cell samples (10% of pellets from each 10 cm plate) were suspended in IPB (20 mM Tris–HCl [pH 7.5], 150 mM NaCl, 1 mM ethylenediamine tetraacetic acid [EDTA], 0.1% SDS, 0.5% sodium deoxylate, 1.0% Triton X-100, 0.02% sodium azide), incubated on ice for 5 min, vortexed, and subjected to centrifugation 13,000 × g for 15 min at 25°C. Soluble material was collected, mixed with 1 volume of 2× sample buffer (12.5 mM Tris–HCl [pH 6.8], 2% SDS, 20% glycerol, 0.25% bromophenol blue) and 0.1 volume of β-Me. For virus samples, 20 ul aliquots of resuspended virus pellets (20% of the total virus sample from each 10 cm plate) were mixed with 1 volume of 2× sample buffer and 0.1 volume of β-Me. Cell and virus samples were heated to 95 °C for 3 to 10 min, and subjected to SDS-polyacrylamide electrophoresis (SDS-PAGE) using 7.5%-12% acrylamide Laemmli gels (Hansen and Barklis, 1995; Hansen et al., 1993; Jones et al., 1990; McDermott et al., 2000; Scholz et al., 2005, 2008; Wang and Barklis, 1993; Wang et al., 2004; Zhang et al., 1998) or 16% acrylamide Schagger and von Jagow gels (Alfadhli et al., 2002; Scholz et al., 1995). After SDS-PAGE fractionation, proteins were electroblotted, and immunoblotted following previously described methods (Hansen and Barklis, 1995; Hansen et al., 1993; Jones et al., 1990; McDermott et al., 2000; Scholz et al., 2005, 2008; Wang and Barklis, 1993; Wang et al., 2004; Zhang et al., 1998). Primary antibodies employed were as follows: mouse anti-p12 Hy548 (Hansen and Barklis, 1995; Hansen et al., 1993; McDermott et al., 2000;), used at 1:15 from cell culture media; mouse anti-CA Hy187 (11-12, 20), used at 1:15 from cell culture media; a mixture of goat anti-AKRNC (National Cancer Institute HE854 and HC733, obtained from Viromed, Camden, NJ), each used at 1:2000; mouse anti-HA 3F10 (Roche), used at 1:1000; and mouse anti-HA 12CA5, used at 1:15 from cell culture media. Secondary antibodies were alkaline phosphatase-conjugated rabbit anti-mouse IgG(H+L) (Promega), used at 1:15,000 or rabbit anti-goat IgG (Sigma A4062), used at 1:6,000. Color reactions for visualization of antibody-bound bands employed nitrobluetetrazolium plus 5-bromo-4-chloro-3-indolyl phosphate in AP buffer (100 mM Tris–hydrochloride [pH 9.5], 100 mM NaCl, 5 mM MgCl2). For quantitation, immunoblots were air-dried and scanned using an Epson G810A scanner. Band intensities of scanned TIFF images were quantitated using NIH Image J software. Size standards employed were SeeBlue prestained size standards (Invitrogen), or SDS-PAGE Broad Range prestained size standards (BioRad).
For crosslinking studies, cell or virus samples in 0.1 ml of PBS were treated with 0.1 or 1 mM bis-maleimidohexane (BMH; Pierce) in dimethylsulfoxide (DMSO; final reaction concentration, 1%) at 25°C for 60 min, after which samples were processed for SDS-PAGE as described above. An alternative crosslinking protocol used 0.015-0.15% glutaraldehyde for 2 min at 25°C, followed by reaction quenching via addition of 1/4 volume of 600 mM glycine, and processing as described above. Testing of the nickel-nitrilotriacetic acid (Ni-NTA; Qiagen) resin-binding capacity of hexahistidine-tagged proteins employed cell or virus lysates in binding buffer (20 mM Tris [pH 7.5], 100 mM KCl, 5% glycerol, 0.1 mM β-Me, 0.5 mM phenylmethanesulfonyl fluoride [PMSF]), washes with binding buffer, and elutions in elution buffer (50 mM sodium phosphate [pH 6.0], 500 mM NaCl, 250 mM imidazole, 10% glycerol, 20 mM EDTA). Proteins in unbound, wash and elution fractions were monitored by immunoblotting.
2.4 Microscopy
Indirect immunofluorescence localization of Gag proteins in cells followed previously described protocols (Scholz et al., 2008; Wang et al., 1993). Primary antibodies were the anti-p12 Hy548 and anti-CA Hy187 antibodies described above, and were used undiluted from hybridoma cell culture media. The secondary antibody was Alexafluor-594-conjugated goat anti-mouse IgG (Invitrogen), used at 1:1000. Electron microscopy (EM) of negatively stained virus particles was performed as described previously (Scholz et al., 2005). Briefly, centrifugation-concentrated virus particle samples were lifted for 2 min onto carbon-coated UV-treated EM grids, rinsed for 15 s in water, stained for 1 min in filtered 1.3% uranyl acetate, wicked, and dried. EM images were collected on a Philips CM120/Biotwin TEM equipped with a Gatan 794 multiscan charge-coupled device (CCD) camera. Virus particle diameters were determined with the aid of Gatan digital micrograph software.
2.5 Amplification and sequence analysis of viral gag sequences
DNA samples from ProMoSup virus-infected cells were extracted from cell samples that were solubilized in IPB. Samples were digested 2 h at 50°C in 0.1 mg/ml proteinase K (Boehringer) and then extracted twice with phenol, and once with chloroform. Final aqueous fractions were supplemented with 1/10 volume of 3 M sodium acetate (pH 7.6), and ethanol precipitated 1 h at -80°C with 2.5 volumes of ethanol. Pelleted ethanol precipitates were air dried, suspended in 10 mM Tris (pH 7.4) plus 0.1 mM EDTA and used for polymerase chain amplification (PCR). PCR reactions used Accuprime Pfx (Invitrogen) and 45 cycles of amplification using 30 sec 95°, 1 min 60°C, and 2 min 68°C incubations per amplification cycle. Primers for amplification corresponded to M-MLV viral nt 547-569 and 2313-2293. Amplified products were cloned into pGemTEasy plasmid vectors and sequenced using primers corresponding to the following M-MLV viral nt: 547-569, 1266-1288, 2119-2100, and 2313-2293.
3. Results
3.1 Analysis of virus assembly and release
To examine the function of the N-terminal region of MLV NC, eight insertion variants were constructed (Figure 1B). Relative to the WT MLV NC, we created a variant with a single extra glutamate residue (E1), like RLV, as well as variants with the glutamate plus increasing numbers of alanine residues (A3, A6, A9, A15). Versions with inserted hemagglutinin (HA) and hexa-histidine (6H) tags also were made, as was a variant carrying an insertion of the entire green fluorescent protein (GFP; Scholz et al., 2008).
Initially, we tested the capacity of WT and mutant Gag proteins to direct the assembly of virus particles, using a parental construct (pXM-GPE; Hansen and Barklis, 1995; McDermott et al., 2000) that expresses the MLV Gag, Pol, and envelope (Env) proteins. To do so, constructs were transfected into 293T cells, and levels of Gag proteins in viral and cell samples were monitored by immunoblotting, as we have done previously (Hansen and Barklis, 1995; Hansen et al., 1993; Jones et al., 1990; McDermott et al., 2000; Scholz et al., 2005, 2008; Wang and Barklis, 1993; Wang et al., 2004; Zhang et al., 1998) or 16% acrylamide Schagger and von Jagow gels (Alfadhli et al., 2002; Scholz et al., 1995). As illustrated in Figure 2 (left panel) our anti-p12 antibody detected roughly equivalent levels of PrGag proteins in cell samples (Figure 2, lanes A-I). As expected, the GFP construct yielded a PrGag protein roughly 25 kDa larger than WT PrGag. Also observed were previously observed p27 bands (Hansen and Barklis, 1995; McDermott et al., 2000) composed of a MA-p12 intermediate, and these appeared more pronounced in the HA, 6H and GFP lanes (Figure 2, lanes G-I).
Figure 2. Cell and viral proteins.

Cell lysate (A-I) and virus (J-R) samples from 293T cells transfected with different pXM-GPE gag-pol-env expression constructs were collected 72 h post-transfection. Proteins in samples were separated by SDS-PAGE, and viral proteins were detected by immunoblotting with a primary anti-p12 antibody (A-I) or a primary anti-CA antibody (J-R). Viral variants from which the samples are derived are indicated on the bottom of each panel. At the left hand side of each panel are prestained size standards, and the sizes of the markers are as indicated. Also indicated are the migration positions of WT PrGag, viral CA, and cellular p27 (MA plus p12) proteins.
To detect CA and PrGag bands in viral samples, immunoblotting was conducted with an anti-CA primary antibody (Figure 2, lanes J-R). As shown, the levels of PrGag processing varied somewhat, as indicated by the ratios of viral CA to PrGag proteins. Among the NC insertion mutants, this was most notable with the GFP insertion, which showed only very low virus-associated CA levels, and high levels of the largest (PrGag) protein, as well as a processing intermediate. Using an anti-p12 antibody to detect cellular Gag protein levels, a p27 (MA + p12) kDa product was also observed, particularly with the HA, 6H, and GFP variants. Because the contribution of p27 proteins towards virus assembly and release is unknown, virus release levels were determined by comparison of viral PrGag plus CA levels to cellular PrGag levels. Using this ratio, it was observed that none of the NC insertion mutants demonstrated dramatic release defects (Figure 3). These results were corroborated by Gag immunofluorescence localization studies, which showed similar Gag cellular distribution profiles for WT and all variant expression constructs (data not shown).
Figure 3. Normalized virus release levels.

Virus release levels were determined from immunoblots of cell and virus samples, prepared as shown in Figure 2. Cellular PrGag and viral PrGag plus CA levels were quantitated densitometrically, raw release levels were calculated as viral PrGag plus CA levels divided by cellular PrGag levels, and normalized release levels were determined by dividing raw release levels by raw release level values obtained with the WT construct performed in parallel at the same time. Values derive from the following numbers of independent experiments: E1, 9; A3, 4; A6, 5; A9, 6; A15, 4; HA, 6; 6H, 7; GFP, 4.
3.2 Characterization of virus proteins and particles
For an additional analysis of virus-associated proteins, we chose to compare NC crosslinking profiles of WT virions, and HA virions, so as to take advantage of available high quality anti-HA antibodies. To do so, intact virion proteins were crosslinked with the membrane-permeable, cysteine-specfic crosslinker BMH (Hansen and Barklis, 1995; McDermott et al., 2000), products were separated by electrophoresis, and subsequently detected by immunoblotting using either a primary mouse monoclonal anti-HA antibody, or a lower quality mix of goat-anti-NC antisera. Our results with anti-NC and WT viruses (Figure 4A-C) demonstrate that NC proteins can be crosslinked to form dimers by BMH. Importantly, NC proteins from the HA insert are about 2 kDa larger than their WT counterparts, consistent with the 19 residue insert size (Figure 4D-F). Moreover, monomer and dimer HA NC bands are evident, as with the WT sample. Similar results were obtained by glutaraldehyde crosslinking (data not shown).
Figure 4. Crosslink analysis of NC proteins.

WT (A-C, G-I) and HA (D-F, J-L) virus samples were mock-treated (A, D, G, J) or crosslinked with 0.1 mM (B, E, H, K) or 1 mM (C, F, I, L) BMH. After crosslinking, protein samples were separated by SDS-PAGE on a 16% acrylamide gel, and proteins were detected by immunoblotting with primary anti-NC antibodies (A-F) or a primary anti-HA antibody (G-L). Marker proteins were separated in lane M, and their sizes are indicated on the right hand side. Also indicated are the migration positions of the PrGag proteins, the WT monomer (NC) and dimer ([NC]2) proteins, and the HA nucleocapsid monomer (HANC) and dimer ([HANC]2) proteins.
Not surprisingly, other than a faint artifact between Figure 4 lanes I and J, the HA-specific antibody did not detect WT NC proteins. However, as expected, the antibody detected HA NC monomer and dimer bands (Figure 4, J-L). Higher crosslink bands also were observed. These included the lowest mobility bands in lanes K and L, which presumably represent PrGag dimers (Hansen and Barklis, 1995; McDermott et al., 2000). They also included bands above the 34 kDa and 45 kDa marker (lane M) bands, which are likely to be higher order crosslinked NC species. We believe that these were not clearly observed with the anti-NC antibody (D-F) either because of the lower quality of the anti-NC sera, or the importance of some crosslinked residues for anti-NC sera detection. Despite these minor differences, our data demonstrate that the HA tag is maintained on HA NC proteins, and that the HA NC proteins crosslink to form dimers with a similar efficiency as the WT NC proteins.
Another approach for assessing the effects of NC insertions on particle structure is to examine purified particles by negative stain electron microscopy (EM). We performed such studies with WT and HA particles. Consistent with the morphology of MLV particles (1-2), galleries of WT (Figure 5A-H) and HA (Figure 5I-P) gave similar pictures of roughly spherical particles containing roughly spherical cores. We measured the diameters of a sample of WT and HA particles (Figure 6), and found average values for HA particles to be slightly larger than their WT counterparts, although the differences observed were within the standard deviations of the samples.
Figure 5. Analysis of virus morphologies.
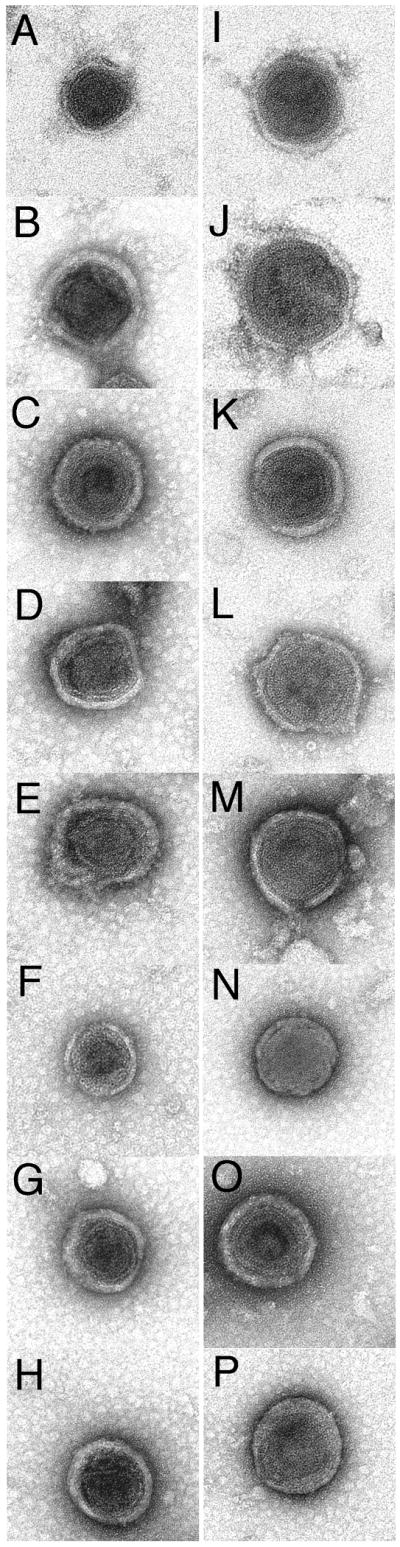
Purified WT (A-H) and HA (I-P) viruses produced from pXM-GPE-transfected 293T cells were applied to carbon-coated 300 mesh copper EM grids, stained with uranyl acetate, dried, and imaged by transmission electron microscopy as described in the Materials and Methods.
Figure 6. Analysis of virus diameters.
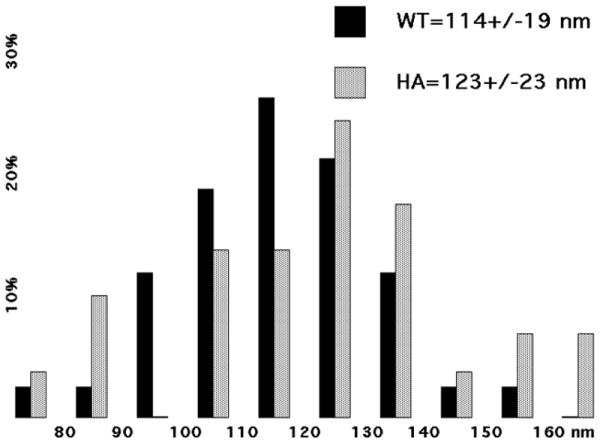
Diameters of WT and HA viruses were measured from EM images produced as described in Figure 5. Diameter values are plotted as a histograms of the percentages of viruses observed within the indicated 10 nm bins. WT virus (N=42) values are shown in black, while HA virus values (N=29) are shown in gray. Average virus diameters are given above the plot.
3.3 Virus infectivity
The most important test of virus core structure fidelity is virus infectivity. We performed these tests by transfecting 293T cells with pXM-GPE constructs along with a VSV glycoprotein expression construct (pVSV-G) and the packageable MLV retrovirus vector, B2-BAG, which carries a β-galactosidase reporter gene for scoring virus infection. Viruses so prepared were normalized for their CA contents, and used to infect target Rat1 cells. In this regard, it should be noted that normalization for CA may give slightly different results than normalization for viral reverse transcriptase or total Gag levels. Given this caveat, relative to WT infection levels, the infectivity levels of the E1 variant were approximately equivalent, perhaps reflecting that this insertion is a natural one in RLV (Figure 7). Moreover, with the exception of the GFP virus, all viruses retained capabilities for virus infection (Figure 7). Indeed the least infectious of these still was >20% as infectious as WT.
Figure 7. Virus infectivity.

Viruses were produced by transfection of 293T cells with the indicated pXM-GPE constructs, plus the VSV glycoprotein expression construct (pVSV-G), and the β-gal retroviral vector expression construct, B2-BAG. Viruses were collected and filtered, and used to infect Rat1 cells as described in the Materials and Methods section. Raw infectivity values were derived from β-gal activity levels in infected target cells, normalized to virus CA input levels to obtain CA-normalized infection levels. The CA-normalized levels then were normalized to WT infection levels determined in parallel at the same time. Values are shown as percentages of WT infectivity and derive from the following numbers of independent experiments: E1, 4; A3, 3; A6, 4; A9, 4; A15, 3; HA, 4; 6H, 3; GFP, 2.
Given our unexpected infection results, we constructed full length MLV versions of WT, HA and 6H in the context of ProMoSup provirus (Reik et al., 1985), transfected them into 293T cells and then scored their passage in 3T3 and Rat1 cells. Importantly, both HA and 6H viruses were able to infect Rat1 cells on multiple rounds of re-infection, and were stable with regard to the production of infectious virus in Rat1 cells that were passaged over fifty times (data not shown). An example of this replication competence is presented in Figure 8. Here Rat1 cells were mock-infected, or infected with WT or HA ProMoSup viruses, and replication kinetics were monitored for two weeks post-infection. As shown, HA virus replication tracked similarly to the WT virus with only slightly diminished virus signals. Anti-CA immunoblotting of infected cell samples showed the expected PrGag bands (Figure 9, lanes B-C), while anti-HA immunoblotting showed an HA-specific cellular PrGag band for the HA virus-infected cells (Figure 9, lanes E-G). We also monitored ProMoSup viruses released from the infected Rat1 cells by immunoblotting for NC. As illustrated in Figure 9, lanes I-J, the HA tag was maintained in HA ProMoSup viruses. In separate studies, we also showed that Gag proteins of 6H viruses maintained their capabilities to bind nickel-NTA resin (data not shown). These results were corroborated by sequence analysis of triplicate samples of ProMoSup WT, HA and 6H viruses at six weeks post-infection. Specifically, proviral gag sequences were PCR-amplified from infected cell DNA, and the NC regions were sequenced and compared to that of the WT virus. These analyses yielded no changes in the inserted mutant sequences, and no differences in the neighboring CA C-terminal and NC regions (data not shown). Overall, these results indicate that unlike alpharetroviruses and lentiviruses (Borsetti et al., 1998; Craven et al., 1993; Gross et al., 1998, 2000; Guo and Liang, 2005; Keller et al., 2008; Krausslich et al., 1995; Wright et al., 2007), gammaretroviruses tolerate significant perturbations in the N-terminal region of NC.
Figure 8. Analysis of replication kinetics.

Rat1 cells were mock-infected (mock), or infected with WT or HA viruses, after which virus replication was tracked by measuring Gag (PrGag + CA) protein levels in infected cells for two weeks post-infection. Input virus levels were equivalent based on Gag protein levels, and Gag protein levels in the chart were normalized to the WT fourteen day Gag protein level.
Figure 9. Analysis of replication competent viruses.

Mock-infected (mock) Rat1 cells, or cells infected with replication-competent WT or HA ProMoSup viruses were used as sources for cell (A-C, E-G) and virus (H-J) samples that were prepared at four weeks post-infection as described in the Materials and Methods. Proteins in samples were separated by SDS-PAGE and subjected to immunoblot detection with primary anti-CA (A-C), anti-HA (E-G) or anti-NC (H-J) antibodies. Marker proteins were electrophoresced in lanes D and K, and the sizes of the markers are provided respectively on the left and right hand sides of the figure. Also shown are the migration locations of WT PrGag, WT NC (NC), and HA NC (HANC) proteins.
Discussion
Evidence indicates that retrovirus PrGag proteins follow a sequence of conformational changes during virus assembly and morphogenesis (Coffin et al., 1997; Swanstrom and Wills, 1997). For the alpharetrovirus RSV, and the lentivirus HIV-1, an element that spans the CA C-terminus, SP, and the NC N-terminus and is predicted to form a helix plays an important role in this process (Borsetti et al., 1998; Craven et al., 1993; Gross et al., 1998, 2000; Guo and Liang, 2005; Keller et al., 2008; Krausslich et al., 1995). In immature HIV-1 particles, this element may form a six helix bundle at the base of HIV-1 CA hexamer rings (Wright et al., 2007). Deletion of the HIV-1 SP in vivo inhibits particle production, whereas in vitro, it promotes the assembly of Gag tubes, at the expense of sphere structure assembly (Gross et al., 1998, 2000). Consistent with these observations are results with RSV. Specifically, mutations that affect the region from the last eight residues of CA, through all of SP, and to the fourth residue of NC cause the assembly of aberrant tubular particles, supporting the notion that this element is essential for the formation of immature Gag shells (Keller et al., 2008). Interestingly, this same region in HIV-1 Gag is targeted by a bettulinic acid analogue virus inhibitor that blocks proper virus maturation (Adamson et al., 2006; Li et al., 2003, 2006; Sakalian et al., 2006; Zhou et al., 2004a, 2004b, 2005).
Is a similar element present at the juncture of gammaretrovirus CA and NC domains? Our results suggest that this is not the case. Most of our MLV variants that encode extra residues at the NC N-terminus showed only modest phenotypic effects, with an insertion of the entire GFP protein as the one significant exception. The GFP variant, and to a lesser extent the HA and 6H variants, showed processing anomalies, particularly in cell lysates (Figure 2), but release levels were comparable with WT levels (Figure 3). This does not seem to be due to clipping of N-terminal NC additions in virus particles, as evidenced by the detection of HANC proteins in virions (Figure 4). The HA insertion also showed minimal effects on detectable mature ribonucleoprotein or core properties. In particular, both WT and HA NC proteins preferentially crosslinked as dimers (Figure 4), and HA virus morphologies were generally indistinguishable from WT (Figure 5), although the cores may be slightly larger (Figure 6).
Most importantly, with the exception of the GFP virus, all NC insertion viruses were at least 20% as infectious as WT in single round assays (Figure 7). Furthermore, replication competent versions of HA (and H6) viruses maintained their mutations (Figure 8) and did not acquire additional NC mutations over 50 passages in cell culture. Taken together, these data demonstrate that the assembly element that crosses the CA CTD, SP and N-terminus of NC in alpharetroviruses and HIV (Borsetti et al., 1998; Craven et al., 1993; Gross et al., 1998, 2000; Guo and Liang, 2005; Keller et al., 2008; Krausslich et al., 1995) is not present at the N-terminus of MLV NC. Does another element replace this element for gammaretroviruses? One possibility is that such a function is provided by the MLV “charged assembly helix” (Cheslock et al., 2003), located near the MLV CA C-terminus. Notably, complete deletion of this motif yielded non-infectious, aberrant virions (Cheslock et al., 2003), suggesting that the MLV charged assembly helix may serve the function of the element that includes SP retroviruses such as RSV and HIV. Our results support a scenario in which the presence but not locations of assembly elements may be conserved among retroviruses, and indicate that the N-terminal region of MLV NC tolerates modification.
5. Conclusions
Our studies provide further evidence that the alpharetrovirus and lentivirus Gag protein assembly element that spans the CA C-terminus, SP, and the NC N-terminus is not conserved in gammaretroviruses. Seven MLV variants with insertions in the N-terminal region of NC assembled efficiently and were infectious. Detailed studies on a subset of these showed that they had wild type crosslinking profiles and morphologies, and that mutations were maintained during multiple rounds of replication in cell culture. These results suggest that the alpharetrovirus and lentivirus assembly elements either are not needed for gammaretroviruses, or are replaced by an alternative assembly element. Our results also indicate that the N-terminal region of MLV NC is amenable to genetic manipulation.
Acknowledgments
We are grateful to Ayna Alfadhli, Robin Barklis, Jake Eccles, Claudia Lopez, Henry McNett, Colleen Noviello, Daniel Pauw, Isabel Scholz, Rachel Sloan, and Mike Webb for help and advice. This research was supported by National Institutes of Health grants GM060170 and AI071798 to EB.
Footnotes
Conflict of Interest: The authors declare that they have no competing interests.
Publisher's Disclaimer: This is a PDF file of an unedited manuscript that has been accepted for publication. As a service to our customers we are providing this early version of the manuscript. The manuscript will undergo copyediting, typesetting, and review of the resulting proof before it is published in its final citable form. Please note that during the production process errors may be discovered which could affect the content, and all legal disclaimers that apply to the journal pertain.
Contributor Information
Amelia Still, Email: astill@wisc.edu.
Douglas Huseby, Email: dlhuseby@ucdavis.edu.
References
- Adamson C, Ablan S, Boeras I, Goila-Guar R, Soheilian F, Nagashima K, Li F, Salzwedel K, Sakalian M, Wild C, Freed E. In vitro resistance to the human immunodeficiency virus type 1 maturation inhibitor PA457 (Bevirimat) J Virol. 2006;80:10957–10971. doi: 10.1128/JVI.01369-06. [DOI] [PMC free article] [PubMed] [Google Scholar]
- Alfadhli A, Steel E, Finley L, Bchinger H, Barklis E. Hantavirus nucleocapsid protein coiled-coil domains. J Biol Chem. 2002;277:27103–27108. doi: 10.1074/jbc.M203395200. [DOI] [PubMed] [Google Scholar]
- Berwin B, Barklis E. Retrovirus-mediated insertion of expressed and non-expressed transcription units into identical chromosomal sites. Nucleic Acids Research. 1993;21:2399–2407. doi: 10.1093/nar/21.10.2399. [DOI] [PMC free article] [PubMed] [Google Scholar]
- Borsetti A, Ohagen A, Gottlinger HG. The C-terminal half of the human immunodeficiency virus type 1 Gag precursor is sufficient for efficient particle assembly. J Virol. 1998;72:9313–9317. doi: 10.1128/jvi.72.11.9313-9317.1998. [DOI] [PMC free article] [PubMed] [Google Scholar]
- Cheslock S, Poon D, Fu W, Rhodes T, Henderson L, Nagashima K, McGrath C, Hu WS. Charged assembly helix motif in murine leukemia virus capsid: an important region for virus assembly and particle size determination. 2003 doi: 10.1128/JVI.77.12.7058-7066.2003. [DOI] [PMC free article] [PubMed] [Google Scholar]
- Coffin J, Hughes S, Varmus H. Retroviruses. Cold Spring Harbor Laboratory Press; Cold Spring Harbor, NY: 1997. [PubMed] [Google Scholar]
- Craven R, Leure-duPree A, Erdie C, Wilson C, Wills JW. Necessity of the spacer peptide between CA and NC in the Rous sarcoma virus gag protein. J Virol. 1993;67:6246–6252. doi: 10.1128/jvi.67.10.6246-6252.1993. [DOI] [PMC free article] [PubMed] [Google Scholar]
- Gross I, Hohenberg H, Huckhagel C, Krausslich HG. N-terminal extension of human immunodeficiency virus capsid protein converts the in vitro assembly phenotype from tubular to spherical particles. J Virol. 1998;72:4798–4810. doi: 10.1128/jvi.72.6.4798-4810.1998. [DOI] [PMC free article] [PubMed] [Google Scholar]
- Gross I, Hohenberg H, Wilk T, Wiegers K, Grattinger M, Muller B, Fuller S, Krausslich HG. A conformational switch controlling HIV-1 morphogenesis. EMBO J. 2000;19:103–113. doi: 10.1093/emboj/19.1.103. [DOI] [PMC free article] [PubMed] [Google Scholar]
- Guo X, Liang C. Opposing effects of the M368A point mutation and deletion of the SP1 region on membrane binding of human immunodeficiency virus type 1 Gag. Virology. 2005;335:232–241. doi: 10.1016/j.virol.2005.03.004. [DOI] [PubMed] [Google Scholar]
- Hansen M, Barklis E. Structural interactions between retroviral Gag proteins examined by cysteine crosslinking. J Virol. 1995;69:1150–1159. doi: 10.1128/jvi.69.2.1150-1159.1995. [DOI] [PMC free article] [PubMed] [Google Scholar]
- Hansen M, Jelinek L, Jones R, Barklis E. Assembly and Composition of Intracellular particles formed by Moloney murine leukemia virus. J Virol. 1993;67:5163–5174. doi: 10.1128/jvi.67.9.5163-5174.1993. [DOI] [PMC free article] [PubMed] [Google Scholar]
- Jones T, Blaug G, Hansen M, Barklis E. Assembly of gag-B galactosidase proteins into retrovirus particles. J Virol. 1990;64:2265–2279. doi: 10.1128/jvi.64.5.2265-2279.1990. [DOI] [PMC free article] [PubMed] [Google Scholar]
- Keller P, Johnson M, Vogt V. Mutations in the spacer peptide and adjoining sequences in Rous Sarcoma virus Gag lead to tubular budding. J Virol. 2008;82:6788–6797. doi: 10.1128/JVI.00213-08. [DOI] [PMC free article] [PubMed] [Google Scholar]
- Kempler G, Freitag B, Berwin B, Nanassy O, Barklis E. Characterization of the Moloney murine leukemia virus stem cell-specific repressor binding site. Virology. 1993;193:690–699. doi: 10.1006/viro.1993.1177. [DOI] [PubMed] [Google Scholar]
- Krausslich H, Facke M, Heuser A, Konvalinka J, Zentgraf H. The spacer peptide between human immunodeficiency virus capsid and nucleocapsid proteins is essential for ordered assembly and viral infectivity. J Virol. 1995;69:3407–19. doi: 10.1128/jvi.69.6.3407-3419.1995. [DOI] [PMC free article] [PubMed] [Google Scholar]
- Li F, Goila-Gaur R, Salzwedel K, Kilgore N, Reddick M, Matallana C, Castillo A, Zoumplis D, Martin D, Orenstein J, Allaway G, Freed E, Wild C. PA-457: a potent HIV inhibitor that disrupts core condensation by targeting a late step in Gag processing. Proc Natl Acad Sci USA. 2003;100:13555–13560. doi: 10.1073/pnas.2234683100. [DOI] [PMC free article] [PubMed] [Google Scholar]
- Li F, Zoumplis D, Matallana C, Kilgore N, Reddick M, Yunis A, Adamson C, Salzwedel K, Martin D, Allaway G, Freed E, Wild C. Determinants of activity of the HIV-1 maturation inhibitor PA457. Virology. 2006;356:217–224. doi: 10.1016/j.virol.2006.07.023. [DOI] [PubMed] [Google Scholar]
- McDermott J, Karanjia S, Love Z, Barklis E. Crosslink analysis of N-terminal, C-terminal, and N/B determining regions of the Moloney murine leukemia virus capsid protein. Virology. 2000;269:190–200. doi: 10.1006/viro.2000.0212. [DOI] [PubMed] [Google Scholar]
- Reik W, Weiher H, Jaenisch R. Replication-competent Moloney murine leukemia virus carrying a bacterial suppressor tRNA gene: selective cloning of proviral and flanking host sequences. Proc Natl Acad Sci USA. 1985;82:1141–1145. doi: 10.1073/pnas.82.4.1141. [DOI] [PMC free article] [PubMed] [Google Scholar]
- Sakalian M, McMurtey C, Deeg F, Maloy C, Li F, Wild C, Salzwedel K. 3-O(3′,3′-dimethylsuccinyl) betulinic acid inhibits maturation of the human immunodeficiency virus type 1 Gag precursor assembled in vitro. J Virol. 2006;80:5716–5722. doi: 10.1128/JVI.02743-05. [DOI] [PMC free article] [PubMed] [Google Scholar]
- Scholz I, Arvidson B, Huseby D, Barklis E. Virus particle core defects caused by mutations in the human immunodeficiency virus capsid N-terminal domain. J Virol. 2005;79:1470–1479. doi: 10.1128/JVI.79.3.1470-1479.2005. [DOI] [PMC free article] [PubMed] [Google Scholar]
- Scholz I, Still A, Dhenub T, Coday K, Webb M, Barklis E. Analysis of human immunodeficiency virus matrix domain replacements. Virology. 2008;371:322–335. doi: 10.1016/j.virol.2007.10.010. [DOI] [PMC free article] [PubMed] [Google Scholar]
- Swanstrom R, Wills J. Synthesis, assembly and processing of viral proteins. In: Coffin J, Hughes S, Varmus H, editors. Retroviruses. Cold Spring Harbor Laboratory Press; NY: 1997. pp. 263–334. [PubMed] [Google Scholar]
- Wang C, Barklis E. Human immunodeficiency virus gag protein mutants defective in assembly, processing, and infectivity. J Virol. 1993;67:4264–4273. doi: 10.1128/jvi.67.7.4264-4273.1993. [DOI] [PMC free article] [PubMed] [Google Scholar]
- Wang C, Stegeman-Olsen J, Zhang Y, Barklis E. Assembly of HIV Gag-B-Galactosidase fusion proteins into virus particles. Virology. 1994;200:524–534. doi: 10.1006/viro.1994.1215. [DOI] [PubMed] [Google Scholar]
- Wright E, Schooler J, Ding HJ, Kieffer C, Fillmore C, Sundquist W, Jensen G. Electron cryotomography of immature HIV-1 virions reveals the structure of the CA and SP1 Gag shells. EMBO J. 2007;26:2218–2226. doi: 10.1038/sj.emboj.7601664. [DOI] [PMC free article] [PubMed] [Google Scholar]
- Zhang Y, Qian H, Love Z, Barklis E. Analysis of the assembly function of the HIV-1 nucleocapsid protein. J Virol. 1998;72:1782–1789. doi: 10.1128/jvi.72.3.1782-1789.1998. [DOI] [PMC free article] [PubMed] [Google Scholar]
- Zhou J, Chen CH, Aiken C. The sequence of the CA-SP1 junction accounts for the differential sensitivity of HIV-1 and SIV to the small molecule maturation inhibitor 3-O-(3′3′-dimethylsuccinyl)-betulinic acid. Retrovirology. 2004a;1:15. doi: 10.1186/1742-4690-1-15. [DOI] [PMC free article] [PubMed] [Google Scholar]
- Zhou J, Yuan X, Dismuke D, Forshey B, Lundquist C, Lee K, Aiken C, Chen C. Small-molecule inhibition of human immunodeficiency virus type 1 replication by specific targeting of the final step of virion maturation. J Virol. 2004b;78:922–929. doi: 10.1128/JVI.78.2.922-929.2004. [DOI] [PMC free article] [PubMed] [Google Scholar]
- Zhou J, Huang L, Hachey D, Chen CH, Aiken C. Inhibition of HIV-1 maturation via drug association with the viral Gag protein in immature HIV-1 particles. J Biol Chem. 2005;280:42149–42155. doi: 10.1074/jbc.M508951200. [DOI] [PubMed] [Google Scholar]