Abstract
For broad applications in biomedical research involving functional dynamics and clinical studies, a photoacoustic microscopy system should be compact, stable, and fast. In this work, we use a fiber laser as the photoacoustic irradiation source to meet these goals. The laser system measures 45×56×13 cm3. The stability of the laser is attributed to the intrinsic optical fiber-based light amplification and output coupling. Its 50-kHz pulse repetition rate enables fast scanning or extensive signal averaging. At the laser wavelength of 1064 nm, the photoacoustic microscope still has enough sensitivity to image small blood vessels while providing high optical absorption contrast between melanin and hemoglobin. Label-free melanoma cells in flowing bovine blood are imaged in vitro, yielding measurements of both cell size and flow speed.
Keywords: photoacoustic microscopy, fiber laser, high pulse repetition rate, vasculature imaging, circulating melanoma cells imaging, cell size, cell flow speed
Introduction
Optical-resolution photoacoustic (PA) microscopy (OR-PAM) is emerging as a noninvasive volumetric imaging technology with optical absorption contrast and micrometer resolution.1 Briefly speaking, it detects the ultrasound wave generated by thermoelastic expansion of tissue that has absorbed light from an optically focused laser pulse. Because OR-PAM directly measures local energy deposition, different light absorption properties of chromophores can be exploited for structural and functional imaging. To date, OR-PAM has been used for cell imaging,2 microhemodynamic monitoring,3 and particle flow imaging.4
OR-PAM must have a high imaging speed when applied in dynamic functional imaging. The imaging speed of OR-PAM is limited by the scanning mechanism and pulse repetition rate (PRR) of the laser. In this study, a fiber laser with a PRR of 50 kHz was used, whereas the PRR of our previous system is up to 2 kHz.4 It enables high-speed M-mode PA imaging and potentially high-speed B-scan PA imaging by using optical scanning.5 Moreover, a high PRR can improve the contrast-to-noise ratio (CNR) when weak contrast is imaged, such as in high-sensitivity PA molecular imaging,6 because it allows extensive signal averaging.
The fiber laser is compact, stable, and fiber-coupled. The laser system measures only 45×56×13 cm3. The laser pulses exhibit high amplitude stability. The output single-mode optical fiber is directly connected to the focusing component of the OR-PAM system, making the imaging system maintenance-free. Thus, our fiber-laser-based OR-PAM is anticipated to facilitate the application of OR-PAM in both preclinical and clinical studies.
Melanoma is the most lethal form of skin cancer, the metastasis of which accounts for a large majority of skin cancer deaths. Early detection of metastatic melanoma cells can improve prognosis and treatment planning.7 Melanin, a broadband optical absorber, is highly expressed in melanoma cells. By contrast, hemoglobin has lower absorption at near-infrared (NIR) wavelengths than at green wavelengths.8 Therefore, we can apply NIR fiber-laser-based OR-PAM to detect circulating melanoma cells against the blood background signals. Previously, PA flow cytometry was developed for label-free sensing of circulating metastatic melanoma cells.9, 10, 11 In this method, the entire cross section of the vessel is illuminated with a line beam. Hence, the detection covers a volume much greater than a single cell, resulting in low sensitivity. Fiber-laser-based OR-PAM has a laser focal zone whose diameter is comparable to that of a cell. By scanning across the vessel, it can image a single passing melanoma cell with higher contrast. Because the concentration of expressed melanin in melanoma cells varies, a higher contrast improves detection sensitivity.
Methods and Materials
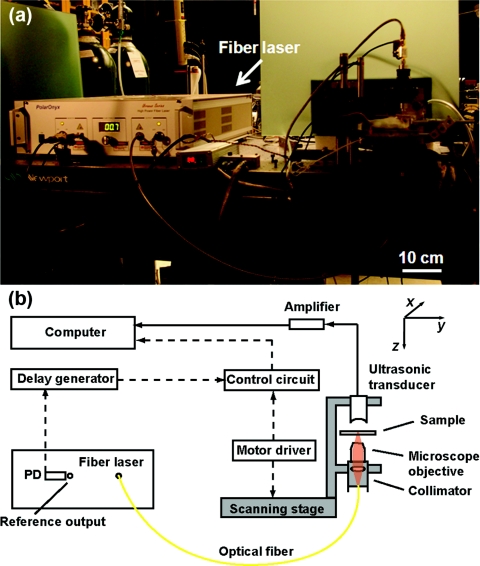
Figure 1a is a photograph of the fiber-laser-based OR-PAM system, and Fig. 1b is a detailed schematic. The irradiation source was a fiber laser (Uranus Series, PolarOnyx, San Jose, California) with a wavelength of 1064 nm. The laser pulses had a 10-ns pulse width and a repetition rate of 50 kHz. The compact fiber laser delivered light to the optical focusing component of the OR-PAM system through a single-mode fiber. The laser pulse was first collimated and then focused by a microscope objective (4×, NA 0.1, Leica, Wetslar, Germany). A spherically focused 40-MHz custom-made ultrasonic transducer (bandwidth, 40 MHz, NA 0.5, focal length 4.4 mm) was coaxially and confocally aligned with the objective in transmission mode. The PA signals from the transducer were amplified and then digitized by a data acquisition card (PCI 5152, National Instruments, Austin, Texas). A photodiode (S5973, Hamamatsu, Bridgewater, New Jersey) generated the triggering signal for data acquisition.
Figure 1.
(a) Photograph of the fiber-laser-based PA microscopy system. (b) Schematic of the system. PD: photodiode. Arrowhead solid lines show PA signal data flow. Arrowhead dashed lines show control signal data flow.
The lateral resolution was measured by imaging the edge spread function. Alcohol-based ink painted on a glass slide cracked when it dried. The crack edge was imaged, and the measured edge spread function was nonlinearly fitted by an error function. Its derivative yielded a Gaussian-shape line spread function, whose full width at half maximum (FWHM)—defining the lateral resolution—was estimated to be 15 μm. This resolution was comparable to the size of a melanoma cell; hence, it was optimal for melanoma detection. The axial resolution, as determined by the bandwidth of the 40-MHz center-frequency transducer, was estimated to be ∼37 μm.1
A nude mouse (Harlan Laboratories, Indianapolis, Indiana, body weight ∼20 g) was imaged to demonstrate the potential of the fiber-laser-based OR-PAM system for cutaneous microcirculation study. During experiments, the animal was placed on a thermostatic mechanical stage, with its ear on a glass slide. A breathing anesthesia system (E-Z Anesthesia, Euthanex, Erlangen, Germany) ventilated a gas mixture of 1% isoflurane and medical-grade oxygen to the mouse to keep the animal motionless. All experimental animal procedures were carried out in conformity with the laboratory protocol approved by the Animal Studies Committee of the School of Medicine at Washington University in Saint Louis.
B16 melanoma cells were obtained from the Tissue Culture and Support Center at Washington University School of Medicine, Saint Louis, Missouri. Cells were maintained in Dulbecco's modified Eagle medium (Invitrogen, Carlsbad, California) supplemented with 10% fetal bovine serum (ATCC, Manassas, Virginia) and 1% penicillin-streptomycin (Invitrogen), and passed weekly. All cultures were kept in an incubator at 37 °C in a humidified atmosphere containing 5% CO2, and the media were changed every other day. Before experiments, cells were dissociated with 0.25% trypsin-EDTA (Invitrogen). The cell density was determined by manual counting using a hemocytometer.
A cell suspension with a concentration of 4×10⁶/ml was dropped on a microscope glass slide and imaged by both optical microscope and OR-PAM to study the melanoma cell size and melanin concentration. To simulate circulating melanoma cells in the blood stream, melanoma cells were suspended in defibrinated bovine blood (910, Quad Five, Rygate, Montana) with a concentration of 4×10⁶/ml. The blood flow was generated by a syringe pump (BSP-99M, Braintree Scientific, Braintree, Massachusetts) with a 5-ml syringe (Luer-Lok, BD, Franklin Lakes, New Jersey). Tygon tubes (S-54-HL, Saint-Gobain Performance Plastics, Wayne, New Jersey) were epoxy glued to both ends of a glass micropipette tube (Microcaps, Drummond Scientific, Broomall, Pennsylvania) and used as the flow vessel. The glass microtube, with a 0.56-mm inside diameter and 0.80-mm outside diameter had low optical absorption at the irradiation wavelength of 1064 nm. The volume flow rate of blood was set to 1.8 ml/h, corresponding to a blood flow speed of 2.1 mm/s in the microtube, within the range of that in a mouse ear blood vessel (1–10 mm/s).9
With a sampling rate of 200 MHz, the raw PA A-line signal was acquired with 200 sample points. The Hilbert transformation was applied to each A-line signal to extract its profile. All profiles were then put together as a B-scan image, M-mode image, or volumetric image, according to the scanning strategy.
Results
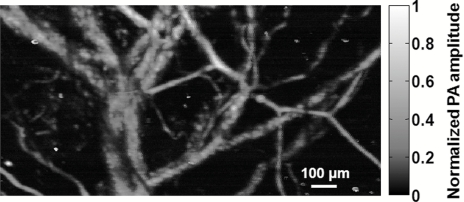
PA imaging of vasculature with a 2-kHz-PRR dye laser at a wavelength of 578 nm was previously demonstrated .1 The blood absorption coefficient at 1064 nm is ⩽5 cm−1, ∼50 times lower than that at 578 nm.8 Nevertheless, the NIR fiber-laser-based OR-PAM is still capable of imaging microvasculature. To illustrate this capability, the vasculature in a nude mouse ear was imaged in vivo. The acquired data were averaged over 50 laser shots. The CNR of the image reached 40 dB, as shown in Fig. 2. With the high PRR, the data acquisition time remained the same as that with the dye-laser-based OR-PAM. The laser pulse energy was tuned to 0.92 μJ here. The peak fluence was ∼ 500 mJ/cm2 at the optical focus, which is equal to that of the dye-laser-based OR-PAM.1 However, due to absence of highly absorptive chromophores at 1064 nm, we expected no cell damage at this exposure, as well as a greater penetration depth in tissue. The vasculature image can be used to guide the laser beam on the blood vessel prior to melanoma cell detection.
Figure 2.
Image of nude mouse ear vasculature acquired in vivo with the fiber-laser-based PA microscope.
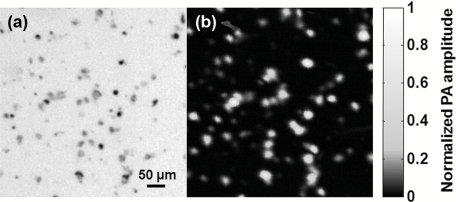
The NIR fiber-laser-based OR-PAM was designed primarily for melanoma cell detection. We first imaged melanoma cells on conventional microscope slides to measure their sizes and melanin concentrations. As shown in the transmission microscopic image [Fig. 3a], melanoma cell sizes range widely, from 10 to 30 μm. The PA image [Fig. 3b] clearly maps the melanoma cells’ distribution. The concentration of melanin expressed in a single melanoma cell was estimated by the amplitude of the PA signal. On the basis of the PA signal amplitudes, the melanin concentration can vary ten-fold among melanoma cells. Thus, a high CNR is necessary to improve the detection sensitivity for circulating melanoma cells.
Figure 3.
(a) Transmission optical microscopic image of B16 melanoma cells on a microscope slide. (b) Image of the melanoma cells acquired with the fiber-laser-based PA microscope. The two images were acquired within the same region.
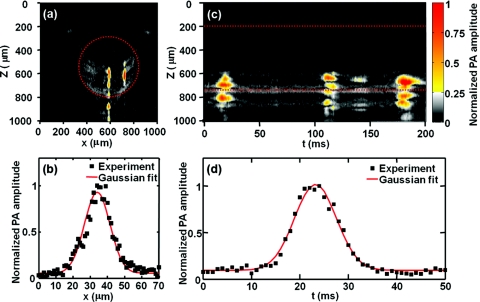
To model circulating melanoma cells, the cells were suspended in bovine blood with a concentration of 4×10⁶/ml. The laser focal zone transversely scanned across the glass microtube, and time-domain PA signals were recorded, thus forming cross-sectional (B-scan) images. Because at 1064 nm melanin absorbs light much more strongly than hemoglobin, two melanoma cells are clearly observed to pass through the cross section in Fig. 4a. The mean ratio of the PA amplitudes arising from the melanoma cells and the blood background is 4:1. The vertical (z) axis represents the depth information, and the horizontal (x) axis represents the focal zone position. The signals located below the tube were acoustic reflections due to the high acoustic impedance mismatch of the solid glass tube and fluid blood.
Figure 4.
PA detection of label-free melanoma cells in flowing bovine blood in vitro. (a) B-scan PA image showing two melanoma cells clearly at x = 588 and 720 μm. (b) PA amplitude profile from the melanoma cell at x = 588 μm shown in (a) and its Gaussian fit. (c) M-mode PA image tracking three melanoma cells acquired through the center of the glass microtube. (d) PA amplitude profile from the cell around t = 19 ms in (c) and its Gaussian fit. Dashed lines in (a) and (c) mark the boundary of the glass tube.
Figure 4b plots the PA signal amplitude at depth z = 700 μm across the melanoma cell passing at the center of the glass microtube in Fig. 4a. The profile of the PA amplitude was determined by laser intensity distribution and the melanoma cell geometry. The profile was Gaussian fitted with a FWHM of 19 μm. We assume that both the laser focal zone and the cell geometry have Gaussian shapes. Then, the width of the PA amplitude Gaussian profile w can be expressed as
where w1 is the diameter of the laser focal zone and w2 is the melanoma cell size. Given that the resolution of the OR-PAM system was 15 μm, the cell size was estimated to be 12 μm. As control experiments, both pure water and bovine blood were imaged independently. No appreciable PA signal was detected from water, and only relatively smooth PA signals (maximum amplitude variation between +48 and –46%) were observed in the blood.
By irradiating each flowing melanoma cell, we could detect a single passing cell or count the number of melanoma cells in peripheral blood and lymphatic vessels. The NIR fiber-laser-based OR-PAM has the potential to monitor melanoma metastasis by measuring melanoma cell deposition within tissue. Currently, the imaging speed of the system is limited by mechanical scanning. Laser-scanning OR-PAM was recently developed to increase the data acquisition speed.5 Laser scanning can enable fast B-scan imaging of a flowing single melanoma cell at a frame rate of kilohertz (50 A-lines∕frame). Each B-scan image slice can measure the size of the cell passing through the cross section, and the cell flow trace along the vessel can provide the flow speed information.
Figure 4c demonstrates M-mode OR-PAM imaging of cell flow.4 The laser illuminated a fixed point inside the glass microtube. When a melanoma cell flowed through the laser focal zone, a sequence of PA A-line signals was generated. They were then arranged together in the time domain so that a trace of the melanoma cell appeared. The profile of PA signal amplitude at depth z = 700 μm across the first flow trace was plotted in Fig 4d. The melanoma cell flow speed v was estimated as v = w/t, where t is the FWHM duration of the trace and w is the imaged cell size measured across the vessel. For the first melanoma cell (t = 19 ms), the width of the PA flow trace t was 11 ms. Because w1 = 15 μm and w2 = 10 to 30 μm, w = 18–34 μm. Consequently, the flow speed v was estimated to be 1.6–3.1 mm/s, which matched the preset flow speed of 2.1 mm/s. To precisely measure the cell flow speed, simultaneous measurement of cell size was required.
Conclusion
In summary, we develop a fiber-laser-based OR-PAM system. A high CNR can be achieved by extensive signal averaging when weak optical absorption is imaged. The NIR fiber-laser-based OR-PAM is demonstrated to be sensitive for monitoring single circulating melanoma cells. Moreover, by applying optical scanning to fiber-laser-based OR-PAM, the imaging speed can potentially be significantly increased. We believe that the compact fiber-laser-based OR-PAM will accelerate the application of OR-PAM in both preclinical and clinical studies.
Acknowledgments
This work was supported in part by National Institutes of Health Grants Nos. R01 EB000712, R01 EB008085, R01 CA113453901, U54 CA136398, 5P60 DK02057933, and R43 RR025928. Wang has a financial interest in Microphotoacoustics, Incorporated, and Endra, Incorporated, which, however, did not support this work. The authors are grateful to Christopher Favazza for beneficial discussions. They also thank Jim Ballard for careful proofreading.
References
- Maslov K., Zhang H. F., Hu S., and Wang L. V., “Optical-resolution photoacoustic microscopy for in vivo imaging of single capillaries,” Opt. Lett. 33, 929–931 (2008). 10.1364/OL.33.000929 [DOI] [PubMed] [Google Scholar]
- Zhang C., Maslov K., and Wang L. V., “Subwavelength-resolution label-free photoacoustic microscopy of optical absorption in vivo,” Opt. Lett. 35, 3195–3197 (2010). 10.1364/OL.35.003195 [DOI] [PMC free article] [PubMed] [Google Scholar]
- Hu S., Maslov K., and Wang L. V., “Noninvasive label-free imaging of microhemodynamics by optical-resolution photoacoustic microscopy,” Opt. Express 17, 7688–7693 (2009). 10.1364/OE.17.007688 [DOI] [PMC free article] [PubMed] [Google Scholar]
- Fang H. and Wang L. V., “M-mode photoacoustic particle flow imaging,” Opt. Lett. 34, 671–673 (2009). 10.1364/OL.34.000671 [DOI] [PMC free article] [PubMed] [Google Scholar]
- Xie Z., Jiao S., Zhang H. F., and Puliafito C. A., “Laser-scanning optical-resolution photoacoustic microscopy,” Opt. Lett. 34, 1771–1773 (2009). 10.1364/OL.34.001771 [DOI] [PubMed] [Google Scholar]
- Li M., Oh J., Xie X., Ku G., Wang W., Li C., Lungu G., Stoica G., and Wang L. V., “Simultaneous molecular and hypoxia imaging of brain tumors in vivo using spectroscopic photoacoustic tomography,” Proc. IEEE 96, 481–489 (2008). [Google Scholar]
- Jerant A. F., Johnson J. T., Sheridan C., and Caffrey T. J., “Early detection and treatment of skin cancer,” Am. Family Phys. 62, 357–386 (2000). [PubMed] [Google Scholar]
- Zijlstra W. G., Buursma A. and van Assendelft O. W., Visible and Near Infrared Absorption Spectra of Human and Animal Haemoglobin Determination and Application: Determination and Application, VSP, Utrecht, The Netherlands: (2000). [Google Scholar]
- Galanzha E. I., Shashkov E. V., Spring P. M., Suen J. Y., and Zharov V. P., “In vivo, noninvasive, label-free detection and eradication of circulating metastatic melanoma cells using two-color photoacoustic flow cytometry with a diode laser,” Cancer Res. 69, 7926–7934 (2009). 10.1158/0008-5472.CAN-08-4900 [DOI] [PMC free article] [PubMed] [Google Scholar]
- Weight R., Viator J., Dale P., Caldwell C., and Lisle A., “Photoacoustic detection of metastatic melanoma cells in the human circulatory system,” Opt. Lett. 31, 2998–3000 (2006). 10.1364/OL.31.002998 [DOI] [PubMed] [Google Scholar]
- Nedosekin D., Sarimollaoglu M., Shashkov E., Galanzha E., and Zharov V., “Ultra-fast photoacoustic flow cytometry with a 0.5 MHz pulse repetition rate nanosecond laser,” Opt. Express 18, 8605–8620 (2010). 10.1364/OE.18.008605 [DOI] [PMC free article] [PubMed] [Google Scholar]


