

Abstract
Choline kinase α (CK-α) is one of two mammalian enzymes that catalyze the phosphorylation of choline to phosphocholine in the biosynthesis of the major membrane phospholipid, phosphatidylcholine. We created mice lacking CK-α with an embryonic stem cell line containing an insertional mutation in the gene for CK-α (Chka). Embryos homozygous for the mutant Chka allele were recovered at the blastocyst stage, but not at embryonic day 7.5, indicating that CK-α is crucial for the early development of mouse embryos. Heterozygous mutant mice (Chka+/−) appeared entirely normal in their embryonic development and gross anatomy, and they were fertile. Although choline kinase activity was decreased by ~30%, the amount of phosphatidylcholine in cells and the levels of other enzymes involved in phosphatidylcholine biosynthesis were unaffected. Phosphatidylcholine biosynthesis measured by choline incorporation into hepatocytes was also not compromised in Chka+/− mice. Enhanced levels of choline and attenuated levels of phosphocholine were observed in both the livers and testes of Chka+/− mice. Triacylglycerol and cholesterol ester were elevated ~2-fold in the livers, whereas neutral lipid profiles in plasma were similar in Chka+/− and wild-type (Chka+/+) mice. Thus, Chka is an essential gene for early embryonic development, but adult mice do not require full expression of the gene for normal levels of phosphatidylcholine.
Phosphatidylcholine (PC)3 is the primary phospholipid of eukaryotic cellular membranes and has a crucial role in structural maintenance of the lipid bilayer. In all mammalian tissues, PC is made via the Kennedy pathway (CDP-choline pathway), and the activity of CTP:phosphocholine cytidylyltransferase (CT) usually regulates flux through this pathway (1). In addition, phosphatidylethanolamine N-methyltransferase (PEMT) catalyzes the conversion of phosphatidylethanolamine (PE) to PC and is a liver-specific alternative route for PC synthesis. Choline kinase (CK) catalyzes the first phosphorylation reaction in the CDP-choline pathway. Besides having an active role in PC biosynthesis, the activation of CK and the resulting increase in phosphocholine levels are both proposed as necessary events for fibroblasts to proliferate during stimulation by certain growth factors (e.g. platelet-derived growth factor, basic fibroblast growth factor) (2). The induction of CK gene expression is also associated with certain cell stress and cell defense (3, 4).
CK has two isoforms, CK-α and CK-β, which are encoded by separate genes, Chka and Chkb, respectively (3). CK-α and CK-β have different tissue distribution that suggests a different function for each isoform. Recently Sher et al. (5) showed that disruption of Chkb in mice can cause severe muscular dystrophy in limbs. To provide insights into the role of CK-α in mice, we generated Chka-deficient mice. Whereas the heterozygous Chkα knock-out mice (Chka+/−) were phenotypically indistinguishable from wild-type mice, early embryonic lethality was observed in homozygous Chkα knock-out embryos.
EXPERIMENTAL PROCEDURES
Choline Kinase α Knock-out Mice
A mouse embryonic stem cell line (XH252, strain 129/OlaHsd) with an insertional mutation in Chka was created in a gene-trapping program, Bay-Genomics (baygenomics.ucsf.edu/). The gene-trapping vector, pGT1Lxf, was designed to create an in-frame fusion between the 5′ exons of the trapped gene and a reporter, βgeo (a fusion of β-galactosidase and neomycin phosphotransferase II). Chka spans 12 exons on mouse chromosome 19. The insertional mutation in XH252 occurred in intron 5. Thus, the gene-trapped locus is predicted to yield a fusion transcript containing exons 1–5 of Chka and βgeo. The embryonic stem cells were injected into C57BL/6 blastocysts to create chimeric mice, which were bred with C57BL/6 mice to generate heterozygous (+/−) Chka-deficient mice. All mice had a mixed genetic background (~50% C57BL/6 and ~50% 129/OlaHsd). The mice were weaned at 21 days of age, housed in a barrier facility with a 12-h light-dark cycle, and fed chow containing 4.5% fat (Ralston Purina, St. Louis, MO).
Genotyping
Chka genotypes were assessed by PCR analysis of genomic DNA extracted from mouse tails or embryos. Mouse tail genomic DNA was extracted by DNeasy tissue kit (Qiagen). Chka+/− mice were mated and monitored daily for plugs. Females with copulation plugs were considered to be at day 0.5 of gestation. Pregnant females were sacrificed at different times of gestation. The uterine horns were flushed with HEPES-buffered M2 culture medium, and embryos were transferred into individual Eppendorf tubes containing 5 μl of lysis buffer (0.05% SDS and 0.035 N NaOH). The samples were boiled for 3 min, and 2.5 μl of this mixture was used for PCR. A common forward primer: 5′-GATTGGACACTGAAGAGTTACG-3′ (exon 4) and two reverse primers 5′-GAGGATCTTGTGCAGTTGCTGA-3′ (exon 5) and 5′-GGGTCACAAGGTTCATATGGT-3′ (vector), as illustrated in Fig. 1A, were used to detect wild-type and mutant alleles, respectively. The amplified DNA fragments were separated by agarose gel electrophoresis.
FIGURE 1. CK-α protein is decreased, but CK-β protein is unchanged in Chka+/− mice.

A, detection of wild-type and mutant alleles. SA, splice acceptor; pA, polyadenylation signal; black arrows, primer for genotyping. B, homogenates were prepared from livers and testes of Chka+/− and Chka+/+ mice, followed by the immunoblot of CK-α and CK-β. The results are representative of three independent experiments. PDI, protein disulfide isomerase.
Quantitative Real-time PCR
Liver or testis (50–100 mg) was homogenized with a Polytron in TRIzol Reagent (Invitrogen) for 3 × 10 s on ice, and total RNA was extracted according to the manufacturer’s instructions. RNA quality was confirmed on a 1.5% formaldehyde-agarose gel by measurement of the 28 S/18 S ribosomal RNA ratio. Total RNA (2 μg) was reverse-transcribed in a 20-μl volume containing oligo(dT)12–18 primer (Invitrogen), and Superscript II enzyme (Invitrogen) according to the manufacturer’s instructions. Primers used for the reference gene, cyclophilin, were 5′-TCCAAAGACAGCAGAAAACTTTCG-3′ and 5′-TCTTCTTGCTGGTCTTGCCATTCC-3′. For CK-α, the 5′ and 3′-primers were 5′-GCCGACTGGAGCAGTTTATC-3′ and 5′-GCTCAAGAGGCAGGTTGTAA-3′. For CK-β, the 5′ and 3′ primers were 5′-CGGAGGAGCTGAGCGTTTG-3′ and 5′-TCTGCGAGAATGGCGAACATC-3′. The 25-μl PCR contained 100 ng of cDNA, 10 μl of Platinum Sybr Green qPCR Supermix UDG (Invitrogen), 1.6 μM cyclophilin primers, and 3.0 μM CK-α or CK-β primers. Real-time PCR was performed with a Rotor-Gene RG-3000 thermocycler (Corbett Research, Mortlake, NSW, Australia) with samples from three separate mice, and each sample was analyzed in triplicate. Data were normalized to the reference gene with the Pfaffl method (6).
Sample Collection
Livers, testes, and skeletal muscle from forelimb and hindlimb were frozen in liquid N2 after dissection. Blood was collected by cardiac puncture with instruments pre-treated with EDTA. Plasma was separated by centrifugation at 2000 × g for 20 min in a refrigerated benchtop centrifuge. All samples were stored at −70 °C before use.
Lipid Analysis
Tissues were homogenized with a Polytron in 5 volumes of 10 mM Tris-HCl (pH 7.2), 150 mM NaCl, 1 mM EDTA, 1 mM dithiothreitol, 1 mM phenylmethylsulfonyl fluoride, 1:100 protease/inhibitor mixture (Sigma, P8340). Homogenates were centrifuged for 5 min at 600 × g and supernatant fluids collected. Protein was quantified (7) and total lipids were extracted from tissue homogenates and plasma (8). Phospholipids were separated by high-performance liquid chromatography and quantified with an electron-light scattering detector (9). Phosphatidyldimethylethanolamine was used as an internal standard for quantification. Neutral lipids, including triacylglycerols, cholesterol, and cholesteryl esters, were measured by gas-liquid chromatography (10).
Choline Kinase Activity Assay
Tissue homogenates were centrifuged (348,000 × g for 15 min) at 4 °C and supernatant fractions (cytosol) prepared. CK activity was determined as described elsewhere with minor modifications (11). The supernatant fractions were incubated in a final volume of 100 μl of reaction buffer that contained 0.1 M Tris-HCl (pH 8.75), 10 mM ATP-2Na, 15 mM MgCl2, and 0.25 mM [3H]choline chloride (10.5 μCi/ml) at 37 °C for 30 min. The reaction product, phosphocholine, was separated using an AG1-X8 (200 – 400 mesh, OH− form) column (Bio-Rad). To determine the activity of each CK isoform, supernatant fractions were treated with an antisera raised against GST (control), GST-CK-α, or GST-CK-β fusion proteins combined with protein A-Sepharose overnight at 4 °C, and the supernatant was used for CK assays (5).
Immunoblotting Analysis of CK-α and CK-β
Proteins (50 μg) from liver and testis homogenates were separated by electrophoresis on 12% polyacrylamide gels containing 0.1% SDS and immunoblotted with anti-CK-α antibodies (Abcam) or anti-CK-β antibodies (a gift from Dr. K. Ishidate, Tokyo Medical and Dental University, Japan). Protein disulfide isomerase was used as a loading control.
Other Enzyme Assays
For measurement of CT activity, microsomes and cytosol fractions were prepared from homogenates of liver or testis. The assay was performed as previously described by monitoring the conversion of [3H]phosphocholine into CDP-choline. For measurement of PEMT activity, aliquots (50 μg of protein) of liver homogenates were incubated with phosphatidylmonomethylethanolamine and S-adenosyl-[3H]methionine, and the incorporation of radio-label was measured (12).
Measurement of Choline and Phosphocholine
Total lipids were extracted from tissue homogenates as described above. The aqueous phase was separated and dried under nitrogen gas. After resuspending with distilled water, the amount of choline in samples was determined using Wako Phospholipids B test kit. To measure the amount of phosphocholine plus choline, 2 units/ml of alkaline phosphatase was added before the assay (13). The amount of phosphocholine was calculated by subtracting the amount of choline from the amount of phosphocholine plus choline.
Metabolic Labeling
Primary hepatocytes were isolated as previously described (14). Two h after plating, the cells were washed three times with Dulbecco’s modified Eagle’s medium, and hepatocytes were pulsed for 30 min with 15 μCi of [methyl-3H]choline and subsequently incubated for up to 4 h in an equivalent unlabeled medium. At the end of the chase period, the cells were harvested and the radioactivity quantified in the various choline metabolites after thin-layer chromatography.
Preparation of Mouse Embryonic Fibroblasts (MEFs)
MEFs from Dgat−/− mice were kindly supplied by Dr. Robert V. Farese, Jr., and were cultured in Dulbecco’s modified Eagle’s medium supplemented with 10% fetal bovine serum (15).
Data Analysis
Data are represented as mean ± S.D. The Student’s t test was used to compare the mean values between two groups.
RESULTS
Disruption of Chka Causes Early Embryonic Lethality
The heterozygous mice grow to normal size, are fertile, and do not display any obvious phenotypic deficiencies. Genotype analysis of progeny from heterozygote (+/−) intercrosses revealed that, from 100 pups, 33 were wild-type (+/+), 67 were heterozygotes (+/−), and none was homozygous (−/−) for a Chka mutation. The observed ratio of wild-type to heterozygote is consistent with the predicted ratio of 1:2 based on mendelian distribution. There was no bias in gender, with 48 male and 52 female mice. This result suggests that the disruption of Chka results in embryonic lethality. To determine the time of embryonic lethality, embryos were collected from heterozygous intercrosses at different days of gestation. None of the E7.5 (E, embryonic day), E8.5, E9.5, and E10.5 embryos were Chka−/− (Table 1). At E3.5, Chka−/− embryos could be detected by PCR analysis. The results indicate that Chka−/− embryos died between E3.5 and E7.5 stages of development.
TABLE 1.
Genotypes of offspring from intercrosses of Chka+/− mice
| Age | Genotype |
Unknown | Total | ||
|---|---|---|---|---|---|
| +/+ | +/− | −/− | |||
| Four weeks | 33 | 67 | 0 | NAa | 100 |
| Male | 15 | 33 | 0 | NA | 48 |
| Female | 18 | 34 | 0 | NA | 52 |
| E10.5 | 2 | 8 | 0 | 3b | 13 |
| E9.5 | 3 | 6 | 0 | 9b | 18 |
| E8.5 | 3 | 17 | 0 | 6b | 26 |
| E7.5 | 1 | 1 | 0 | 3b | 5 |
| E3.5 | 1 | 2 | 2 | 10c | 15 |
NA, not applicable.
Resorptions.
Four were abnormal in appearance; six produced no PCR products.
Decreased Expression of CK-α mRNA and CK-α Protein in Chka+/− Mice
As expected, the CK-α mRNA level in Chka+/− mice decreased, but the CK-β mRNA level was stable (Fig. 2). The expression of CK-α protein was also decreased in both liver and testis from Chka+/− mice (Fig. 1B). The expression of CK-β protein, however, was unchanged.
FIGURE 2. Real-time PCR analysis of Chka and Chkb mRNA levels relative to cyclophilin mRNA in liver and testis.

Relative Chka mRNA expression in liver (A) and testis (B); relative Chkb mRNA expression in liver (C) and testis (D). a, p < 0.001. Data are mean ± S.D. from four mice of each genotype.
Choline Kinase Activity Decreases in Chka+/− Mice
When compared with Chka+/+ mice, Chka+/− mice have ~30% lower CK activity in both liver and testis (Fig. 3), where CK-α mRNA and protein predominate compared with CK-β (16). In contrast, CK activity (nmol/min per mg of protein) in skeletal muscle did not show any differences (0.139 ± 0.007 and 0.125 ± 0.017 in hindlimbs of Chka+/+ and Chka+/− mice, respectively; 0.141 ± 0.016 and 0.140 ± 0.007 in forelimbs from Chka+/+ and Chka+/− mice, respectively). The results are consistent with the finding that CK-β activity, not CK-α activity, contributes most CK activity in skeletal muscle (5).
FIGURE 3. Choline kinase activity in livers and testes in Chka+/+ and Chka+/− mice.

Frozen tissues were homogenized and CK activity was assayed from the supernatant after high-speed centrifugation. Panels A and B present total CK activity. Panels C and D present the activities of the two isoforms of CK. It is assumed that activity not precipitated by α-specific antiserum was due to β/β homodimers, activity not precipitated by β-specific antiserum was due to α/α homodimers, and the remaining activity was from α/β heterodimers (3). a, p < 0.001. Data are mean ± S.D. from four mice of each genotype.
Choline Accumulation and Decreased Phosphocholine in Chka+/− Mice
Because CK activity was decreased, we determined the pool size of choline and phosphocholine. As expected, a higher level of choline and lower level of phosphocholine was observed in both testis and liver from Chka+/− mice, compared with Chka+/+ mice (Fig. 4).
FIGURE 4. Concentrations of choline and phosphocholine in livers and testes from Chka+/+ and Chka+/− mice.
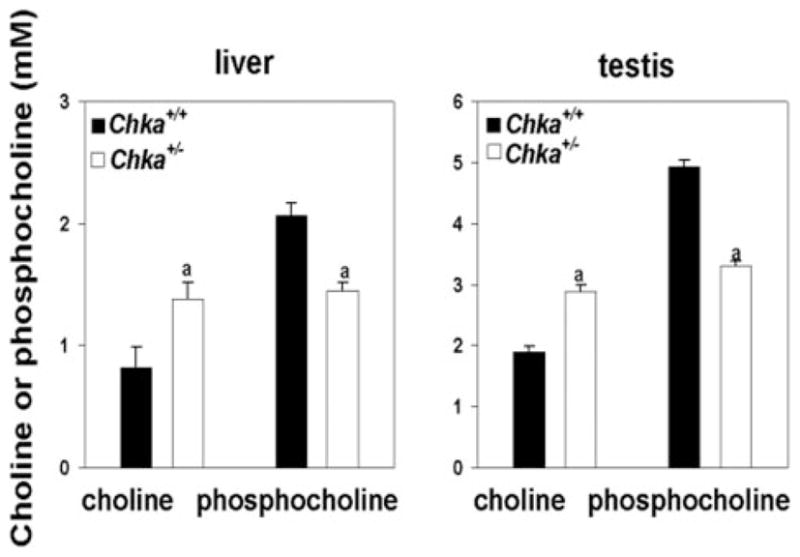
Total lipids were extracted from tissue homogenates (1 mg of protein) and the aqueous phase dried under nitrogen gas. After resuspending with distilled water, the level of choline in samples was determined using Wako Phospholipids B test kit. To measure the amount of phosphocholine plus choline, 2 units/ml of alkaline phosphatase was added before the assay. The amount of phosphocholine was calculated by subtracting the amount of choline from the amount of phosphocholine plus choline (13). a, p < 0.001. Data are mean ± S.D. from analyses of at least four mice of each genotype.
Phospholipid Analysis in Chka+/− Mice
Although the pool size of choline and phosphocholine changed, the amount of PC remained stable in Chka+/− mice (Fig. 5). PE, however, decreased, resulting in a higher PC/PE ratio (Fig. 5).
FIGURE 5. PC and PE concentrations in livers and testes from Chka+/− and Chka+/+ mice.

Lipids were extracted from homogenates (1 mg of protein) of livers (A) and testes (B), and the concentrations of PC and PE were determined by high-performance liquid chromatography. PC/PE ratio in liver (C) and testes (D) was calculated. a, p < 0.05. All data are mean ± S.D. from analyses of at least four mice of each genotype.
Stable CT and PEMT Activities in Chka+/− Mice
CT activity (in both microsomes and cytosol) was not influenced by the disruption of Chka, which is consistent with the finding of stable PC levels in the examined tissues. One explanation for the decreased PE level in liver is that PE might be converted into PC catalyzed by PEMT. However, the hepatic PEMT activity in Chka+/− mice was unchanged, compared with wild-type mice (Fig. 6).
FIGURE 6. CT and PEMT activity in livers and testes from Chka+/− and Chka+/+ mice.
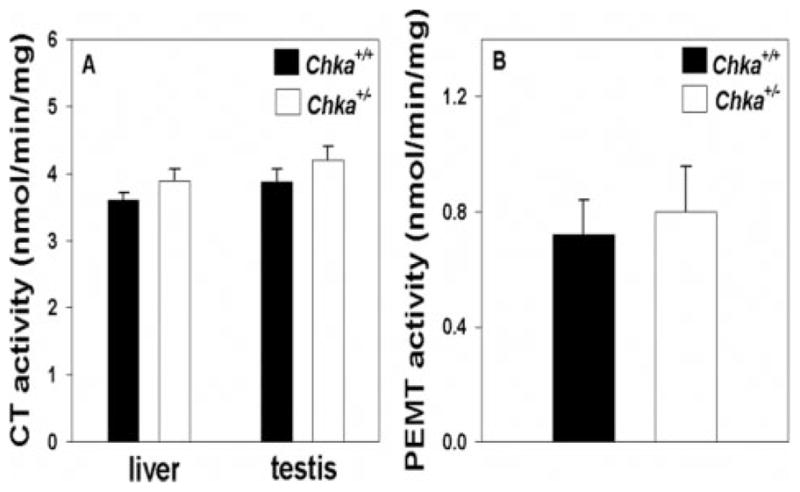
Tissue homogenates (1 mg of protein) were prepared from livers and testes of adult Chka+/− and Chka+/+ mice. CT activity (A) was measured in both livers and testes. PEMT activity (B) was measured only in liver. Data are mean ± S.D. from at least three mice of each genotype.
The Rate of Phosphatidylcholine Biosynthesis Is Unchanged in Chka+/− Mice
CK-α is predominant in liver and because there was no compensatory up-regulation of CK-β and PEMT activity in Chka+/− mice, we determined if the rate of PC synthesis might be hampered. Therefore, we isolated hepatocytes from Chka+/− and Chka+/+ mice and incubated them with [3H]choline to estimate the rate of PC biosynthesis in vivo. The incorporation of choline into PC was linear from 1 to 4 h and there was no statistical difference between the incorporation rates with hepatocytes of heterozygous and wild-type mice. The data did not reflect the approximate 30% difference in total CK activity in lysates noted above. The results were consistent with the lack of phenotypic distinction between heterozygous and wild-type animals. We also found that there was no difference in the metabolic labeling results between genders.
Normal Phosphatidylcholine Turnover Rate in Livers and Testes of Chka+/− Mice
A stable PC level in Chka+/− mice could also be because of a decreased turnover rate of PC. To clarify this we measured the activity of enzymes involved in PC turnover. No difference in enzyme activities was observed between Chka+/− and Chka+/+ mice for PC-specific phospholipase C, phospholipase A2, and phospholipase D in livers (1.51 units/mg, 0.98 nmol/min/mg, and 1.13 units/mg, respectively) and testes (1.16 units/mg, 0.67 nmol/min/mg, and 0.72 units/mg, respectively).
Neutral Lipid Measurements
Because CK activity was decreased in the liver (in which the CDP-choline pathway has been shown to produce ~70% of PC) (17–19), we also analyzed triacylglycerol, cholesterol, and cholesteryl ester content in plasma and liver as general measures of plasma lipid packaging and liver function. Significant differences were found between Chka+/− and Chka+/+ mice in levels of hepatic triacylglycerol (p = 0.03) and cholesteryl ester (p = 0.04) (Table 2). There were no significant differences between Chka+/− and Chka+/+ mice for plasma levels of triacylglycerol, cholesteryl ester, or cholesterol, or for hepatic levels of cholesterol (Table 2).
TABLE 2.
Neutral lipid profiles in liver and plasma
| Tissue | Genotype | Triacylglycerol | Cholesterol | Cholesteryl ester |
|---|---|---|---|---|
| μg/ml | ||||
| Plasma | Chka+/+ | 51.6 ± 8.9 | 141.5 ± 13.6 | 190.5 ± 42.5 |
| Chka+/− | 52.4 ± 8.7 | 151.9 ± 9.9 | 216.1 ± 21.5 | |
| μg/mg protein | ||||
| Liver | Chka+/+ | 5.03 ± 3.23 | 10.3 ± 1.3 | 1.13 ± 0.2 |
| Chka+/− | 12.4 ± 6.4a | 9.66 ± 1.03 | 1.92 ± 0.79a | |
Values are mean ± S.D., n = 3.
p < 0.05.
Contribution of CK-α and CK-β to Choline Kinase Activity in MEFs
To gain insight into the mechanism involved in the early embryonic lethality in Chka+/− mice, we analyzed choline kinase activity in MEFs. α/α and α/β homodimers and heterodimers contribute 80% of total CK activity in MEFs from wild-type mice, whereas the remaining 20% was provided by β/β homodimers. We have not successfully isolated MEFs from Chka+/+, Chka+/−, or Chka−/− embryos. However, the high expression of CKα in the MEFs suggests that early embryonic lethality is probably due to the lack of CK-α activity in Chka−/− embryos.
DISCUSSION
This is the first study to directly demonstrate the role of CK-α in vivo. The results from liver and testis of Chka+/− mice in the current study support the traditional picture that choline kinase is not usually the rate-limiting enzyme in the CDP-choline pathway for PC biosynthesis. However, the lethality of the homozygous Chka knock-out embryos indicates the indispensable role of CK-α in early embryogenesis. Although CK-α is essential for early embryonic development, adult tissues do not need full expression of CK-α to maintain a normal level of PC.
The inactivation of Chka is the fifth gene to be disrupted in PC biosynthesis in mice. The initial disruption was in the gene encoding PEMT (20) that revealed no significant phenotype unless the mice were fed a high-fat/high-cholesterol diet (12) or a choline-deficient diet (21). The expectation was that a knockout of the CT-α gene would be embryonic lethal at an early age and so cre/loxP recombination methodology was used to generate mice that had little or no CT-α in macrophages (22) or in liver (23). Subsequently, it was demonstrated in the laboratory of Jackowski (24) that disruption of the CTα gene was indeed lethal during embryonic development. Targeted deletion of the CTβ gene in mice was not embryonic lethal but the mice exhibited gonadal degeneration and reproductive deficiency (25). A natural mutation in the CK-β gene leading to complete inactivation of the gene was discovered in which the mice had neonatal bone deformities and hind limb muscular dystrophy (5). Two genes encode the last enzyme, CDP-choline:1,2-diacylglycerol cholinephosphotransferase, for PC biosynthesis via the CDP-choline pathway in humans (26). Whether two genes are present in mice and whether either gene is essential remain to be demonstrated.
CK has ethanolamine kinase activity at least in vitro but no defect in PE biosynthesis was detected in Chkb−/− mice (5). Recently, ethanolamine kinase 2 has been described, and that enzyme lacks CK activity (27). A knock-out of this gene in mice results in placental thrombosis with failed development in some embryos (27). In the current study, however, we found attenuated PE levels in Chka+/− mice that may suggest that CK-α has, to some extent, ethanolamine kinase activity in vivo. Recently, the gene encoding CTP:phosphoethanolamine cytidylyltransferase was disrupted, resulting in embryonic lethality (28). No other gene in the CDP-ethanolamine pathway has been disrupted to date. Similarly, the gene encoding phosphatidylserine decarboxylase, which generates PE from phosphatidylserine, has been disrupted and results in embryonic lethality (29).
Chka Is Essential for Early Development of Mouse Embryos
In the current experiments, we demonstrated that CK-α is essential for the early development of mouse embryos. Chka−/− embryos were recovered at the blastocyst stage, but not at E7.5, indicating that the loss of CK-α activity leads either to implantation failure or to embryonic death prior to implantation. A rapidly growing organism such as an embryo needs PC synthesis for cell membranes, and CK is actively involved in this process. The availability of choline is important to infants because organ growth, extremely rapid in the neonate, requires large amounts of PC biosynthesis (30–32). During development, there is a progressive decline in blood choline concentration (33). Plasma or serum choline concentrations are 7-fold higher in the fetus and neonate than in the adult (34). This decline in serum choline concentration occurs during the first weeks of life in the rat and the human (33). High levels of choline in the fetus presumably ensure enhanced availability of choline to tissues (30, 32, 35, 36). Thus, choline availability during embryogenesis and perinatal development of the rat and mouse may be especially important. In Chka+/− mice and Chka−/− embryos, there is no problem with choline availability but rather with the utilization of choline. Because Chka+/− mice did not show a significant phenotype compared with wild-type littermates, 100% normal CK activity is not needed to maintain PC-related functions in Chka+/− mice.
Why Does Embryonic Lethality Occur?
To understand the embryonic lethality in Chka+/− mice, we investigated the contribution of CK-α to total CK activity in MEFs. Because CK-α activity contributes to 80% of the total CK activity in MEFs, it is likely that CK-α activity has a crucial role for early embryonic development in mice. Our previous study demonstrated that CK-β knock-out mice did not die during embryonic development (5). Thus, the Chka inactivation is the main reason for early embryonic lethality. CK activation and an increased level of phosphocholine is closely associated with cell proliferation (2, 37). Because a decreased phosphocholine level was observed in Chka+/− mice, it is reasonable to expect limited phosphocholine production in Chka−/− embryos. Thus, it is possible that cell division and proliferation might be attenuated due to disrupted CK-α, and subsequent impaired PC biosynthesis and phosphocholine production in embryonic fibroblasts may be the reason for embryonic lethality.
Fisher et al. (38) found that perturbations in choline metabolism cause neural tube defects in mouse embryos in vitro. They treated embryos and yolk sacs with an inhibitor of choline uptake, 2-dimethylaminoethanol. In that study, they found decreased PE biosynthesis and decreased incorporation of choline into PC and phosphocholine. Moreover, PC could not be synthesized via PEMT even in the presence of the choline transport inhibitor (38), which indicates that the CDP-choline pathway is the only route for PC biosynthesis in mouse embryos. Thus, it is not surprising to find impaired PC biosynthesis in Chka−/− embryos. Our findings are consistent with the results of Fisher (38) that choline and PC are crucial for the normal development of mouse embryos, and now we demonstrate that CK-α is also an important player for embryogenesis.
What Is the Role of CK-α in Adult Mice?
Because we were unable to generate homozygous knock-out mice, we obtained some insight into the role of CK-α by comparing the differences between Chka+/+ and Chka+/− mice. As expected, we observed choline accumulation in Chka+/− mice, in both liver and testis. The accumulation of choline is supposed to limit the further uptake of choline from the circulation in the long term and influence PC biosynthesis (39). However, we did not observe a change in the amount of PC. Thus, it appears that the amount of phosphocholine is not limiting PC biosynthesis in Chka+/− mice. There was also no alteration in PC turnover in Chka+/− mice. Despite ~30% reduction in total CK activity in heterozygous liver lysates, the metabolic activity of the CDP-choline pathway in Chka+/− hepatocytes was the same as in wild-type hepatocytes. The lack of CK activity did not alter CT or PEMT activity. Surprisingly we did not find a compensatory increase in Chkb mRNA and CK-β protein expression in Chka+/− mice.
Another possible way to maintain PC balance would be to make PC through the PEMT pathway. We did not find a difference in PEMT activity in liver although PE mass decreased. Previous studies in this laboratory demonstrated liver damage due to a decreased ratio of PC to PE in livers from Pemt−/− mice fed a choline-deficient diet (40, 41). Thus, an increased PC/PE ratio may represent a form of compensation in Chka+/− mice (i.e. trying to maintain an intact cell membrane). The increase of hepatic triacylglycerol and cholesteryl ester may indicate that partial disruption of CK-α in mice results in a dysregulation of triacylglycerol and cholesteryl ester synthesis or degradation pathways in liver. However, the plasma lipid profiles were not influenced nor was there any obvious hepatic dysfunction. In preliminary experiments, we challenged Chka+/− mice with a high-fat/high-cholesterol diet for 3 weeks, but abnormal plasma alanine aminotransferase activity was not observed. The phenotypic similarity between the heterozygous and wild-type adult mice in the current study suggests that the amount of CK-α enzyme in wild-type liver and testis is more than sufficient to maintain PC-associated functions.
Additional roles for CK have been reported in recent years. Besides being involved in PC biosynthesis, CK is also closely associated with cell stress and cell defense (3, 11, 42). Some studies also demonstrated that Ras-transformed cell lines showed higher phosphocholine levels as a consequence of increased CK activity (43, 44). It seems that elevated phosphocholine is a common characteristic feature in cell lines derived from human tumors (45). CK (probably CK-α) protein levels have been found to be drastically increased in both human tumors and cell lines derived from human tumors, when compared with normal tissues or appropriate human primary cells, respectively (46). Based on these observations in recent years, CK is becoming a new and important target for cancer diagnosis and treatment. Thus, if we had been able to generate Chka−/− mice, it would have been interesting to determine whether such mice were resistant to the development of certain cancers.
Acknowledgments
We thank Randy Nelson, Laura Hargreaves, Priscilla Gao, Audric Moses, and Sandra Ungarian for technical assistance.
Footnotes
This work was supported by a grant from the Canadian Institutes of Health Research and by BayGenomics, a Program for Genomics Applications from the National Institutes of Health NHLBI Grant UO1 HL66621.
The abbreviations used are: PC, phosphatidylcholine; CK, choline kinase; CT, CTP:phosphocholine cytidylyltransferase; PE, phosphatidylethanolamine; PEMT, phosphatidylethanolamine N-methyltransferase; GST, glutathione S-transferase; MEF, mouse embryonic fibroblasts; E, embryonic day.
References
- 1.Vance DE. In: Biochemistry of Lipids, Lipoproteins and Membranes. Vance DE, Vance JE, editors. Elsevier Science; Amsterdam: 2002. pp. 205–232. [Google Scholar]
- 2.Cuadrado A, Carnero A, Dolfi F, Jimenez B, Lacal JC. Oncogene. 1993;8:2959–2968. [PubMed] [Google Scholar]
- 3.Aoyama C, Liao H, Ishidate K. Prog Lipid Res. 2004;43:266–281. doi: 10.1016/j.plipres.2003.12.001. [DOI] [PubMed] [Google Scholar]
- 4.Ishidate K, Enosawa S, Nakazawa Y. Biochem Biophys Res Commun. 1983;111:683–689. doi: 10.1016/0006-291x(83)90360-1. [DOI] [PubMed] [Google Scholar]
- 5.Sher RB, Aoyama C, Huebsch KA, Ji S, Kerner J, Yang Y, Frankel WN, Hoppel CL, Wood PA, Vance DE, Cox GA. J Biol Chem. 2006;281:4938–4948. doi: 10.1074/jbc.M512578200. [DOI] [PubMed] [Google Scholar]
- 6.Pfaffl MW. Nucleic Acids Res. 2001;29:e45. doi: 10.1093/nar/29.9.e45. [DOI] [PMC free article] [PubMed] [Google Scholar]
- 7.Bradford MM. Anal Biochem. 1976;72:248–254. doi: 10.1016/0003-2697(76)90527-3. [DOI] [PubMed] [Google Scholar]
- 8.Bligh EG, Dyer WJ. Can J Biochem Physiol. 1959;37:911–917. doi: 10.1139/o59-099. [DOI] [PubMed] [Google Scholar]
- 9.McCluer RH, Ullman MD, Jungalwala FB. Adv Chromatogr. 1986;25:309–353. [PubMed] [Google Scholar]
- 10.Lohninger A, Preis P, Linhart L, Sommoggy SV, Landau M, Kaiser E. Anal Biochem. 1990;186:243–250. doi: 10.1016/0003-2697(90)90074-j. [DOI] [PubMed] [Google Scholar]
- 11.Ishidate K, Nakazawa Y. Methods Enzymol. 1992;209:121–134. doi: 10.1016/0076-6879(92)09016-v. [DOI] [PubMed] [Google Scholar]
- 12.Noga AA, Vance DE. J Lipid Res. 2003;44:1998–2005. doi: 10.1194/jlr.M300226-JLR200. [DOI] [PubMed] [Google Scholar]
- 13.Nakagami K, Uchida T, Ohwada S, Koibuchi Y, Suda Y, Sekine T, Morishita Y. Jpn J Cancer Res. 1999;90:419–424. doi: 10.1111/j.1349-7006.1999.tb00764.x. [DOI] [PMC free article] [PubMed] [Google Scholar]
- 14.Noga AA, Zhao Y, Vance DE. J Biol Chem. 2002;277:42358–42365. doi: 10.1074/jbc.M204542200. [DOI] [PubMed] [Google Scholar]
- 15.Cases S, Stone SJ, Zhou P, Yen E, Tow B, Lardizabal KD, Voelker T, Farese RV., Jr J Biol Chem. 2001;276:38870–38876. doi: 10.1074/jbc.M106219200. [DOI] [PubMed] [Google Scholar]
- 16.Aoyama C, Ohtani A, Ishidate K. Biochem J. 2002;363:777–784. doi: 10.1042/0264-6021:3630777. [DOI] [PMC free article] [PubMed] [Google Scholar]
- 17.Sundler R, Akesson B. J Biol Chem. 1975;250:3359–3367. [PubMed] [Google Scholar]
- 18.DeLong CJ, Shen YJ, Thomas MJ, Cui Z. J Biol Chem. 1999;274:29683–29688. doi: 10.1074/jbc.274.42.29683. [DOI] [PubMed] [Google Scholar]
- 19.Reo NV, Adinehzadeh M, Foy BD. Biochim Biophys Acta. 2002;1580:171–188. doi: 10.1016/s1388-1981(01)00202-5. [DOI] [PubMed] [Google Scholar]
- 20.Walkey CJ, Donohue LR, Bronson R, Agellon LB, Vance DE. Proc Natl Acad Sci U S A. 1997;94:12880–12885. doi: 10.1073/pnas.94.24.12880. [DOI] [PMC free article] [PubMed] [Google Scholar]
- 21.Walkey CJ, Yu L, Agellon LB, Vance DE. J Biol Chem. 1998;273:27043–27046. doi: 10.1074/jbc.273.42.27043. [DOI] [PubMed] [Google Scholar]
- 22.Zhang D, Tang W, Yao PM, Yang C, Xie B, Jackowski S, Tabas I. J Biol Chem. 2000;275:35368–35376. doi: 10.1074/jbc.M007099200. [DOI] [PubMed] [Google Scholar]
- 23.Jacobs RL, Devlin C, Tabas I, Vance DE. J Biol Chem. 2004;279:47402–47410. doi: 10.1074/jbc.M404027200. [DOI] [PubMed] [Google Scholar]
- 24.Wang L, Magdaleno S, Tabas I, Jackowski S. Mol Cell Biol. 2005;25:3357–3363. doi: 10.1128/MCB.25.8.3357-3363.2005. [DOI] [PMC free article] [PubMed] [Google Scholar]
- 25.Jackowski S, Rehg JE, Zhang YM, Wang J, Miller K, Jackson P, Karim MA. Mol Cell Biol. 2004;24:4720–4733. doi: 10.1128/MCB.24.11.4720-4733.2004. [DOI] [PMC free article] [PubMed] [Google Scholar]
- 26.Henneberry AL, Wistow G, McMaster CR. J Biol Chem. 2000;275:29808–29815. doi: 10.1074/jbc.M005786200. [DOI] [PubMed] [Google Scholar]
- 27.Tian Y, Jackson P, Gunter C, Wang J, Rock CO, Jackowski S. J Biol Chem. 2006;281:28438–28449. doi: 10.1074/jbc.M605861200. [DOI] [PubMed] [Google Scholar]
- 28.Fullerton MD, Hakimuddin F, Bakovic M. Mol Cell Biol. 2007;27:3327–3336. doi: 10.1128/MCB.01527-06. [DOI] [PMC free article] [PubMed] [Google Scholar]
- 29.Steenbergen R, Nanowski TS, Beigneux A, Kulinski A, Young SG, Vance JE. J Biol Chem. 2005;280:40032–40040. doi: 10.1074/jbc.M506510200. [DOI] [PMC free article] [PubMed] [Google Scholar]
- 30.Zeisel SH. Am J Clin Nutr. 2005;82:719–720. doi: 10.1093/ajcn/82.4.719. [DOI] [PubMed] [Google Scholar]
- 31.Zeisel SH, Mar MH, Zhou Z, da Costa KA. J Nutr. 1995;125:3049–3054. doi: 10.1093/jn/125.12.3049. [DOI] [PubMed] [Google Scholar]
- 32.Zeisel SH. Annu Rev Nutr. 2006;26:229–250. doi: 10.1146/annurev.nutr.26.061505.111156. [DOI] [PMC free article] [PubMed] [Google Scholar]
- 33.Zeisel SH, Wurtman RJ. Biochem J. 1981;198:565–570. doi: 10.1042/bj1980565. [DOI] [PMC free article] [PubMed] [Google Scholar]
- 34.Zeisel SH, Epstein MF, Wurtman RJ. Life Sci. 1980;26:1827–1831. doi: 10.1016/0024-3205(80)90585-8. [DOI] [PubMed] [Google Scholar]
- 35.Zeisel SH. J Am Coll Nutr. 2000;19:528S–531S. doi: 10.1080/07315724.2000.10718976. [DOI] [PubMed] [Google Scholar]
- 36.Zeisel SH. Nutrition. 2000;16:669–671. doi: 10.1016/s0899-9007(00)00349-x. [DOI] [PubMed] [Google Scholar]
- 37.Chung T, Crilly KS, Anderson WH, Mukherjee JJ, Kiss Z. J Biol Chem. 1997;272:3064–3072. doi: 10.1074/jbc.272.5.3064. [DOI] [PubMed] [Google Scholar]
- 38.Fisher MC, Zeisel SH, Mar MH, Sadler TW. FASEB J. 2002;16:619–621. doi: 10.1096/fj.01-0564fje. [DOI] [PubMed] [Google Scholar]
- 39.Michel V, Yuan Z, Ramsubir S, Bakovic M. Exp Biol Med (Maywood) 2006;231:490–504. doi: 10.1177/153537020623100503. [DOI] [PubMed] [Google Scholar]
- 40.Li Z, Agellon LB, Vance DE. J Biol Chem. 2005;280:37798–37802. doi: 10.1074/jbc.M508575200. [DOI] [PubMed] [Google Scholar]
- 41.Li Z, Agellon LB, Allen TM, Umeda M, Jewell L, Mason A, Vance DE. Cell Metab. 2006;3:321–331. doi: 10.1016/j.cmet.2006.03.007. [DOI] [PubMed] [Google Scholar]
- 42.Titarenko E, Rojo E, Leon J, Sanchez-Serrano JJ. Plant Physiol. 1997;115:817–826. doi: 10.1104/pp.115.2.817. [DOI] [PMC free article] [PubMed] [Google Scholar]
- 43.Macara IG. Mol Cell Biol. 1989;9:325–328. doi: 10.1128/mcb.9.1.325. [DOI] [PMC free article] [PubMed] [Google Scholar]
- 44.Teegarden D, Taparowsky EJ, Kent C. J Biol Chem. 1990;265:6042–6047. [PubMed] [Google Scholar]
- 45.Bhakoo KK, Williams SR, Florian CL, Land H, Noble MD. Cancer Res. 1996;56:4630–4635. [PubMed] [Google Scholar]
- 46.Ramirez de Molina A, Gutierrez R, Ramos MA, Silva JM, Silva J, Bonilla F, Sanchez JJ, Lacal JC. Oncogene. 2002;21:4317–4322. doi: 10.1038/sj.onc.1205556. [DOI] [PubMed] [Google Scholar]