

Abstract
Anti-angiogenic agents targeting brain tumor neovasculature may increase progression-free survival in patients with recurrent malignant gliomas. However, when these patients do recur it is not always apparent as an increase in enhancing tumor volume on MRI, which has been the standard of practice for following patients with brain tumors. Therefore alternative methods are needed to evaluate patients treated with these novel therapies. Furthermore, a method that can also provide useful information for the evaluation of conventional therapies would provide an important advantage for general applicability. Diffusion-weighted magnetic resonance imaging (DWI) has the potential to serve as a valuable biomarker for these purposes. In the current study, we explore the prognostic ability of functional diffusion maps (fDMs), which examine voxel-wise changes in the apparent diffusion coefficient (ADC) over time, applied to regions of fluid-attenuated inversion recovery (FLAIR) abnormalities in patients with malignant glioma, treated with either anti-angiogenic or cytotoxic therapies. Results indicate that the rate of change in fDMs is an early predictor of tumor progression, time to progression and overall survival for both treatments, suggesting the application of fDMs in FLAIR abnormal regions may be a significant advance in brain tumor biomarker technology.
Keywords: Functional diffusion map (fDM), Diffusion MRI, Glioma, Bevacizumab, Chemotherapy, Angiogenesis, Brain tumor
Introduction
The FDA has recently recognized bevacizumab, a humanized monoclonal VEGF-blocking antibody with anti-angiogenic properties, as a valuable treatment option for patients with malignant gliomas who have failed traditional cytotoxic therapy. Although this new treatment has shown increased progression-free survival in Phase II clinical trials [1, 2], standard ways of monitoring patients on these treatments have fallen short. Specifically, evaluation of contrast-enhancing tumor volumes on MRI are no longer routinely reliable due to the effect of these new drugs to decrease contrast agent extravasation with or without effects on tumor biology [3, 4]. For this reason we propose the development and application of a new diffusion-imaging based biomarker to quantitatively monitor and predict the impact these drugs have on the malignant tumor cell density and invasion, independent of changes in contrast agent enhancement. Since apparent diffusion coefficient (ADC), a diffusion MRI-based measurement of water motility, is negatively correlated with cell density [5–13], we hypothesized that diffusion-weighted MRI (DWI)-based methods, and in particular functional diffusion maps (fDMs) may be useful for studying changes in tumor cell density in response to anti-angiogenic treatments, as well as standard treatments.
The functional diffusion map (fDM) was developed to take advantage of the relationship between ADC measurement and cell density by examining voxel-wise changes in ADC measured in the same patient over time [14–17], thereby increasing the sensitivity of detecting subtle changes in cell density. This technique has demonstrated utility in predicting the effect of cytotoxic chemotherapy and radiotherapy within the contrast-enhancing tumor bed [14–17]; however it has not been evaluated for use in evaluating anti-angiogenic therapies, nor has it been applied outside the contrast-enhancing tumor. We hypothesize that the rate of change in fDMs is a valuable predictive biomarker for tumor progression and survival in both cytotoxic and anti-angiogenic treatments, making it a flexible imaging biomarker for testing future treatment paradigms.
As previously mentioned, historically, the fDM technique has been used to evaluate the contrast-enhancing tumor regions in response to initial cytotoxic and/or radiotherapies [17]; however, nearly 40% of glioma patients do not present with contrast-enhancement [18–20]. Additionally, the administration of steroids [21–23] or anti-angiogenic agents [4, 24] notably causes a reduction of the contrast-enhancing volume, due to the decrease in vascular permeability. Therefore, the standard approach of using enhancing tumor volumes to monitoring treatment response is often not reliable or even feasible. To overcome these challenges, we hypothesized that the fDM technique would be useful when applied to regions showing FLAIR and/or T2 signal abnormalities, since T2 signal abnormalities are routinely used to define the extent of malignant tumor in both contrast-enhancing and non-enhancing tumors [25–29]. Pilot study results have suggested this technique is useful for comparison between treatment paradigms [30] and as a tool for long-term clinical monitoring in both enhancing and non-enhancing gliomas [31, 32].
In the current study, we explore the prognostic ability of fDMs applied to regions of fluid-attenuated inversion recovery (FLAIR) abnormalities in patients with malignant glioma treated with either cytotoxic or anti-angiogenic therapies. Results indicate that the rate of change in fDMs is an early predictor of tumor progression, time to progression and overall survival during both cytotoxic and anti-angiogenic treatments, suggesting the application of fDMs in FLAIR abnormal regions may be a significant advance in brain tumor biomarker technology.
Materials and methods
Subjects
A total of 50 patients with confirmed gliomas were enrolled in the current study. Twenty malignant glioma patients (WHO grade III, n = 4; WHO grade IV, n = 16) were treated with the anti-angiogenic agent bevacizumab (10 mg/kg, I.V. every 2 weeks) after failure of cytotoxic therapy. Bevacizumab was delivered with or without adjuvant chemotherapy (Bevacizumab monotherapy, n = 8; Bevacizumab and Irinotecan, n = 12). Additionally, a total of 30 malignant glioma patients (WHO grade III, n = 21; WHO grade IV, n = 9) were given standard cytotoxic therapy (temozolomide, 100–150 mg/m2/day over 5 days per 28 day cycle, for a maximum of 12 cycles) following radiotherapy after initial diagnosis. All patients had routine follow-up imaging and clinical evaluation at intervals ranging from 4 to 8 weeks during treatment, consisting of both clinical MRI (including DWI) and neurological assessment. All patients gave informed written consent according to the guidelines approved by the Institutional Review Board of the Medical College of Wisconsin.
Clinical MRI
Clinical MRI scans included a 3D spoiled gradient recalled (SPGR) anatomical scan, pre-contrast T1-weighted (T1) scan, post-contrast T1-weighted (T1+C) scan, and a fluid-attenuated inversion recovery scan (FLAIR) collected on a 1.5-T MR scanner (Signa Excite, CVi, or LX; GE Medical Systems, Milwaukee, WI). The 3D SPGR images were acquired with echo-time (TE)/repetition time (TR) = 3.16 ms/8.39 ms, number of averages (NEX) = 2, slice thickness = 1.3 mm collected contiguously, flip angle = 10°, field-of-view (FOV) = 240 mm, and a matrix size of 256 × 192 (zero-padded and interpolated to 256 × 256) resulting in a total of 123–128 images. Axial pre- and post-contrast T1-weighted images were acquired before and after administration of up to 10 cc gadobenate dimeglumine (Multihance; Bracco Diagnostics Inc., Princeton, NJ) or up to 20 cc of gadodiamine (Omniscan; GE Healthcare Systems) contrast agent with a fast spin-echo (FSE) sequence, TE/TR = 24.16 ms/666.7 ms, NEX = 1, slice thickness of 5 mm with 1.5 mm interslice gap, flip angle = 90°, FOV = 240 mm, and a matrix size of 256 × 192 (zero-padded and interpolated to 256 × 256) resulting in a total of 22–24 images. Axial FLAIR images were collected with a FSE readout, inversion time (TI) = 2,200 ms, TE/TR = 125.2 ms/10,000 ms, NEX = 1, slice thickness of 5 mm with 1.5 mm interslice gap, flip angle = 90°, FOV = 240 mm, and a matrix size of 256 × 224 (reconstructed images were zero-padded and interpolated to 256 × 256) resulting in a total of 22–24 images.
Diffusion MRI
Diffusion weighted images (DWIs) were collected with TE/TR = 102.2 ms/8,000 ms, NEX = 1, slice thickness of 5 mm with 1.5 mm interslice gap, flip angle = 90°, FOV = 240 mm, and a matrix size of 128 × 128 (reconstructed images were zero-padded and interpolated to 256 × 256) using either an EPI or PROPELLER readout. The readout sequence (PROPELLER or EPI) was consistent for each patient across all scan days. DWIs were acquired with b = 0 and 1,000 s/mm2, using all gradients applied equally (isotropic). After collecting the images the apparent diffusion coefficient (ADC) maps were calculated from the b = 1,000 s/mm2 and b = 0 images.
Functional diffusion maps (fDMs)
All images for each patient were registered to their own baseline, post-surgical, pre-chemotherapy or pre-Avastin SPGR anatomical images using a mutual information algorithm and a 12-degree of freedom transformation using FSL (FMRIB, Oxford, UK; http://www.fmrib. ox.ac.uk/fsl/). Fine registration (1–2° and 1–2 voxels) was then performed using a Fourier transform-based, 6-degree of freedom, rigid body registration algorithm [33] followed by visual inspection to ensure adequate alignment. After proper registration was verified, voxel-by-voxel subtraction was performed between ADC maps acquired at subsequent time points and the baseline, postsurgical, pre-treatment, ADC maps to create ΔADC images. Individual voxels were stratified into three categories based on the change in ADC relative to baseline ADC maps. Red voxels represented areas within the tumor where ADC increased beyond the ΔADC threshold of 0.4 × 10⁻³ mm2/s (i.e. “hypocellular” voxels), blue voxels represented areas within the tumor where ADC decreased beyond the ΔADC threshold of 0.4 × 10⁻³ mm2/s (i.e. “hypercellular” voxels), and green voxels represented no change in ADC above or below the ΔADC thresholds listed above. This threshold has been shown to have the highest sensitivity and specificity to progressive disease and is defined as the 95% confidence interval for a mixture of normal-appearing white and gray matter evaluated from post-baseline time points ranging from 1 week to 1 year [34].
Definition of progressive and stable disease
In order to determine the sensitivity and specificity of changes in fDM parameters to tumor response following treatment, we examined patients receiving either adjuvant temozolomide after concurrent temozolomide and radiotherapy post-surgery, or bevacizumab alone or in combination with irinotecan, after failure of standard treatment consisting of radiotherapy and concurrent temozolomide then 12 cycles of adjuvant temozolomide. Tumor responses were determined by either a board certified radiologist (SDR) and/or neuro-oncologists (MGM, JMC) using the decision tree illustrated in Fig. 1a. Additionally, tumor progression was confirmed by a consensus at our Neuro-Oncology Tumor Board. Since tumor progression during treatment with bevacizumab can occur without changes in contrast-enhancement due to the nature of the treatment (as seen in 70% of bevacizumab patients in the current study), we chose to use a combination of both neurological status (as defined by the Karnofsky Performance Score (KPS) [35, 36]) and radiographic status (as defined by the Macdonald criteria [37]) to stratify the tumor response into two categories at each post-treatment time point. Progressing disease (PD) was defined as having a KPS that decreased more than 20 points with respect to the previous exam and/or radiographic progression according to the Macdonald criteria, whereas stable/responding disease (SD/RD) was defined as neurologically and radiographically stable or responding favorably to treatment. Specifically, RD defined as having an increase in KPS of more than 20 points and a decrease in enhancing volume ≥50% (similar to partial response criteria according to the Macdonald criteria). SD was defined as all other circumstances. It is important to note that a change in abnormal FLAIR signal intensity was typically observed in patients on bevacizumab that progressed without contrast enhancement; however, we did not explicitly use a change in FLAIR signal as a criterion for progression. We also tested whether the daily rate of change in hypercellular volume (rate of change in the volume of voxels having significantly decreased ADC over time, in μl/day) is a sufficiently sensitive and specific biomarker for detecting progressive disease (PD) in patients undergoing either cytotoxic (temozolomide) or anti-angiogenic (bevacizumab) treatment protocols.
Fig. 1.

Decision trees for determining disease progression and fDM responders. a Decision tree for determining progressive disease (PD) from stable or responding disease (SD/RD), using a combination of both neurological and radiographic status. b Decision tree for determining “fDM Responders” and “fDM Non-responders” using the first three fDMs. The “fDM Non-responders” consisted of patients with two sequential increases in the volume of hypercellularity on fDMs after treatment
Statistical analyses
Receiver–operator characteristic curves were generated using GraphPad Prism version 4.0 to describe the sensitivity and specificity of fDMs to progressive disease, as defined by the decision tree in Fig. 1b. The area under the curve (AUC) was used to determine if the daily rate of change in hypercellular volume (rate of change in volume experiencing a significant decrease in ADC relative to baseline) was predictive of progressing disease in both cytotoxic and anti-angiogenic therapy groups.
A two-way analysis of variance (ANOVA) and Tukey's test for multiple comparisons was used to determine whether the rate of change in hypercellular volume was significantly different between progressive disease (PD) and stable/responding disease (SD/RD), or between treatment paradigms (bevacizumab versus temozolomide). A two-way ANOVA and Tukey's test for multiple comparisons was used to determine whether the ratio of hypercellular volume to abnormal FLAIR volume was significantly different between time points (months from start of treatment) and treatment paradigms (bevacizumab versus temozolomide). A Mann–Whitney test was used to test whether the volume of FLAIR signal abnormality was significantly different between bevacizumab or temozolomide therapy at the time of tumor recurrence. A three-way ANOVA was used to test whether there were significant differences between fDM responders and fDM non-responders for each treatment paradigm (bevacizumab versus temozolomide), or for the time from the start of treatment. Additionally, Log-Rank statistical analysis was performed on Kaplan–Meier data to determine significant differences in overall survival and time-to-progression in patients treated with either bevacizumab or temozolomide, respectively.
Results
Similar to observations in other studies, significantly larger abnormal FLAIR volumes at recurrence were observed in patients treated with bevacizumab compared with patients treated with temozolomide (Fig. 3a; Mann–Whitney test, P = 0.0001). In many bevacizumab-treated patients who eventually progressed, rapid expansion of FLAIR or contrast enhancement occurred at volume changes much larger than typifies failure of cytotoxic treatment. In contrast to the inadequacy of traditional MR sequences to monitor tumor dynamics during treatment with anti-angiogenic agents, changes in hypercellular volume kinetics during administration of cytotoxic and anti-angiogenic agents often predicted eventual changes in neurological and/or radiographic status. For example, the patient in Fig. 2 received bevacizumab monotherapy and traditional MRI suggested a decrease in FLAIR signal abnormality as well as a sizeable decrease in contrast enhancement (i.e. complete radiographic response according to the Macdonald criteria), despite the patient's rapid neurological deterioration. When fDMs were examined over the same time points, the volume of hypercellularity increased substantially over time, consistent with rapid tumor growth and resulting neurological impairment. Approximately 2 months after the last scan shown in Fig. 2, the patient died presumably from tumor burden.
Fig. 3.
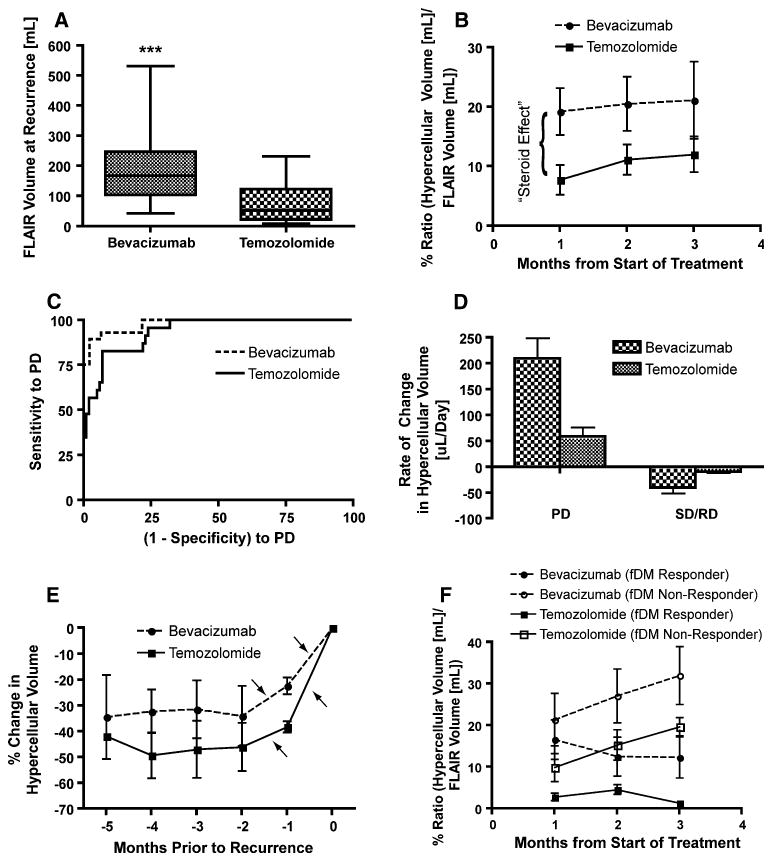
fDM characteristics of bevacizumab and temozolomide. a Volume of abnormal FLAIR signal intensity is significantly higher in bevacizumab treated patients compared to temozolomide treated patients at recurrence (Mann–Whitney, P = 0.0001). b Ratio of hypercellular volume to abnormal FLAIR volume in the first the months of treatment suggests a higher volume of hypercellularity in bevacizumab-treated patients (Two-way ANOVA, P = 0.006 for bevacizumab versus temozolomide). This is likely due to the known “steroid effect” of bevacizumab, causing a reduction in vasogenic edema and a lower average post-treatment ADC. c Receiver–operator characteristics (ROC) curves showing sensitivity and specificity of fDMs to progressive disease, as defined in Fig. 1a. d The rate of change in hypercellular volume for progressive disease (PD) and stable or responding disease (SD/RD), illustrating a significantly higher rate of increase in hypercellular volume during recurrence on bevacizumab compared with temozolomide (Two-way ANOVA, P < 0.0001 for bevacizumab versus temozolomide within PD). e Percentage change in hypercellular volume with respect to the volume at recurrence shows two sequential increases in hypercellular volume (arrows) just prior to recurrence. f Stratification of patients as “fDM Responders” and “fDM Non-responders” in the first 3 months of treatment. Note that e and f illustrate the volume kinetics from fundamentally different perspectives (time of recurrence versus start of treatment)
Fig. 2.

Standard MRI and fDMs in a patient with progressive disease after treatment with bevacizumab. A 47 year-old male with a history of glioblastoma multiforme completed radiotherapy with concurrent temozolomide, followed by adjuvant temozolomide. His tumor recurred radiographically just prior to baseline ADC maps. The patient was then changed to bevacizumab monotherapy, and initially contrast enhancement and FLAIR signal abnormality improved substantially. The patient declined neurologically over 4 months of bevacizumab treatment, despite a positive radiographic response on post-contrast T1-weighted (top row) and FLAIR images (middle row). The patient expired 2 months from the last fDM time-point (6 months after start of bevacizumab treatment). During bevacizumab treatment, fDMs showed a rapid increase in the volume of hypercellularity, indicative of failed treatment
Trends in the hypercellular volume kinetics were helpful in following the growth of suspected tumor in all patients and all treatments; however, data extracted from fDMs suggest significant differences in the relative volume of hypercellularity between bevacizumab-treated and temozolomide-treated patients immediately following treatment (Fig. 3b; two-way ANOVA, P = 0.006 for bevacizumab versus temozolomide at 1 month data point). Since the pre-treatment ADC map was used as the baseline, these results imply the initial dose of bevacizumab may cause a significant decrease in vasogenic edema, similar to the effect of corticosteroids, artificially reducing the ADC with respect to baseline, resulting in a higher observed cell density due to extracellular water displacement independent of tumor proliferation.
Despite this initial discrepancy in the volume of hypercellularity detected with fDMs between these different treatments, data suggests the rate of change in hypercellular volume may indicate growing tumor burden for both cytotoxic and anti-angiogenic treatments. Receiver-operator characteristic (ROC) analysis (Fig. 3c) suggests that the rate of change in hypercellular volume (i.e. how fast the volume is increasing with respect to the previous hypercellular volume estimation) is significantly more predictive of PD compared to chance for both cytotoxic (area under ROC curve (AUC) = 0.9361, P < 0.0001) and anti-angiogenic treatment (AUC = 0.979, P < 0.0001). In particular, an increase in hypercellular volume of more than 20 μl/day over two sequential imaging time points has 93% sensitivity and 91% specificity for PD in patients treated with bevacizumab; whereas a rate of change in hypercellularity of more than 10 μl/day has 96% sensitivity and 78% specificity for PD in patients treated with temozolomide. Closer examination of the rate of change in hypercellular volume at the time of radiographic or neurological recurrence revealed much higher rates of increase in hypercellular volume in bevacizumab treated patients compared with temozolomide treated patients (Fig. 3d, two-way ANOVA, P < 0.0001 for bevacizumab versus temozolomide for PD), and two sequential increases in hypercellular volume were typically observed over the 2 months prior to recurrence (Fig. 3e).
Based on these trends, we hypothesized that patients having two consecutive increases in hypercellular volume at the initiation of treatment are at a greater risk for early recurrence and/or shortened survival, regardless of the therapeutic mechanism. To test this hypothesis and specifically address whether fDMs can predict response to therapy, we empirically defined “fDM Non-Responders” as patients with two consecutive increases in hypercellular volume over the first months following the start of treatment and “fDM Responders” as patients with at least one decrease in hypercellular volume over the same time period (Fig. 3b, f). Since patients who are treated with temozolomide typically receive bevacizumab treatment upon recurrence, we chose two separate end points for analysis. We tested the ability of fDMs to predict overall survival in patients treated with bevacizumab and time to progression in patients treated with temozolomide. Results suggest no survival difference between malignant tumor grades in patients treated with bevacizumab (Fig. 4a; Log-Rank, P = 0.7596) and no survival difference between patients treated with bevacizumab alone (monotherapy) or with adjuvant irinotecan (Fig. 4c, Log-Rank, P = 0.4220). However, patients over the age of 40, undergoing bevacizumab therapy, had a significantly longer survival compared with patients under the age of 40 (Fig. 4b, Log-Rank, P = 0.0446). The survival benefit found in older patients treated with bevacizumab was an unexpected finding that has only recently been reported [1]. The fDM response criteria described in Fig. 1b was the strongest predictor of survival in patients treated with bevacizumab, where “fDM Responders” had a significantly longer survival compared to “fDM Non-Responders” (Fig. 4d; Log-Rank, P = 0.0008). Specifically, a median survival time of 6 months was found for “fDM Non-Responders”, whereas a median survival time of 16 months was found for “fDM Responders.” When examining the response to cytotoxic treatment, results suggested no difference between tumor grades with respect to time to progression in temozolomide-treated patients (Fig. 4e; Log-Rank, P = 0.6851). Similarly, results suggested no statistical difference between time to progression when patients were stratified by age (Fig. 4F, Log-Rank, P = 0.0725); however, younger patients appeared to have a slightly longer period of progression free survival compared with older patients. When stratifying patients according to fDM criteria, “fDM Responders” had a significantly longer time to progression compared with “fDM Non-Responders” (Fig. 4g; Log-Rank, P = 0.0002). These results suggest that fDMs applied to regions of FLAIR abnormality are valuable predictive biomarkers of brain tumor progression.
Fig. 4.
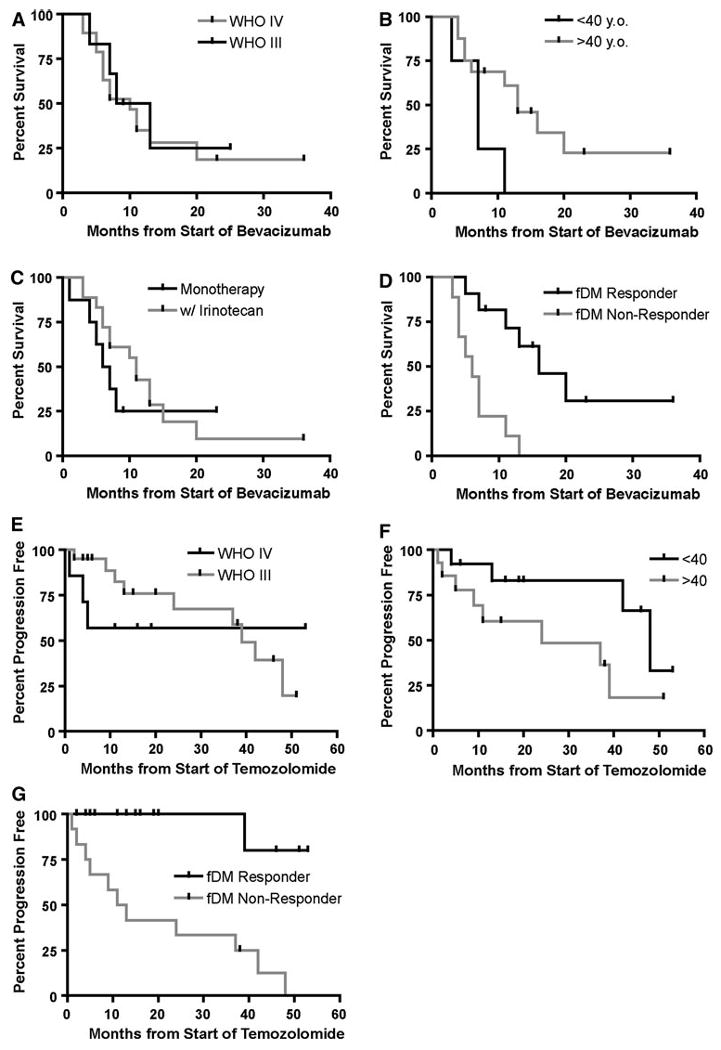
Response on fDMs predicts overall survival (OS) in bevacizumab patients and time to progression (TTP) in temozolomide patients. a OS in bevacizumab patients stratified with respect to tumor grade (Log-Rank, P = 0.7596). b OS in bevacizumab patients stratified with respect to age (Log-Rank, P = 0.0446). c OS in bevacizumab patients stratified by whether they were on bevacizumab alone (monotherapy) or with adjuvant irinotecan (Log-Rank, P = 0.4220). d OS in bevacizumab patient stratified as “fDM Responders” or “fDM Non-responders” (Log-Rank, P = 0.0008). e TTP in temozolomide patients stratified by tumor grade (Log-Rank, P = 0.6851). f TTP in temozolomide patients stratified with respect to age (Log-Rank, P = 0.0725). g TTP in temozolomide patients stratified as “fDM Responders” or “fDM Non-responders” (Log-Rank, P = 0.0002)
Discussion
Bevacizumab treatment has been shown to improve progression-free survival, response rate, and overall survival in patients with recurrent glioblastoma [1, 2]; however, some patients do not respond favorably and eventually all patients recur. Due to the high cost of treatment and unconventional patterns of relapse after failure of bevacizumab [3], there is a significant need for novel, sensitive imaging biomarkers for early detection of non-responders to anti-angiogenic treatment. Results from the current study suggest that fDMs applied to regions of FLAIR signal abnormality are a useful clinical tool for monitoring both contrast-enhancing and non-enhancing gliomas for patients undergoing both cytotoxic and anti-angiogenic treatment regimens. Furthermore, our data suggests that the new approach of determining the rate of change in hypercellular volume can be used as a predictor of tumor progression, time to progression, and overall survival, regardless of the therapeutic paradigm.
In the current study we observed a significantly larger rate of change in hypercellular volume during tumor progression in bevacizumab-treated patients compared with temozolomide-treated patients. These results support the idea that when tumor progression occurs during treatment with bevacizumab it is often a more infiltrative, aggressive tumor phenotype [4, 24]; however, it is also likely that this rate difference reflects the different stage of disease between these patient populations, since the patients given bevacizumab have already failed standard treatment. Also in agreement with previous studies [4, 24], we observed a significantly larger volume of FLAIR signal abnormality for patients undergoing bevacizumab treatment relative to those undergoing standard temozolamide treatment. Both of these observations may be due to the fact that the survival of patients treated with bevacizumab is longer allowing more time for the disease to progress to such stages, or it may represent a biologic escape mechanism that is enhanced in response to bevacizumab treatment.
The strong prognostic ability of fDMs in anti-angiogenic treatment paradigms is partially supported by a recent study showing that standard diffusion MRI can be used as a method of dichotomizing bevacizumab responders from non-responders [38]. Although results from this study were favorable, only the ADC distributions in contrast-enhancing regions were examined. Since nearly 40% of glioma patients do not present with contrast-enhancement [18–20], and recurrence after failure of bevacizumab typically results in increased non-enhancing tumor with stable or decreasing enhancing disease [3, 4], using the ADC histogram within contrast-enhancing tumor regions may only be sufficient for glioblastoma patients. Since fDMs also utilize standard diffusion MR images, the use of fDMs within regions of FLAIR signal abnormalities may offer a more robust and inclusive biomarker compared with the ADC histogram technique, particularly in grade III tumors that often lack contrast enhancement.
Technical and clinical considerations
Although the fDM approach is fairly straightforward, a few technical and clinical considerations should be addressed. First, proper alignment of serial diffusion MR images to the baseline images is critical for accurate fDMs. Significant mass effect from tumor growth or intracranial pressure induced by edema may skew the registration between diffusion MRI datasets. Suspected tumor regions near gyri, sulci, or the ventricles should be considered with caution, since erroneous results in these regions can occur as a result of misregistration. To overcome these challenges, we chose to use two sequential automated registration steps followed by manual inspection. In addition, our experience suggests an additional step of elastic (non-linear) registration is beneficial for the registration of significantly distorted datasets, such as the ART algorithm developed and tested by Ardekani et al. [39].
Another important aspect of clinical fDM implementation is the proper choice of b-value, or level of diffusion weighting. Per the recommendations of the National Cancer Institute Diffusion MRI Consensus Conference [40], three or more b-values (0, >100, and >500 s/mm2) should be used for an adequate estimate of ADC that is also perfusion-insensitive (by using at least two b-values > 100 s/mm2). Additionally, the choice of b-values greater than 1500 s/mm2 results in a multi-exponential signal decay, where a single estimate of ADC may not be appropriate. Unfortunately, the current study was performed retrospectively and so many of the consensus recommendations could not be implemented.
Use of the terms “hypercellularity” and “hypocellularity” instead of “decreasing ADC” and “increasing ADC” in the current study may be misleading, since many pathologies and clinical scenarios can alter ADC measurements. According to our recommendations, clinical translation of the fDM technique to monitor tumor growth should involve integration of interpretations from various specialists to rule out the possibility of confounding factors.
Acknowledgments
This work was financially supported by NIH/NCI R21-CA109820, NIH/NCI R01-CA082500, MCW Advancing Healthier Wisconsin/Translational Brain Tumor Research Program, and MCW Cancer Center Fellowship.
Contributor Information
Benjamin M. Ellingson, Email: bellingson@mednet.ucla.edu, Translational Brain Tumor Research Program, Medical College of Wisconsin, Milwaukee, WI, USA; Department of Radiology, Medical College of Wisconsin, Milwaukee, WI, USA; Department of Neurosurgery, Medical College of Wisconsin, Milwaukee, WI, USA.
Mark G. Malkin, Translational Brain Tumor Research Program, Medical College of Wisconsin, Milwaukee, WI, USA; Department of Neurology, Medical College of Wisconsin, Milwaukee, WI, USA; Department of Neurosurgery, Medical College of Wisconsin, Milwaukee, WI, USA
Scott D. Rand, Translational Brain Tumor Research Program, Medical College of Wisconsin, Milwaukee, WI, USA; Department of Radiology, Medical College of Wisconsin, Milwaukee, WI, USA
Pete S. LaViolette, Translational Brain Tumor Research Program, Medical College of Wisconsin, Milwaukee, WI, USA; Department of Biophysics, Medical College of Wisconsin, Milwaukee, WI, USA
Jennifer M. Connelly, Translational Brain Tumor Research Program, Medical College of Wisconsin, Milwaukee, WI, USA; Department of Neurology, Medical College of Wisconsin, Milwaukee, WI, USA
Wade M. Mueller, Translational Brain Tumor Research Program, Medical College of Wisconsin, Milwaukee, WI, USA; Department of Neurosurgery, Medical College of Wisconsin, Milwaukee, WI, USA
Kathleen M. Schmainda, Translational Brain Tumor Research Program, Medical College of Wisconsin, Milwaukee, WI, USA; Department of Radiology, Medical College of Wisconsin, Milwaukee, WI, USA; Department of Biophysics, Medical College of Wisconsin, Milwaukee, WI, USA
References
- 1.Nghiemphu PL, Liu W, Lee Y, Than T, Graham C, Lai A, Green RM, Pope WB, Liau LM, Mischel PS, Nelson SF, Elashoff R, Cloughesy TF. Bevacizumab and chemotherapy for recurrent glioblastoma: a single-institution experience. Neurology. 2009;72:1217–1222. doi: 10.1212/01.wnl.0000345668.03039.90. [DOI] [PMC free article] [PubMed] [Google Scholar]
- 2.Vredenburgh JJ, Desjardins A, Herndon JE, Dowell JM, Reardon DA, Quinn JA, Rich JN, Sathornsumetee S, Gururangan S, Wagner M, Bigner DD, Friedman AH, Friedman HS. Phase II trial of bevacizumab and irinotecan in recurrent malignant glioma. Clin Cancer Res. 2007;13:1253–1259. doi: 10.1158/1078-0432.CCR-06-2309. [DOI] [PubMed] [Google Scholar]
- 3.Iwamoto FM, Abrey LE, Beal K, Gutin PH, Rosenblum ML, Reuter VE, DeAngelis LM, Lassman AB. Patterns of relapse and prognosis after bevacizumab failure in recurrent glioblastoma. Neurology. 2009;73:1200–1206. doi: 10.1212/WNL.0b013e3181bc0184. [DOI] [PMC free article] [PubMed] [Google Scholar]
- 4.Norden AD, Young GS, Setayesh K, Muzikansky A, Klufas R, Ross GL, Ciampa AS, Ebbeling LG, Levy B, Drappatz J, Kesari S, Wen PY. Bevacizumab for recurrent malignant gliomas: efficacy, toxicity, and patterns of recurrence. Neurology. 2008;70:779–787. doi: 10.1212/01.wnl.0000304121.57857.38. [DOI] [PubMed] [Google Scholar]
- 5.Sugahara T, Korogi Y, Kochi M, Ikushima I, Shigematu Y, Hirai T, Okudo T, Liang L, Ge Y, Komohara Y, Ushio Y, Takahashi M. Usefulness of diffusion-weighted MRI with echo-planar technique in the evaluation of cellularity in gliomas. J Magn Reson Imaging. 1999;9:53–60. doi: 10.1002/(sici)1522-2586(199901)9:1<53::aid-jmri7>3.0.co;2-2. [DOI] [PubMed] [Google Scholar]
- 6.Lyng H, Haraldseth O, Rofstad EK. Measurements of cell density and necrotic fraction in human melanoma xenografts by diffusion weighted magnetic resonance imaging. Magn Reson Med. 2000;43:828–836. doi: 10.1002/1522-2594(200006)43:6<828::aid-mrm8>3.0.co;2-p. [DOI] [PubMed] [Google Scholar]
- 7.Chenevert TL, Stegman LD, Taylor JM, Robertson PL, Greenberg HS, Rehemtulla A, Ross BD. Diffusion magnetic resonance imaging: an early surrogate marker for therapeutic efficacy in brain tumors. J Natl Cancer Inst. 2000;92:2029–2036. doi: 10.1093/jnci/92.24.2029. [DOI] [PubMed] [Google Scholar]
- 8.Hayashida Y, Hirai T, Morishita S, Kitajima M, Murakami R, Korogi Y, Makino K, Nakamura H, Ikushima I, Yamura M, Kochi M, Kuratsu JI, Yamashita Y. Diffusion-weighted imaging of metastatic brain tumors: comparison with histologic type and tumor cellularity. AJNR Am J Neuroradiol. 2006;27:1419–1425. [PMC free article] [PubMed] [Google Scholar]
- 9.Manenti G, Di Roma M, Mancino S, Bartolucci DA, Palmieri G, Mastrangeli R, Miano R, Squillaci E, Simonetti G. Malignant renal neoplasms: correlation between ADC values and cellularity in diffusion weighted magnetic resonance imaging at 3 T. Radiol Med. 2008;113:199–213. doi: 10.1007/s11547-008-0246-9. [DOI] [PubMed] [Google Scholar]
- 10.Gauvain KM, McKinstry RC, Mukherjee P, Perry A, Neil JJ, Kaufman BA, Hayashi RJ. Evaluating pediatric brain tumor cellularity with diffusion-tensor imaging. AJR Am J Roentgenol. 2001;177:449–454. doi: 10.2214/ajr.177.2.1770449. [DOI] [PubMed] [Google Scholar]
- 11.Kinoshita M, Hashimoto N, Goto T, Kagawa N, Kishima H, Izumoto S, Tanaka H, Fujita N, Yoshimine T. Fractional anisotropy and tumor cell density of the tumor core show positive correlation in diffusion tensor magnetic resonance imaging of malignant tumors. Neuroimage. 2008;43:29–35. doi: 10.1016/j.neuroimage.2008.06.041. [DOI] [PubMed] [Google Scholar]
- 12.Kono K, Inoue Y, Nakayama K, Shakudo M, Morino M, Ohata K, Wakasa K, Yamada R. The role of diffusion-weighted imaging in patients with brain tumors. AJNR Am J Neuroradiol. 2001;22:1081–1088. [PMC free article] [PubMed] [Google Scholar]
- 13.Chenevert TL, McKeever PE, Ross BD. Monitoring early response of experimental brain tumors to therapy using diffusion magnetic resonance imaging. Clin Cancer Res. 1997;3:1457–1466. [PubMed] [Google Scholar]
- 14.Moffat BA, Chenevert TL, Lawrence TS, Meyer CR, Johnson TD, Dong Q, Tsien CI, Mukherji S, Quint DJ, Gebarski SS, Robertson PL, Junck L, Rehemtulla A, Ross BD. Functional diffusion map: a noninvasive MRI biomarker for early stratification of clinical brain tumor response. Proc Natl Acad Sci USA. 2005;102:5524–5529. doi: 10.1073/pnas.0501532102. [DOI] [PMC free article] [PubMed] [Google Scholar]
- 15.Moffat BA, Chenevert TL, Meyer CR, McKeever PE, Hall DE, Hoff BA, Johnson TD, Rehemtulla A, Ross BD. The functional diffusion map: an imaging biomarker for the early prediction of cancer treatment outcome. Neoplasia. 2006;8:259–267. doi: 10.1593/neo.05844. [DOI] [PMC free article] [PubMed] [Google Scholar]
- 16.Hamstra DA, Chenevert TL, Moffat BA, Johnson TD, Meyer CR, Mukherji S, Quint DJ, Gebarski SS, Fan X, Tsien CI, Lawrence TS, Junck L, Rehemtulla A, Ross BD. Evaluation of the functional diffusion map as an early biomarker of time-to-progression and overall survival in high-grade glioma. Proc Natl Acad Sci USA. 2005;102:16759–16764. doi: 10.1073/pnas.0508347102. [DOI] [PMC free article] [PubMed] [Google Scholar]
- 17.Hamstra DA, Galbán CJ, Meyer CR, Johnson TD, Sundgren PC, Tsien CI, Lawrence TS, Junck L, Ross DJ, Rehemtulla A, Ross BD, Chenevert TL. Functional diffusion map as an early imaging biomarker for high-grade glioma: correlation with conventional radiologic response and overall survival. J Clin Oncol. 2008;26:3387–3394. doi: 10.1200/JCO.2007.15.2363. [DOI] [PMC free article] [PubMed] [Google Scholar]
- 18.Scott JN, Brasher PM, Sevick RJ, Rewcastle NB, Forsyth PA. How often are nonenhancing supratentorial gliomas malignant? A population study. Neurology. 2002;59:947–949. doi: 10.1212/wnl.59.6.947. [DOI] [PubMed] [Google Scholar]
- 19.Barker FG, II, Chang SM, Huhn SL, Davis RL, Gutin PH, McDDermott MW, Wilson CB, Prados MD. Age and the risk of anaplasia in magnetic resonance-nonenhancing supratentorial cerebral tumors. Cancer. 1997;80:936–941. [PubMed] [Google Scholar]
- 20.Ginsberg LE, Fuller GN, Hashmi M, Leeds NE, Schomer DF. The significance of lack of MR contrast enhancement of supratentorial brain tumors in adults: histopathological evaluation of a series. Surg Neurol. 1998;49:436–440. doi: 10.1016/s0090-3019(97)00360-1. [DOI] [PubMed] [Google Scholar]
- 21.Galloway RLJ, Maciunas RJ, Failinger AL. Factors affecting perceived tumor volumes in magnetic resonance imaging. Ann Biomed Eng. 1993;21:367–375. doi: 10.1007/BF02368629. [DOI] [PubMed] [Google Scholar]
- 22.Anderson C, Astrup J, Gyldensted C. Quantification of peritumoural oedema and the effect of steroids using NMR-relaxation time imaging and blood-brain barrier analysis. Acta Neurochir Suppl (Wien) 1994;60:413–415. doi: 10.1007/978-3-7091-9334-1_112. [DOI] [PubMed] [Google Scholar]
- 23.Zaki HS, Jenkinson MD, Du Plessis DG, Smith T, Rainov NG. Vanishing contrast enhancement in malignant glioma after corticosteroid treatment. Acta Neurochir (Wien) 2004;146:841–845. doi: 10.1007/s00701-004-0282-8. [DOI] [PubMed] [Google Scholar]
- 24.Zuniga RM, Torcuator R, Jain R, Anderson J, Doyle T, Ellika S, Schultz L, Mikkelsen T. Efficacy, safety and patterns of response and recurrence in patients with recurrent high-grade gliomas treated with bevacizumab plus irinotecan. J Neurooncol. 2009;91:329–335. doi: 10.1007/s11060-008-9718-y. [DOI] [PubMed] [Google Scholar]
- 25.Brant-Zawadski M, Norman D, Newton TH. Magnetic resonance imaging of the brain: the optimal screening technique. Radiology. 1984;152:71–77. doi: 10.1148/radiology.152.1.6729138. [DOI] [PubMed] [Google Scholar]
- 26.Byrne TN. Imaging of gliomas. Semin Oncol. 1994;21:162–171. [PubMed] [Google Scholar]
- 27.Husstedt HW, Sickert M, Köstler H, Haubitz B, Becker H. Diagnostic value of the fast-FLAIR sequence in MR imaging of intracranial tumors. Eur Radiol. 2000;10:745–752. doi: 10.1007/s003300050997. [DOI] [PubMed] [Google Scholar]
- 28.Tsuchiya K, Mizutani Y, Hachiya J. Preliminary evaluation of fluid-attenuated inversion-recovery MR in the diagnosis of intracranial tumors. AJNR Am J Neuroradiol. 1996;17:1081–1086. [PMC free article] [PubMed] [Google Scholar]
- 29.Essig M, Hawighorst H, Schoenberg SO, Engenhart-Cabillic R, Fuss M, Debus J, Zuna I, Knopp MV, van Kaick G. Fast fluid-attenuated inversion-recovery (FLAIR) MRI in the assessment of intraaxial brain tumors. J Magn Reson Imaging. 1998;8:789–798. doi: 10.1002/jmri.1880080407. [DOI] [PubMed] [Google Scholar]
- 30.Ellingson BM, Malkin MG, Rand SD, Hoyt A, Connelly J, Bedekar DP, Kurpad SN, Schmainda KM. Comparison of cytotoxic and anti-angiogenic treatment responses using functional diffusion maps in FLAIR abnormal regions. Proc Intl Soc Mag Reson Med. 2009;17:1010. [Google Scholar]
- 31.Ellingson BM, Malkin MG, Rand SD, Bedekar DP, Schmainda KM. Functional diffusion maps applied to FLAIR abnormal areas are valuable for the clinical monitoring of recurrent brain tumors. Proc Intl Soc Mag Reson Med. 2009;17:285. [Google Scholar]
- 32.Ellingson BM, Rand SD, Malkin MG, Schmainda KM. Utility of functional diffusion maps to monitor a patient diagnosed with gliomatosis cerebri. J Neurooncol. 2010;97:419–423. doi: 10.1007/s11060-009-0018-y. [DOI] [PMC free article] [PubMed] [Google Scholar]
- 33.Cox RW, Jesmanowicz A. Real-time 3D image registration for functional MRI. Magn Reson Med. 1999;42:1014–1018. doi: 10.1002/(sici)1522-2594(199912)42:6<1014::aid-mrm4>3.0.co;2-f. [DOI] [PubMed] [Google Scholar]
- 34.Ellingson BM, Malkin MG, Rand SD, Connelly JM, Quinsey C, LaViolette PS, Bedekar DP, Schmainda KM. Validation of functional diffusion maps (fDMs) as a biomarker for human glioma cellularity. J Magn Reson Imaging. 2010;31:538–548. doi: 10.1002/jmri.22068. [DOI] [PMC free article] [PubMed] [Google Scholar]
- 35.Karnofsky DA, Burchenal JH. The clinical evaluation of chemotherapeutic agents in cancer. In: MacLeod CM, editor. Evaluation of chemotherapeutic agents. Columbia University Press; New York: 1949. pp. 191–205. [Google Scholar]
- 36.Mor V, Laliberte L, Morris JN, Wiemann M. The Karnofsky performance scale: an examination of its reliability and validity in a research setting. Cancer. 1984;53:2002–2007. doi: 10.1002/1097-0142(19840501)53:9<2002::aid-cncr2820530933>3.0.co;2-w. [DOI] [PubMed] [Google Scholar]
- 37.Macdonald DR, Cascino TL, Schold SC, Jr, Cairncross JG. Response criteria for phase II studies of supratentorial malignant glioma. J Clin Oncol. 1990;8:1277–1280. doi: 10.1200/JCO.1990.8.7.1277. [DOI] [PubMed] [Google Scholar]
- 38.Pope WB, Kim HJ, Huo J, Alger J, Brown MS, Gjertson D, Sai V, Young JR, Tekchandani L, Cloughesy TF, Mischel PS, Lai A, Nghiemphu PL, Rahmanuddin S, Goldin J. Recurrent glioblastoma multiforme: ADC histogram analysis predicts response to bevacizumab treatment. Radiology. 2009;252:182–189. doi: 10.1148/radiol.2521081534. [DOI] [PubMed] [Google Scholar]
- 39.Ardekani BA, Guckemus S, Bachman A, Hoptman MJ, Wojtasek M, Nierenberg J. Quantitative comparison of algorithms for inter-subject registration of 3D volumetric brain MRI scans. J Neurosci Methods. 2005;142:67–76. doi: 10.1016/j.jneumeth.2004.07.014. [DOI] [PubMed] [Google Scholar]
- 40.Padhani AR, Liu G, Mu-Koh D, Chenevert TL, Thoeny HC, Takahara T, Dzik-Jurasz A, Ross BD, Van Cauteren M, Collins D, Hammoud DA, Rustin GJS, Taouli B, Choyke PL. Diffusion-weighted magnetic resonance imaging as a cancer biomarker: consensus and recommendations. Neoplasia. 2009;11:102–125. doi: 10.1593/neo.81328. [DOI] [PMC free article] [PubMed] [Google Scholar]