Abstract
Optoacoustic Tomography (OAT) is a hybrid imaging modality that combines the advantages of optical and ultrasound imaging. Most existing reconstruction algorithms for OAT assume that the ultrasound transducers employed to record the measurement data are point-like. When transducers with large detecting areas and/or compact measurement geometries are utilized, this assumption can result in conspicuous image blurring and distortions in the reconstructed images. In this work, a new OAT imaging model that incorporates the spatial and temporal responses of an ultrasound transducer is introduced. A discrete form of the imaging model is implemented and its numerical properties are investigated. We demonstrate that use of the imaging model in an iterative reconstruction method can improve the spatial resolution of the optoacoustic images as compared to those reconstructed assuming point-like ultrasound transducers.
Keywords: Optoacoustic tomography, photoacoustic tomography, thermoacoustic tomography
I. Introduction
Optoacoustic tomography (OAT), also known as photoacoustic computed tomography (PCT), is a rapidly emerging imaging modality that has great potential for a wide range of biomedical imaging applications [1], [2]. OAT is a hybrid imaging method that exploits the high optical contrast of blood-rich structures and the high spatial resolution of ultrasonic imaging. An image reconstruction algorithm is utilized in OAT to to form an estimate of an object's spatially variant absorbed optical energy density from measurements of pressure wavefields that are induced via the thermoacoustic effect [1]–[3].
A variety of analytical [4]–[7] and iterative [8]–[11] OAT image reconstruction algorithms have been developed. Many of these algorithms are based on a spherical Radon transform imaging model and assume that point-like ultrasonic transducers are employed for data-acquisition. This assumption is appropriate when the size of the transducer's detecting surface is sufficiently small and/or the object-to-transducer distance is sufficiently large. However, the use of small transducers and/or large scanning distances is undesirable because the signal-to-noise ratio of the recorded optoacoustic signals will be degraded [12]. When the characteristics of the transducer are not accounted for in the image reconstruction algorithm, the spatial resolution of the resulting images can be significantly degraded and image distortions can be present.
An ultrasonic transducer in receive-mode is characterized by its acousto-electric impulse response and spatial impulse response [13], [14]. Their effects on the spatial resolution of the reconstructed images in OAT have been studied previously [15]–[18]. The explicit nature of the spatial resolution degradation depends on the measurement geometry, but it is generally spatially variant and, therefore, not modeled as a linear shift-invariant system. Several data-space deconvolution procedures have been proposed [7], [19] for mitigating the effects of the transducer response on the OAT measurement data. A discrete imaging model that took account of the transducer properties was proposed in the Ref. [19]. However, specific details about how the object and spatial impulse response were not provided.
It is worth noting that several groups have proposed alternative ultrasound transducer technologies to circumvent the need to numerically compensate for transducer effects in the reconstruction algorithm. For example, virtual point detectors have been investigated [12], [20], [21]. Integrating ultrasound detectors [22], [23] are also being actively explored. Despite these efforts, the majority of current OAT implementations utilize conventional piezoelectric ultrasonic transducer technologies. The use of conventional ultrasound transducers also facilitates hybrid ultrasound-OAT imaging in which the same transducer is utilized for both the traditional ultrasound imaging and for the OAT [24]–[27].
In this work, a general OAT imaging model that incorporates the physical response of an ultrasound transducer is introduced and investigated. The imaging model is presented in its continuous-to-discrete and discrete-to-discrete forms. Our primary focus is on the discrete-to-discrete model and its application to iterative image reconstruction. By use of computer-simulated and experimental OAT measurement data, we demonstrate that use of the new imaging model in an iterative reconstruction method can improve the spatial resolution of the reconstructed images as compared to those reconstructed assuming point-like ultrasound transducers. The singular value decomposition of the imaging model is computed to investigate how incorporation of the transducer responses in the imaging model will affect the numerical stability of the image reconstruction problem.
The remainder of the article is organized as follows. In Section II we briefly review a canonical OAT imaging model in its continuous form and describe the impulse response method that will be employed to numerically model the ultrasound transducer response. By use of the impulse response method, continuous-to-discrete and discrete-to-discrete OAT imaging models that incorporate the acousto-electric and OA spatial impulse responses of a non-ideal ultrasound transducer are established in Section III. Numerical studies that involve computer-simulated and experimental OAT measurement data are described in Section IV, in which an iterative image reconstruction algorithm is utilized with the new discrete-to-discrete imaging model. In Section V, we compare the spatial resolution of the reconstructed images with those reconstructed assuming point-like ultrasound transducers. The article concludes with a summary in Section VI.
II. Background
Below we provide a brief review of the salient imaging physics and describe a conventional OAT imaging model. The reader is referred to references [1], [2], [28] and [29] for comprehensive reviews of OAT.
A. Basic principles of OAT
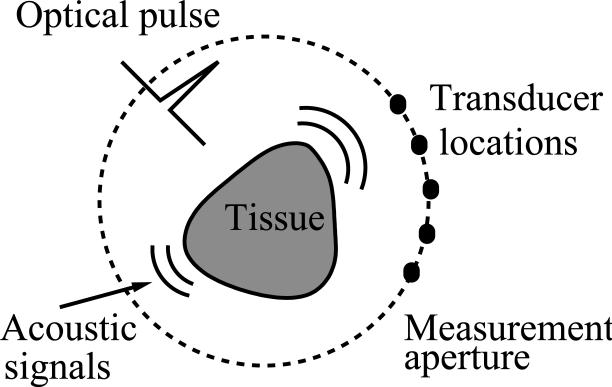
A schematic of a general OAT imaging geometry is shown in Fig. 1. A short laser pulse is employed to irradiate an object and the thermoacoustic effect results in the generation of a pressure wavefield p(r, t), where . The radiated pressure wavefield is measured by use of ultrasonic transducers located on a measurement aperture that partially or completely surrounds the object. The coordinate r0 ∈ Ω0 will denote a particular transducer location.
Fig. 1.
Schematic of a general OAT imaging geometry.
When the temporal width of the exciting laser pulse is sufficiently short, the generation of photoacoustic wavefields in a lossless medium is described by the photoacoustic wave equation [29]
| (1) |
where ∇2 is the 3D Laplacian operator, I(t) describes the normalized temporal profile of the illuminating pulse, and β, c, and Cp denote the thermal coefficient of volume expansion, speed-of-sound, and the specific heat capacity of the medium at constant pressure, respectively. The absorbed optical energy density A(r), which represents the sought after quantity in OAT, is determined by the optical absorption properties of the object as well as variations in the fluence of the illuminating optical radiation within the tissue.
When the object possesses homogeneous acoustic properties that match those of a background medium, acoustic attenuation is neglected, and the assumption of acoustic stress confinement is justified [28] (I(t) ≈ δ(t) where δ(t) is the Dirac delta function), the pressure wavefield p(r0, t) recorded by use of an ideal point-detector at location r0 can be expressed [28] as a solution to Eqn. (1) as
| (2) |
where
| (3) |
Here represents the OAT imaging operator viewed as a continuous-to-continuous mapping, c0 denotes the (constant) speed-of-sound in the object and background medium, and V denotes the object's support volume. Note that hideal(r0, r, t) represents the point response function [30] of the imaging system when perfect point-like ultrasound transducers are assumed.
Equation (2) represents an idealized imaging model for OAT in its continuous form. The associated image reconstruction problem is to determine an estimate of A(r) from knowledge of p(r0, t) with r0 ∈ Ω0. A variety of analytical reconstruction algorithms have been developed for inversion of Eqn. (2) [5], [6], [31]. However, because they neglect the response characteristics of the transducers, as well as finite-sampling effects, they can sometimes produce significant image blurring and distortions in the reconstructed images. In Section III we describe generalized OAT imaging model that explicitly addresses these issues and facilitates accurate iterative image reconstruction.
B. The impulse response method for characterizing transducer behavior
The impulse response method [14], [32], [33] that we will utilize to incorporate the response of an ultrasound transducer in our imaging models is reviewed briefly in this section. It treats the ultrasound transducer as a linear acoustic system, and can predict the voltage signal produced by a transducer in response to acoustic pressure present on its surface.
By use of the impulse response method, the voltage signal u(r0, t) generated by a transducer of active area SR(r0) centered at r0 can be expressed as [14]
| (4) |
where he(t) is the acousto-electric impulse response (EIR, V/Pa), and * denotes a one-dimensional (1D) temporal convolution. For a point acoustic source located at r, it was demonstrated [14], [34] that the surface integral in Eqn. (4) can be expressed in the form of the 1D temporal convolution
| (5) |
where is the optoacoustic (OA) spatial impulse response (SIR). Thus, the response of an ultrasound transducer in receive-mode can be modeled by two independent components, namely, the EIR and the SIR [13], [32], [33]. The EIR models the electrical response of the transducer while the SIR accounts for the averaging effect over the transducer's active area. Note that the SIR describes the ansiotropic detection sensitivity of the transducer that arises from its finite detecting surface [35].
The voltage signal produce by an ultrasonic transducer centered at location r0 that arises from a photoacoustic point emitter at location r can be expressed as
| (6) |
As described by Eqn. (3), hideal(r0, r, t) represents the photoacoustic wavefield that is produced by a point absorber at location r at time t = 0 and recorded by an ideal point-like transducer at location r0 and time t > 0.
III. Discrete OAT Imaging Models that Incorporate Transducer Response
In practice, u(r0, t) is discretized temporally and determined only at a finite number of receiver locations r0. The vector will represent a lexicographically ordered representation of the sampled voltage data, where the dimension M is defined by the product of the number of temporal samples (S) acquired at each transducer location and the number of transducer locations (Q). We will use [u]m to denote the m-th element of vector u.
A. Continuous-to-discrete imaging model
An OAT imaging system is appropriately described by a continuous-to-discrete (C-D) imaging operator that maps A(r) to the recorded data u. The operator can be interpreted as a discretization operator acting on a continuous-to-continuous mapping [30]:
| (7) |
The operator characterizes the temporal and spatial sampling characteristics of the ultrasonic transducer and is defined as
| (8) |
where q = 0, 1, . . . , Q – 1 is the index that specifies the q-th transducer location r0,q on the measurement aperture Ω0 and s = 0, 1, . . . , S – 1 is the index of the time sample. The functions σq(r0) and τs(t0) characterize, as described below, the spatial and temporal sampling apertures of the transducer.
The temporal sampling aperture τs(t) is related to the EIR he(t) as
| (9) |
where ΔT is the temporal sampling interval. If the transducer surface is assumed flat, so no re-radiation from scattering and reflection take place, the spatial sampling aperture can be expressed as
| (10) |
where Sq denotes the active area of the q-th transducer surface. It can be shown [13] that the surface integral in Eqn. (8) can be expressed in terms of the SIR as
| (11) |
On substitution from Eqn. (11) into Eqn. (8), a C-D imaging model that accounts for the transducer response can be expressed as
| (12) |
with
| (13) |
In the case of an ideal point-like transducer, he(t) = δ(t) and hs(r0,q, r, t) = δ(t), and Eqn. (8) reduces to
| (14) |
where p(r0, t) is specified by Eqn. (2).
B. Discrete-to-discrete imaging model
In order to utilize conventional iterative image reconstruction algorithms, a discrete-to-discrete (D-D) imaging model, i.e., system matrix, is required. In this section, we describe a D-D imaging model that is obtained as an approximation of the C-D imaging model in Eqn. (12).
To derive a D-D imaging model from Eqn. (12), a finite-dimensional approximate representation of A(r) is required. A general linear form for this approximation is given by
| (15) |
where the subscript a indicates that Aa(r) is an approximation of A(r), [θ]n is the n-th component of the coefficient vector θ, and are expansion functions. In this work, uniform spherical expansion functions [36] will be utilized that are defined as
| (16) |
where rn = (xn, yn, zn)T specifies the coordinate of the n-th grid point of a uniform Cartesian lattice and ε is the half spacing between lattice points. Because the photoacoustic wavefield produced by a uniform spherical absorber can be calculated analytically [37], [38], defining the expansion functions in this way will facilitate construction of the system matrix. The coefficient vector θ will be defined as
| (17) |
where Vcube and Vvoxel are the volumes of a cubic voxel of dimension 2ε and ϕn(r), respectively.
To establish a D-D imaging model, we will also require a finite-dimensional representation of the SIR that, for a fixed transducer location r0,q, can be viewed as a function of r. By use of the expansion functions ϕn(r), an approximate representation of the SIR will be constructed as
| (18) |
with
| (19) |
where is a set of expansion functions. Substitution of Eqns. (15) and (18) into Eqns. (12) and (13), respectively, yields a D-D imaging model
| (20) |
where the system matrix H is of dimension M × N whose elements are given by
| (21) |
with
| (22) |
and Rq,n = |r0,q – rn|. Physically, Eqn. (22) describes the pressure wavefield produced in the case where the absorbed energy density corresponds to the expansion function ϕn(r). Because ϕn(r) is a uniform sphere, the resulting pressure wavefield possesses an ’N’-shaped temporal profile [37], [38].
IV. Descriptions of numerical studies
Numerical studies that employed computer-simulated and experimental OAT measurement data were conducted, as described below, to investigate the use of the proposed D-D imaging model for image reconstruction.
A. Implementation of the system matrix
The EIR is determined by the physical properties of the ultrasonic transducer and is usually determined by experiment. In this study, we employed a specific EIR that was measured as described in Ref. [39]. A variety of SIR models have been proposed [13], [32], [33] and utilized in studies of OAT [14], [34]. In our numerical studies, we adopted the SIR model described in Ref. [14] that, for a square transducer of dimension a, is specified as
| (23) |
with
| (24a) |
| (24b) |
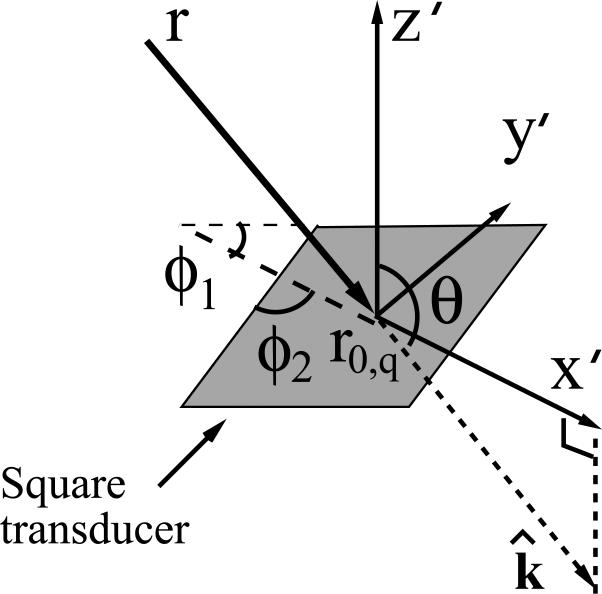
where θ and ϕ were functions of r and r0,q. As indicated in Fig. 2, for each pair of locations r and r0,q, we defined a local coordinate system whose origin o′ was located at r0,q and z′-axis was normal to the transducer plane. The direction of the incident wavefield k̂ was defined as
| (25) |
Its projection on the transducer plane was chosen as the x′-axis. The angle θ was the angle between k̂ and z′-axis and ϕ = min(ϕ1, ϕ2), where ϕ1 and ϕ2 were the two angles between x′-axis and the transducer's two edges. In our implementation we employed χn(r) = δ(r – rn) in Eqn. (19), and therefore .
Fig. 2.
Illustration of the dependence of two incident angles θ (elevation) and ϕ (azimuth) on the locations of the optoacoustic source r and the transducer r0,q. The transducer possesses a flat square detecting surface.
To obtain the system matrix H, in principle, we need to implement the two continuous convolutions in Eqn. (21). However, only discrete samples of he(t) are available in practice. Also, the quantity is broadband in temporal frequency space, which may result in strong aliasing if direct temporal sampling was applied. Consequently, an anti-aliasing filter was applied to ln(r0,q, t) and the first convolution operation in Eqn. (21) was approximated by a discrete convolution as
| (26) |
where is a discrete approximation of ln(r0,q, t). Additional details regarding implementation of the system matrix are provided in the Appendix.
To investigate the effects of EIR and SIR seperately, in the following discussion, we denote the comprehensive system matrix by H while He, Hs and H0 represent system matrices with hs(r0,q, r, t) = δ(t), he(t) = δ(t), and he(t) = hs(r0,q, r, t) = δ(t), respectively.
B. Eigenanalysis of the system matrix
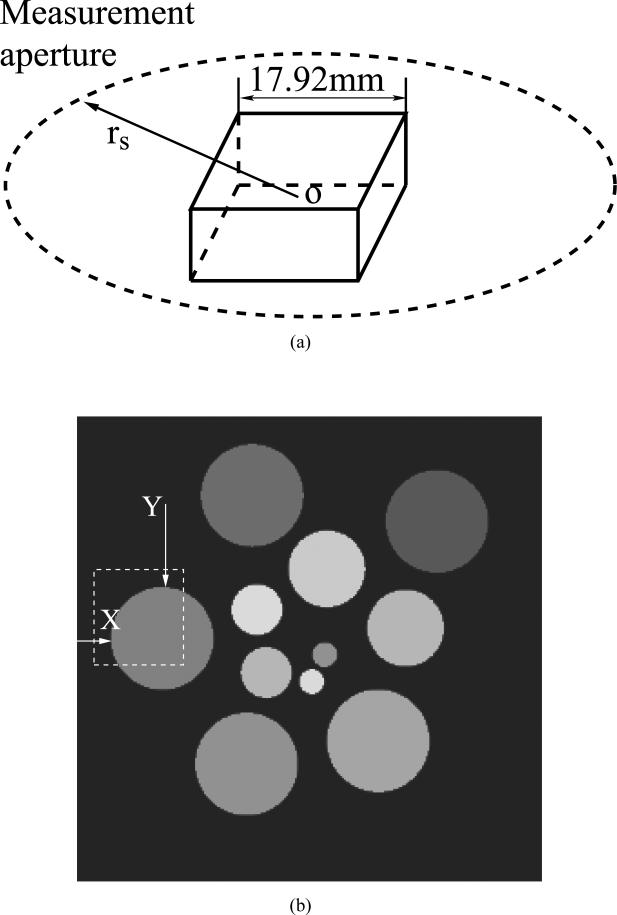
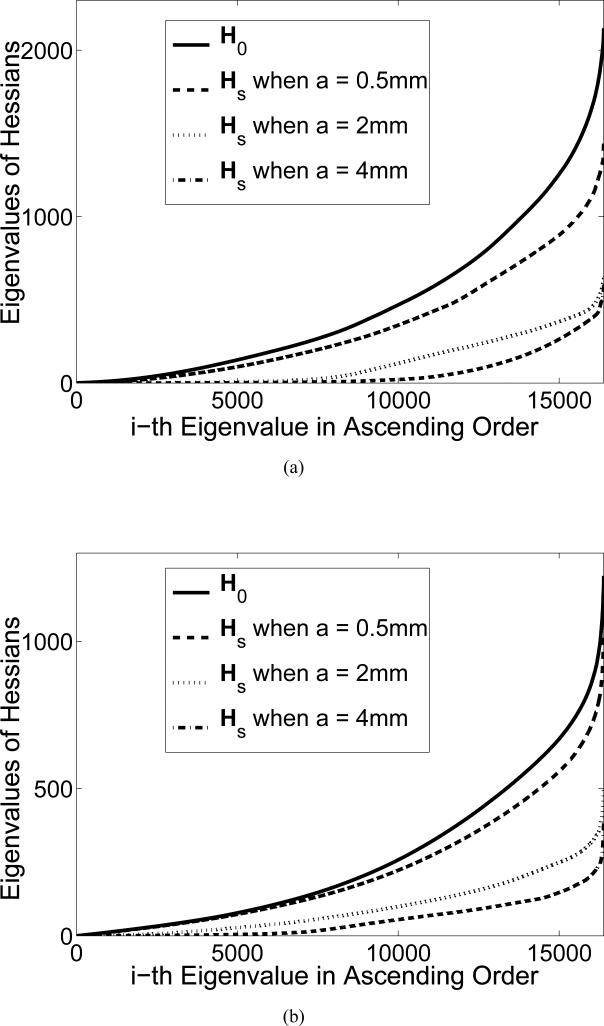
To investigate how incorporation of the transducer SIR in the imaging model will affect the numerical stability of the image reconstruction problem, we computed the eigenspectrum of the Hessian matrix . We considered an imaging geometry consisting of 90 square ultrasonic transducers of dimension a that were uniformly distributed on a ring of radius rS. This geometry is depicted in in Fig. 3-(a), and was utilized to image thin 3D objects in the studies described below. We numerically computed the eigenvalues of the Hessian for different transducer dimensions a = 0.5, 2, and 4 mm and scanning radii rS = 25 mm and rS = 50 mm, respectively. For comparison, we also computed the eigenvalues of the Hessian for the ideal case when he(t) = hs(r0,q, r, t) = δ(t), whose system matrix and Hessian are denoted by H0 and , respectively.
Fig. 3.
The acousto-electrical impulse response of the ultrasonic transducer.
C. Computer-simulation studies and reconstruction algorithm
Computer-simulated measurement data
The 3D numerical phantom shown in Fig. 3 was taken to represent the object function A(r). Its support volume was 17.92 × 17.92 × 0.07 mm3 and was represented by 512 × 512 × 2 non-overlapping spherical voxels of radii 0.0175 mm. From this discrete representation of A(r), the noiseless data ua were calculated numerically by use of Eqn. (20) at Q = 360 equally spaced transducer locations over the interval [0, 2π) on the 2D measurement geometry shown in Fig. 3-(a). The scanning radius was 25 mm. At each transducer location, S = 512 equally spaced temporal values of the voltage signal over the interval [8, 25) μs were computed. Each transducer had a flat detecting area of dimension 4 × 4 mm2 and the speed of sound was described by a constant value c0 = 1.521 mm/μs. The pressure data were generated by use of H whose he(t) was measured experimentally [14], [39] and is displayed in Fig. 4.
Fig. 4.
(a) The scanning geometry employed in the computer-simulation studies. (b) The central horizonal slice through the numerical phantom.
Although the image reconstruction studies described below will employ a different voxel size in the assumed object representation than that employed to generate the measurement data, it should be noted that these computer-simulation studies do not comprehensively assess the impact of modeling errors associated with approximating a C-D imaging model with a D-D one. However, these computer-simulation studies do serve to demonstrate the potential improvement in spatial resolution that can be achieved by incorporation of the transducer response in the imaging model. Also, as described below, these studies will assess the statistical properties of images reconstructed by use of a particular iterative reconstruction algorithm. Images reconstructed from experimental data will corroborate the features revealed by the computer-simulation studies and are discussed later.
Noise model
With consideration of stochastic measurement noise, the detected voltage data can be described as
| (27) |
where ñ is an additive noise vector. Here, the tilde indicates a stochastic quantity. We focus on the SIR effect and thus ua was generated by use of Hs. The noise vector was treated as an uncorrelated zero-mean Gaussian random vector with a standard deviation σn chosen according to the rule
| (28) |
where, [ua]max denotes the maximum value of all components of the noiseless ua. A total of 100 noisy versions of ũa were computed as realizations of this stochastic process.
Reconstruction algorithm
From knowledge of the noiseless and noisy simulated measurement data, images were reconstructed by inverting the D-D imaging model in Eqn. (20) by use of a penalized least-squares (PLS) image reconstruction algorithm [40]. Investigation of alternative reconstruction algorithms remains an important topic for future work. The PLS objective function is given by
| (29) |
where R(θ) is a regularizing penalty term whose impact is controlled by the regularization parameter β. In this study we employed the quadratic smoothness penalty given by
| (30) |
where is the set of eight neighbors of the n-th voxel. The system matrix H was constructed according to Eqn. (26). For the noiseless pressure data generated by H, we compared the reconstructed images obtained by use of H0, He, Hs, and H. We also investigated the SIR effects in the noisy case where he(t) = δ(t) by comparing the images reconstructed by use of Hs and H0.
In all cases, the reconstruction algorithm for implementing Eqn. (29) was based on the Fletcher Reeves version of conjugate gradient (CG) method [41]. We calculated the norm of the gradient and terminated the iteration when it was below a prechosen tolerance. We used the same tolerance in both reconstruction algorithms. The impact of the choice of β on the reconstructed images was studied by Monte Carlo simulations described in the next subsection. The reconstructed object estimates were represented by a 256 × 256 × 1 grid of non-overlapping spherical voxels of radius 0.035 mm.
D. Empirical determination of image statistics and resolution measures
As described above, for each choice of the regularization parameter β, 100 noisy images were reconstructed for the cases where the EIR effect was excluded and the system matrices Hs and H0 were employed by the reconstruction algorithm. From each collection of images, the empirical mean image and the empirical estimate of the image variance map were computed by
| (31a) |
| (31b) |
where J = 100 is the number of noisy images we reconstructed, is the reconstructed image from the j-th realization of noisy data, and n is the voxel index.
We computed the mean variance within a 90 × 90 voxel region indicated by the dashed box in Fig. 3-(b). To quantify the spatial resolution of the reconstructed image, we fitted the rising edge of a prechosen structure in the empirical mean images to a cumulative Gaussian function C(x) as [42]:
| (32) |
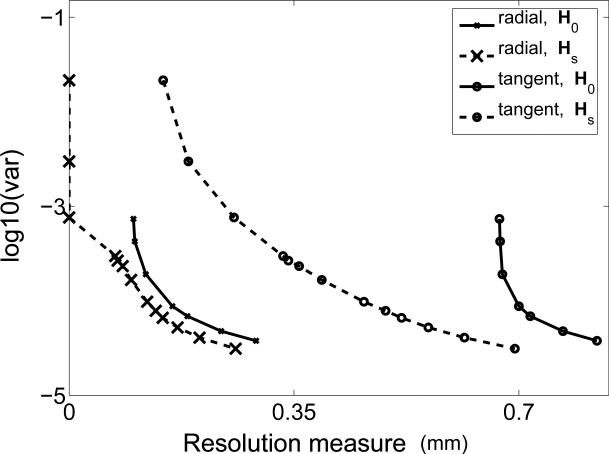
where I1 and I2 are the true intensities on the two sides of the boundary with I1 < I2, μ is the true location of the boundary, and erf(x) is the Gauss error function with the standard deviation denoted by σ The image resolution was characterized by the full width at half-maximum (FWHM) value of the fitted error function [11] as . We computed the spatial resolutions crossing the two edges marked by the arrows ’X’ and ’Y’ in Fig. 3-(b) that correspond to radial and tangent directions, respectively. The radial and tangent directions are relative to the measurement geometry that was a ring in 2D or a sphere in 3D for this study. Repeating the process for different choices of the regularization parameters β ranging from 0 to 10 produced a collection of (variance, FWHM) pairs, which were plotted to characterize the tradeoffs between spatial resolution and noise levels in the reconstructed images.
E. Experimental data
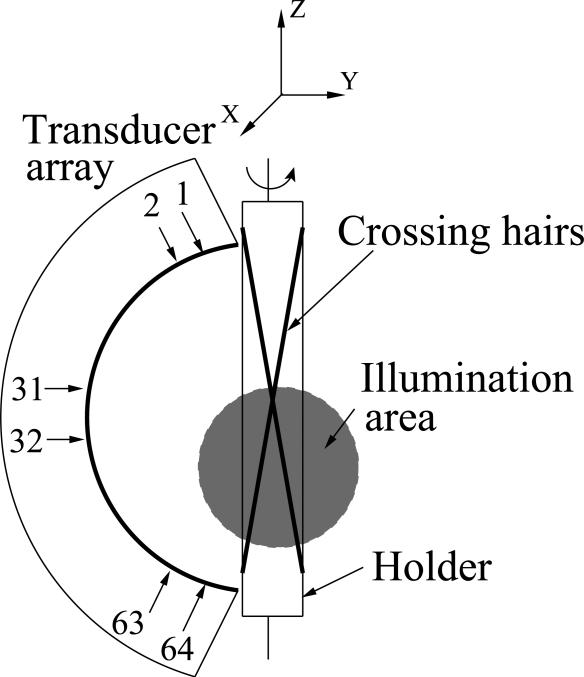
We applied the reconstruction algorithm utilizing the new system matrix H to experimental data obtained by use of an existing OAT imaging system [43], where the EIR was the same as the one employed in the simulation studies shown in Fig. 4. The measurement geometry is shown in Fig. 5. The to-be-imaged object consisted of a pair of crossing horse hairs with a thickness of 200 μm and a length of 90 mm mounted on a custom made holder. The laser pulse was of wavelength 765 nm and was delivered by a bifurcated fiber bundle to illuminate the bottom half of the object. Two light beams were expanded to a diameter of 40 mm. A curved transducer array consisting of 64 rectangular detecting elements were focused at 65 mm that approximately coincided with the intersection of the hairs. Each transducer element had a flat detecting surface of size 2 × 2 mm2. The object was rotated about the z-axis as indicated in Fig. 5, and optoacoustic pressure measurements were obtained at 72 uniformly-spaced views over a 360° interval. The time samples were obtained at 1536 instances at a sampling rate of 20 MHz. We made use of the pressure data obtained by 33 transducers indexed from 31 to 64 shown in Fig. 5 for the reconstruction. The region to-be-reconstructed was of size 13.44 × 5.6 × 41.44 mm3 and was represented by 96 × 40 × 296 voxels. Each voxel was of diameter 0.14 mm. We turned off the smoothness regularization term in Eqn. (30), i.e., β = 0, since the noise level was very low in this data set. For comparison, we reconstructed images by use of system matrices He, and H0 also. The algorithms were terminated for all imaging models after six iterations where the objective functions reduced to the same level and the images became noisier for more iterations. The reconstructed 3D image data were visualized by computing maximum intensity projection images by use of the Osirix software [44].
Fig. 5.
The scanning geometry employed in the experimental studies.
V. Numerical Results
A. Intrisic numerical properties of H
The eigenvalues of for the cases of transducer dimensions a = 0.5, 2, and 4 mm were numerically computed and plotted in Fig. 6. The eigenspectrum of , the Hessian matrix assuming an ideal point-like transducer, was also computed. Figures 6-(a) and (b) display the eigenspectra corresponding to cases where the radius of the scanning aperture was rS = 25 mm and rS = 50 mm, respectively. These plots reveal that the rate of decay of the eigenvalues of increases as the transducer size a is increased. This confirms that the image reconstruction problem becomes more ill-conditioned and is therefore more sensitive to data inconsistencies as the transducer size is increased. Similarly, by comparison of Figs. 6-(a) and (b) we observe that the rate of decay of the eigenvalues of is slower for the larger scanning aperture. This confirms that the ill-conditioning of the reconstruction problem is generally less severe for larger scanning apertures.
Fig. 6.
Eigenspectra of the Hessian matrices for the new system matrix Hs, and the system matrix assuming point-like transducer H0 for different transducer sizes a = 0.5, 2, and 4 mm. The scanning radius is (a) rS = 25mm and (b) rS = 50mm.
B. Results from noiseless simulation data
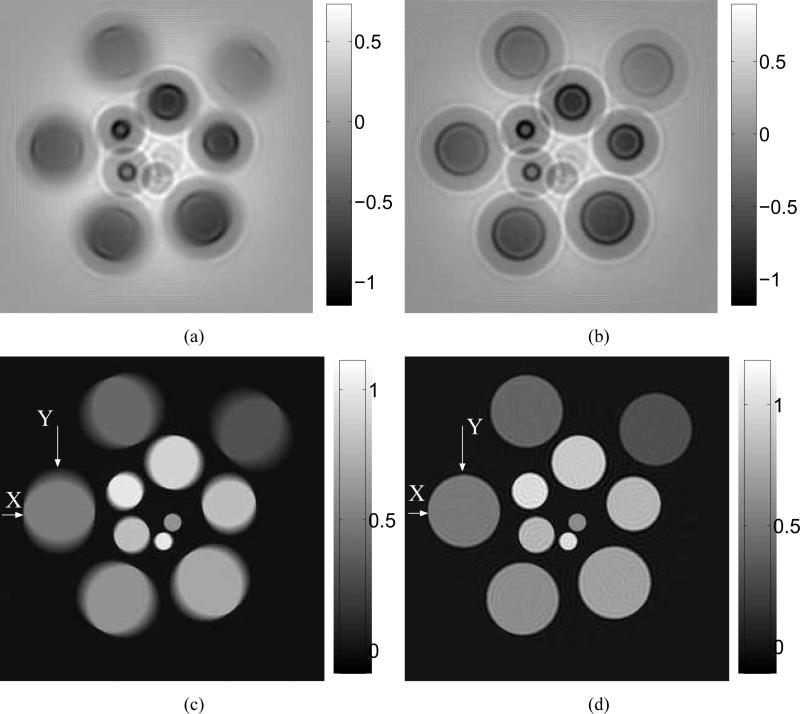
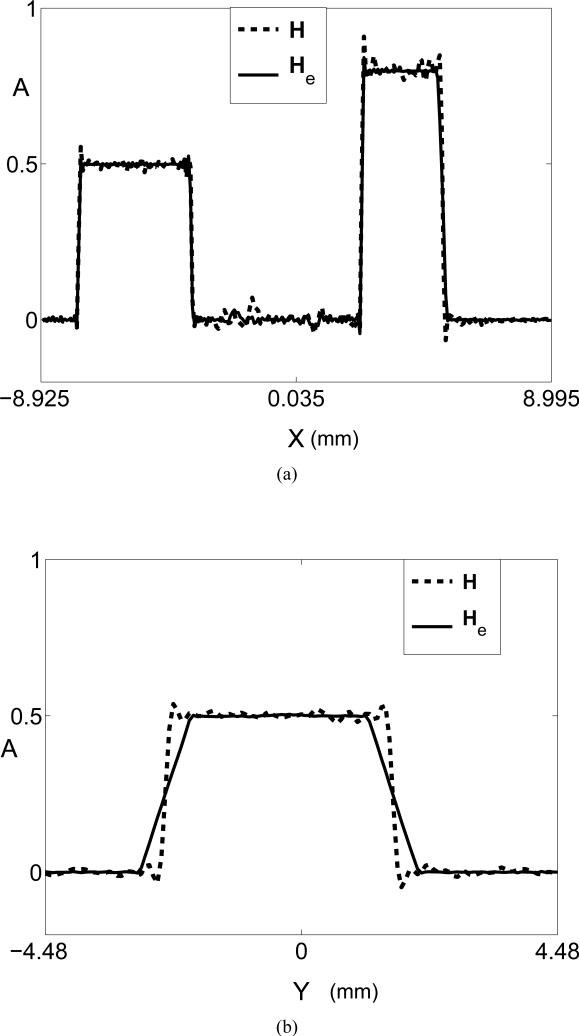
The computer-simulated noiseless data were generated by use of the system matrix H, from which the images reconstructed by use of H0, Hs, He and H are shown in Figs. 7-(a)-(d), respectively. We set the regularization parameter β = 0 for all cases. Reconstruction algorithms were started from the same uniform initial guess and terminated after 150 iterations when the norms of the objective functions’ gradients were reduced by a factor 10–5 compared to their initial values. As expected, structures within images reconstructed by use of Hs had uniformly broadened boundaries while the peripheral structures within images reconstructed by use of He had blurred boundaries along the tangent direction. The images reconstructed by use of H0 combined both degradations. By use of the new system matrix H, the reconstructed images had improved spatial resolution. Ignoring the EIR effect results in the loss of quantitative information of the reconstructed images. Figures 7-(a) and (b) contain negative values and are shown in a different gray scale from that employed in Figs. 7-(c) and (d). The profiles along the radial and tangent directions, indicated by ’X’ and ’Y’ in the images in Figs. 7-(c) and (d), are shown in Figs. 8-(a) and (b).
Fig. 7.
Images reconstructed from the noiseless data function ua by use of system matrices (a) H0, (b) Hs, (c) He, and (d) H.
Fig. 8.
(a) Radial image profiles corresponding to the use of He (solid line) and H (dashed line). The locations of the profiles are indicated by the ’X’-arrows in Figs. 7-(c) and (d), respectively. (d) Tangent image profiles corresponding to the use of He (solid line) and H (dashed line). The locations of the profiles are indicated by the ’Y’-arrows in Figs. 7-(c) and (d), respectively.
C. Results from noisy simulation data
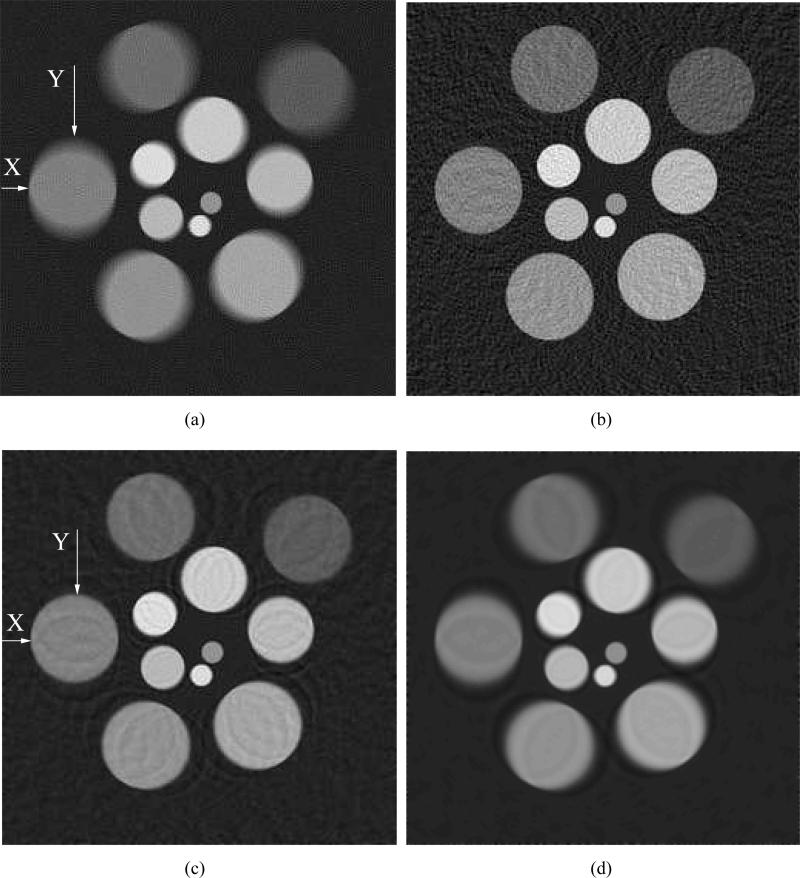
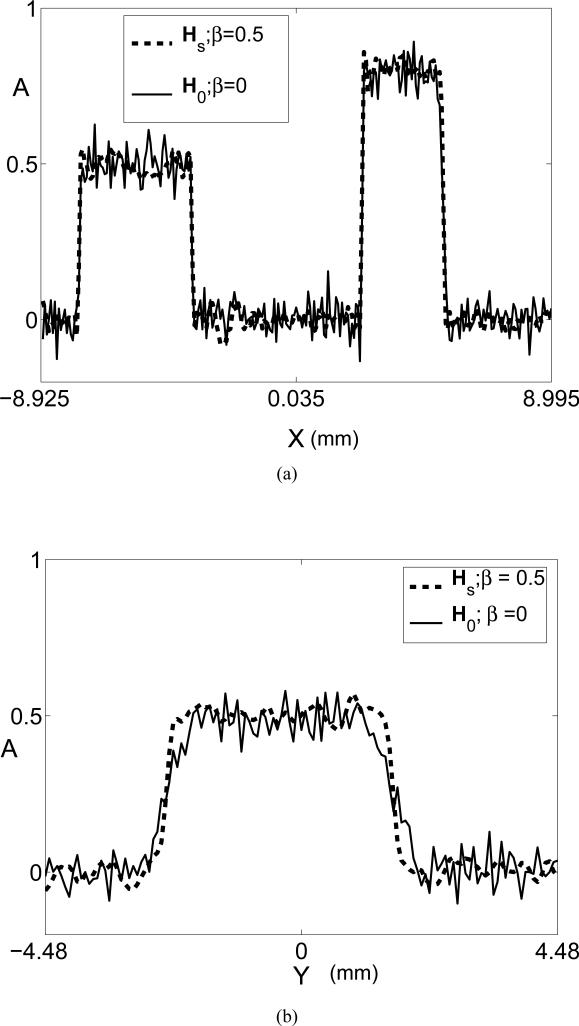
We simulated the noisy data by use of the system matrix Hs that assumed he(t) = δ(t). Figures 9-(a) and (b) display images reconstructed from noisy simulation data by use of the system matrices H0 and Hs with β = 0. The reconstruction algorithms that employed H0 and Hs were terminated at 45 and 54 iterations, respectively, which was when the residues (gradients of the objective functions) were reduced to 0.3% of their initial values. As was observed in the case of noiseless data, structures within the image reconstructed by use of H0 (Fig. 9-(a)) had blurred boundaries, due to the fact that the transducer SIR was not modeled in the system matrix H0. On the other hand, the spatial resolution of the images reconstructed by use of Hs (Fig. 9-(b)) appear to suffer much less degradation in spatial resolution. Additional images reconstructed by use of Hs with regularization parameters β = 0.5 and β = 1.0 are shown in Figs. 9-(c) and (d), respectively. As expected, increasing β resulted in a decrease in noise level at the expense of spatial resolution. The root mean square errors of the reconstructed images from the object were calculated within the region of interest marked by the dashed box in Fig. 3, which were 6.28, 7.35, 3.91, and 5.07 corresponding to the Figs. 9-(a) to (d), respectively. Radial and tangent profiles corresponding to the locations marked ’X’ and ’Y’ in Figs. 9-(a) and (c), are shown in Fig. 10.
Fig. 9.
Images reconstructed from the noisy data function ũa by use of (a) H0, β = 0, (b) Hs, β = 0, (c) Hs, β = 0.5, and (d) Hs, β = 1.0. The noisy data were degraded only by the SIR.
Fig. 10.
(a) Radial image profiles through the noisy images corresponding to the use of H0, β = 0 (solid line) and Hs, β = 0.5 (dashed line). The locations of the profiles are indicated by the ’X’-arrows in Figs. 9-(a) and (c), respectively. (b) Tangent profiles corresponding to the use of H0, β = 0 (solid line) and Hs, β = 0.5 (dashed line). The locations of the profiles are indicated by the ’Y’-arrows in Figs. 9-(a) and (c), respectively.
The curves of the average variance within the specified region-of-interest versus tangential or radial resolution measure for the reconstructed images are shown in Fig. 11. The same scanning geometry and acquisition parameters were adopted as described in Section IV-C except that we employed 90 transducers. The left-most point on each curve corresponds to β = 0. They demonstrate the impact of the regularization parameter β on the tradeoff between the spatial resolution and variance of the reconstructed images. As predicted by the eigenanalysis of the Hessian matrices, for β = 0 the reconstruction algorithm that employes Hs produces images with larger variances than those produced by the algorithm employing H0. However, the spatial resolution of the images produced by the algorithm employing Hs is superior to those produced by the algorithm employing H0. When the value of β is increased, within the common resolution region of the plot, the curves corresponding to Hs were lower everywhere than the ones corresponding to H0. This demonstrates that, when appropriate regularization is employed, an algorithm employing Hs can produce images with lower noise levels at a matched resolution than can an algorithm employing H0.
Fig. 11.
Variance vs. resolution curves corresponding to use of the system matrices Hs and H0.
D. Results from experimental data
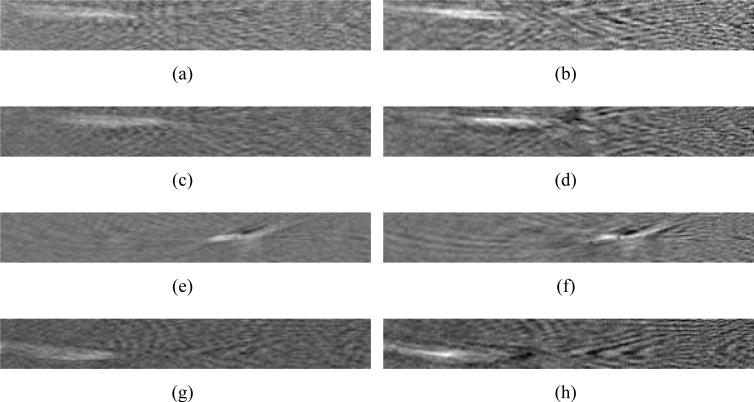
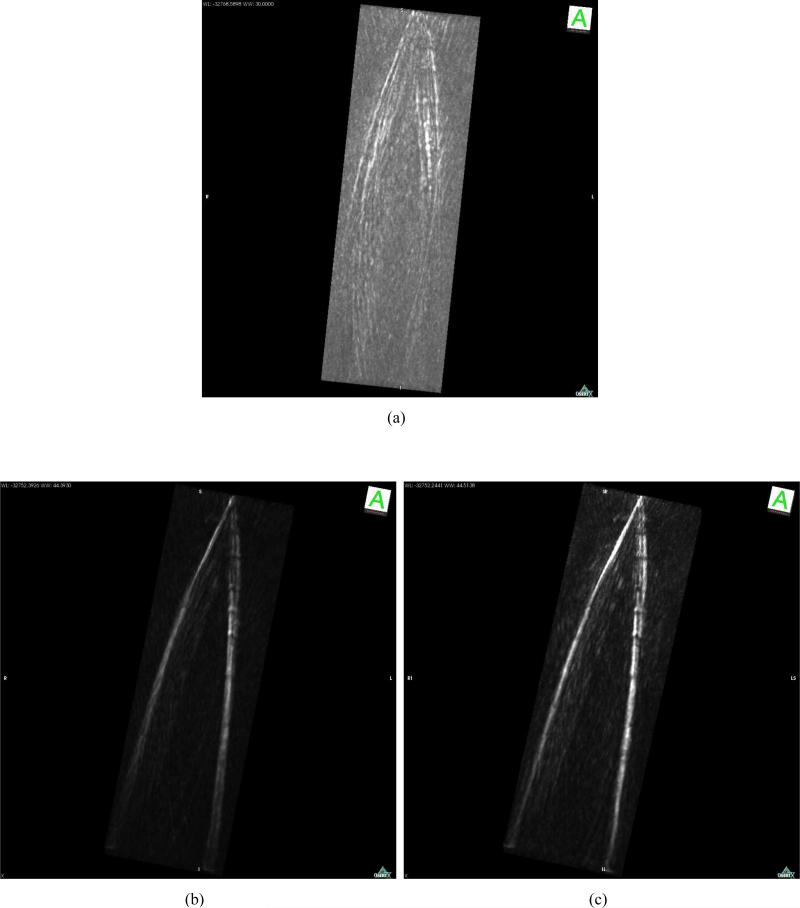
Figure 12 from top to bottom displays reconstructed images of the horse hair phantom corresponding to the planes y = –5.59 mm, y = –3.85 mm, y = –0.35 mm, and y = 2.45 mm. The two columns correspond to the use of H (left) and He (right), respectively, in the reconstruction algorithm. All images were shown in the same display window for comparison. We did not compare them with images reconstructed by use of H0 because the EIR effect distorted the quantitative values and made them uncomparable in the same grey scale. From Figs. 12-(a), (c), (e), and (g) we observed that the thickness of the reconstructed horse hairs was broadened and the intensity was faded for the parts further away from the center of measurement geometry. By use of system matrix H (see the right column), the structural information of the horse hairs on the peripheral part was preserved. This is consistent with our observations in the computer-simulation studies. Three dimensional rendered images are shown in Fig. 13. Figure 13-(a), corresponding to H0, only provided faint structural information while Figs. 13-(b) and (c), corresponding to He and H, revealed better-defined structures. Figures 13-(b) and (c) employed the same grey scale and display window. These images corrorborate our assertion that compensation for the transducer response in the imaging model can significantly improve the spatial resolution characteristics of the reconstructed image. It is likely that errors in the assumed speed of sound and/or errors in the assumed location of the center of the scanning geometry limited the achievable spatial resolution of the reconstructed images.
Fig. 12.
Slices through the 3D images reconstucted from the experimental data set. The slices are parallel to the x-o-z plane indicated in Fig. 5. The images, from top to bottom, correspond to different locations along y-axis as: (a),(b) y = –5.95 mm, (c),(d) y = –3.85 mm, (e),(f) y = –0.35 mm, and (g),(h) y = 2.45 mm. The left column of images corresponds to the use of He while the right column corresponds to the use of H.
Fig. 13.
Maximum intensity projection renderings of the experimental phantom image data reconstructed by use of (a) H0, (b) He and (c) H.
VI. Conclusion
Because they provide the opportunity for accurate image reconstruction from incomplete measurement data, iterative reconstruction algorithms for OAT are being developed actively. Iterative reconstruction algorithms permit utilization of imaging models that can accurately describe the measurement process. Despite this, many of the reported OAT image reconstruction algorithms neglect the response of the recording transducer, and relatively little effort in the OAT literature has been devoted towards developing and evaluating detailed imaging models.
In this work, we developed and evaluated an OAT imaging model that incorporates the physical response of an ultrasound transducer. This was accomplished by use of the impulse response method, which is a well-known method for modeling ultrasound transducers using linear acoustics. The imaging model was utilized in conjunction with an iterative algorithm to reconstruct images from computer-simulated and experimental OAT measurement data. These studies confirmed that use of the imaging model in the reconstruction algorithm could significantly improve the spatial resolution of the reconstructed images as compared to those reconstructed assuming a point-like ultrasound transducer. The proposed imaging model will alleviate the need to utilize small transducers and/or large scanning radii and may permit construction of more compact imaging systems. Compensation for acoustic attenuation and heterogeneities in an object's speed of sound and density may be important in certain applications of OAT. In principle, they can be incorporated into the framework of this study. How to construct the system matrix that accounts for more general acoustic properties of the media remains a topic for future work.
Acknowledments
This research was supported in part by NIH award EB010049 and National Science Foundation CAREER Award 0546113.
Appendix
Below we provide additional information regarding the numerical implementation the system matrix H in Eqn. (26) that was employed in our studies.
As described above Eqn. (26), an anti-aliasing filter was applied to ln(r0,q, t), which was implemented in the temporal frequency domain as
| (33) |
where ṽ(f) is the anti-aliasing filter, and l̃n(r0,q, f) is the Fourier transform of ln(r0,q, t):
| (34) |
We defined the low-pass filter ṽ(f) as
| (35) |
where fl and fh specified a continuous decaying window in frequency space. The location of the window limits the spatial resolution we can achieve in the reconstructed images. Since , its frequency spectrum can be calculated by
| (36) |
where
| (37a) |
| (37b) |
Because we chose χn(r) = δ(r – rn) in Eqn. (19), possessed a closed form given by Eqn. (23). It can be verified that can be calculated analytically as
| (38) |
where sinc(x) = x–1 sin x. Also, p̃n(r0,q, t) has an analytical form given by
| (39) |
where and
| (40a) |
| (40b) |
| (40c) |
| (40d) |
To obtain , we sampled in frequency space at a rate of T = SΔT samples per Hertz, and applied the inverse discrete Fourier transform
| (41) |
where, Δf = 1/T . The discrete convolution in Eqn. (26) and the inverse discrete Fourier transform in Eqn. (41) were implemented by use of the fast Fourier transform.
The implementation of the conjugate gradient algorithm requires calculating Eqns. (38) and (39) at n = 0, 1, . . . , N – 1, q = 0, 1, . . . , Q – 1, and f = sΔf with s = 1, 2, . . . , S once for each iteration. To accelerate the computation, we developed parallel program by use of graphic processing unit (GPU). We created N×Q×S threads with each for a pair of voxel (n), transducer location (q) and temporal frequency component (s). By use of multiple GPUs, thousands of threads can run simultaneously. This technique tremendously reduced our computational time and made the iterative reconstruction for 3D OAT feasible. For this work, it took 12 seconds and 2.5 hours per iteration respectively for the simulation and the experimental studies by use of single NVIDIA® Tesla™ C1060 computing processor.
Contributor Information
Kun Wang, Department of Biomedical Engineering, Medical Imaging Research Center, Illinois Institute of Technology, Chicago, IL 60616.
Sergey A. Ermilov, TomoWave Laboratories Inc., Houston TX 77057, (Previous affiliation: Fairway Medical Technologies, Houston, TX 77099)
Richard Su, TomoWave Laboratories Inc., Houston TX 77057, (Previous affiliation: Fairway Medical Technologies, Houston, TX 77099).
Hans-Peter Brecht, TomoWave Laboratories Inc., Houston TX 77057, (Previous affiliation: Fairway Medical Technologies, Houston, TX 77099).
Alexander A. Oraevsky, TomoWave Laboratories Inc., Houston TX 77057, (Previous affiliation: Fairway Medical Technologies, Houston, TX 77099).
Mark A. Anastasio, Department of Biomedical Engineering, Medical Imaging Research Center, Illinois Institute of Technology, Chicago, IL 60616.
References
- 1.Oraevsky AA, Karabutov AA. Optoacoustic tomography. In: Vo-Dinh T, editor. Biomedical Photonics Handbook. CRC Press LLC; 2003. [Google Scholar]
- 2.Wang LV. Tutorial on photoacoustic microscopy and computed tomography. IEEE Journal of Selected Topics in Quantum Electronics. 2008;14:171–179. [Google Scholar]
- 3.Wang LV, Wu H-I. Biomedical Optics, Principles and Imaging. Wiley; Hoboken, N.J.: 2007. [Google Scholar]
- 4.Kunyansky LA. Explicit inversion formulae for the spherical mean radon transform. Inverse Problems. 2007;23:373–383. [Google Scholar]
- 5.Finch D, Patch S, Rakesh Determining a function from its mean values over a family of spheres. SIAM Journal of Mathematical Analysis. 2004;35:1213–1240. [Google Scholar]
- 6.Xu Y, Wang LV. Universal back-projection algorithm for photoacoustic computed tomography. Physical Review E. 2005;71(016706) doi: 10.1103/PhysRevE.71.016706. [DOI] [PubMed] [Google Scholar]
- 7.Xu Y, Feng D, Wang LV. Exact frequency-domain reconstruction for thermoacoustic tomography: I. Planar geometry. IEEE Transactions on Medical Imaging. 2002;21:823–828. doi: 10.1109/tmi.2002.801172. [DOI] [PubMed] [Google Scholar]
- 8.Anastasio MA, Zhang J, Pan X, Zou Y, Keng G, Wang LV. Half-time image reconstruction in thermoacoustic tomography. IEEE Transactions on Medical Imaging. 2005;24:199–210. doi: 10.1109/tmi.2004.839682. [DOI] [PubMed] [Google Scholar]
- 9.Ephrat P, Keenliside L, Seabrook A, Prato FS, Carson JJL. Three-dimensional photoacoustic imaging by sparse-array detection and iterative image reconstruction. Journal of Biomedical Optics. 2008;13(5):054052. doi: 10.1117/1.2992131. [Online]. Available: http://link.aip.org/link/?JBO/13/054052/1. [DOI] [PubMed] [Google Scholar]
- 10.Paltauf G, Viator JA, Prahl SA, Jacques SL. Iterative reconstruction algorithm for optoacoustic imaging. The Journal of the Acoustical Society of America. 2002;112(4):1536–1544. doi: 10.1121/1.1501898. [Online]. Available: http://link.aip.org/link/?JAS/112/1536/1. [DOI] [PubMed] [Google Scholar]
- 11.Zhang J, Anastasio M, La Riviere P, Wang L. Effects of different imaging models on least-squares image reconstruction accuracy in photoacoustic tomography. Medical Imaging, IEEE Transactions on. 2009 Nov.28(11):1781–1790. doi: 10.1109/TMI.2009.2024082. [DOI] [PubMed] [Google Scholar]
- 12.Yang X, Li M-L, Wang LV. Ring-based ultrasonic virtual point detector with applications to photoacoustic tomography. Applied Physics Letters. 2007;90(25):251103. [Online]. Available: http://link.aip.org/link/?APL/90/251103/1. [Google Scholar]
- 13.Harris GR. Review of transient field theory for a baffled planar piston. The Journal of the Acoustical Society of America. 1981;70(1):10–20. [Online]. Available: http://link.aip.org/link/?JAS/70/10/1. [Google Scholar]
- 14.Ermilov SA, Fronheiser MP, Brecht H-P, Su R, Conjusteau A, Mehta K, Otto P, Oraevsky AA. Oraevsky AA, Wang LV, editors. Development of laser optoacoustic and ultrasonic imaging system for breast cancer utilizing handheld array probes. 2009. p. 717703. SPIE. [Online]. Available: http://link.aip.org/link/?PSI/7177/717703/1.
- 15.Xu M, Wang LV. Analytic explanation of spatial resolution related to bandwidth and detector aperture size in thermoacoustic or photoacoustic reconstruction. Physical Review E. 2003;67(056605) doi: 10.1103/PhysRevE.67.056605. [DOI] [PubMed] [Google Scholar]
- 16.Anastasio MA, Zhang J, Modgil D, La Riviere P. Application of inverse source concepts to photoacoustic tomography. Inverse Problems. 2007;23:S21–S35. [Google Scholar]
- 17.Kruger R, Reinecke D, Kruger G. Thermoacoustic computed tomography- technical considerations. Medical Physics. 1999;26:1832–1837. doi: 10.1118/1.598688. [DOI] [PubMed] [Google Scholar]
- 18.Cox BT, Treeby BE. Oraevsky AA, Wang LV, editors. Effect of sensor directionality on photoacoustic imaging: a study using the k-wave toolbox. 2010. p. 75640I. SPIE. [Online]. Available: http://link.aip.org/link/?PSI/7564/75640I/1.
- 19.Li M-L, Cheng C-C. Oraevsky AA, Wang LV, editors. Reconstruction of photoacoustic tomography with finite-aperture detectors: deconvolution of the spatial impulse response. 2010;7564(1):75642S. SPIE. [Google Scholar]
- 20.Li M-L, Zhang HF, Maslov K, Stoica G, Wang LV. Improved in vivo photoacoustic microscopy based on a virtual-detector concept. Opt. Lett. 2006;31(4):474–476. doi: 10.1364/ol.31.000474. [Online]. Available: http://ol.osa.org/abstract.cfm?URI=ol-31-4-474. [DOI] [PubMed] [Google Scholar]
- 21.Li C, Wang LV. High-numerical-aperture-based virtual point detectors for photoacoustic tomography. Applied Physics Letters. 2008;93(3):033902. doi: 10.1063/1.2963365. [Online]. Available: http://link.aip.org/link/?APL/93/033902/1. [DOI] [PMC free article] [PubMed] [Google Scholar]
- 22.Haltmeier M, Scherzer O, Burgholzer P, Paltauf G. Thermoacoustic computed tomography with large planar receivers. Inverse Problems. 2004;20(5):1663–1673. [Online]. Available: http://stacks.iop.org/0266-5611/20/1663. [Google Scholar]
- 23.Paltauf G, Nuster R, Burgholzer P. Characterization of integrating ultrasound detectors for photoacoustic tomography. Journal of Applied Physics. 2009;105(10):102026. [Online]. Available: http://link.aip.org/link/?JAP/105/102026/1. [Google Scholar]
- 24.Kruger RA, William J, Kiser L, Reinecke DR, Kruger GA. Thermoacoustic computed tomography using a conventional linear transducer array. Medical Physics. 2003;30(5):856–860. doi: 10.1118/1.1565340. [Online]. Available: http://link.aip.org/link/?MPH/30/856/1. [DOI] [PubMed] [Google Scholar]
- 25.Zeng Y, Xing D, Wang Y, Yin B, Chen Q. Photoacoustic and ultrasonic coimage with a linear transducer array. Optics Letters. 2004;29:1760–1762. doi: 10.1364/ol.29.001760. [DOI] [PubMed] [Google Scholar]
- 26.Anastasio MA, Wang K, Zhang J, Kruger GA, Reinecke D, Kruger RA. Oraevsky AA, Wang LV, editors. Improving limited-view reconstruction in photoacoustic tomography by incorporating a priori boundary information. 2008. p. 68561B. SPIE. [Online]. Available: http://link.aip.org/link/?PSI/6856/68561B/1.
- 27.Manohar S, Willemink RGH, van der Heijden F, Slump CH, van Leeuwen TG. Concomitant speed-of-sound tomography in photoacoustic imaging. Applied Physics Letters. 2007;91:131911. [Google Scholar]
- 28.Xu M, Wang LV. Photoacoustic imaging in biomedicine. Review of Scientific Instruments. 2006;77(041101) [Google Scholar]
- 29.Wang LV, editor. Photoacoustic Imaging and Spectroscopy. CRC Press; Boca Raton, FL: 2009. [Google Scholar]
- 30.Barrett H, Myers K. Foundations of Image Science. Wiley Series in Pure and Applied Optics; 2004. [Google Scholar]
- 31.Kuchment P, Kunyansky L. Mathematics of thermoacoustic tomography. European Journal of Applied Mathematics. 2008;19(02):191–224. [Google Scholar]
- 32.Lockwood JC, Willette JG. High-speed method for computing the exact solution for the pressure variations in the nearfield of a baffled piston. The Journal of the Acoustical Society of America. 1973;53(3):735–741. [Online]. Available: http://link.aip.org/link/?JAS/53/735/1. [Google Scholar]
- 33.Stepanishen PR. Transient radiation from pistons in an infinite planar baffle. The Journal of the Acoustical Society of America. 1971;49(5B):1629–1638. [Online]. Available: http://link.aip.org/link/?JAS/49/1629/1. [Google Scholar]
- 34.Andreev VG, Karabutov AA, Ponomaryov AE, Oraevsky AA. Oraevsky AA, editor. Detection of optoacoustic transients with a rectangular transducer of finite dimensions. 2002. pp. 153–162. SPIE. [Online]. Available: http://link.aip.org/link/?PSI/4618/153/1.
- 35.Kostli KP, Beard PC. Two-dimensional photoacoustic imaging by use of Fourier-transform image reconstruction and a detector with an anisotropic response. Applied Optics. 2003;42:1899–1908. doi: 10.1364/ao.42.001899. [DOI] [PubMed] [Google Scholar]
- 36.Lewitt RM. Alternatives to voxels for image representation in iterative reconstruction algorithms. Phys. Med. Biol. 1992;37:705. doi: 10.1088/0031-9155/37/3/015. [DOI] [PubMed] [Google Scholar]
- 37.Diebold G, Sun T. Properties of photoacoustic waves in one, two, and three dimensions. Acustica. 1994;80(4):339–351. [Google Scholar]
- 38.Diebold G, Sun T, Khan M. Photoacoustic monopole radiation in one, two, and three dimensions. Physical review letters. 1991;67(24):3384–3387. doi: 10.1103/PhysRevLett.67.3384. [DOI] [PubMed] [Google Scholar]
- 39.Conjusteau A, Ermilov SA, Su R, Brecht H-P, Fronheiser MP, Oraevsky AA. Measurement of the spectral directivity of optoacoustic and ultrasonic transducers with a laser ultrasonic source. Review of Scientific Instruments. 2009 Sep;80(9):093 708–093 708–5. doi: 10.1063/1.3227836. [DOI] [PMC free article] [PubMed] [Google Scholar]
- 40.Fessler JA, Rogers WL. Spatial resolution properties of penalized-likelihood image reconstruction methods: Space-invariant tomographs. IEEE Transactions on Image Processing. 1996;5(9):1346–1358. doi: 10.1109/83.535846. [DOI] [PubMed] [Google Scholar]
- 41.Wernick MN, Aarsvold JN. Emission Tomography, the Fundamentals of PET and SPECT. Elsevier Academic Press; San Diego, California: 2004. [Google Scholar]
- 42.Wang DC, Tamburo RJ, Stetten GD. Cumulative gaussian curve fitter for boundary parameterization. Technical report in special MICCAI 2005 Workshop on Open-Source Software issue of The Insight Journal. 2005 Aug; [Google Scholar]
- 43.Brecht H-P, Su R, Fronheiser M, Ermilov SA, Conjusteau A, Liopo A, Motamedi M, Oraevsky AA. Oraevsky AA, Wang LV, editors. Optoacoustic 3d whole-body tomography: experiments in nude mice. 2009. p. 71770E. SPIE. [Online]. Available: http://link.aip.org/link/?PSI/7177/71770E/1.
- 44.Rosset A, Spadola L, Ratib O. Osirix: An open-source software for navigating in multidimensional dicom images. J. Digital Imaging. 2004;17(3):205–216. doi: 10.1007/s10278-004-1014-6. [DOI] [PMC free article] [PubMed] [Google Scholar]


