

Abstract
Objective
There are many studies on changes in Doppler waveforms of hepatic veins in cirrhotic liver. It is postulated that dampening of phasic oscillations appears with worsening of liver function. Our aim was to reevaluate the significance of Doppler waveforms of hepatic vein in cirrhotic patients and to correlate with hepatic blood flow.
Patients and method
One hundred and thirty-five consecutive patients of liver cirrhosis and 60 age and sex matched non-cirrhotic controls were enrolled in this study. Doppler waveforms were obtained from right hepatic vein during normal respiration. Other parameters measured were flow volume of portal trunk, right portal vein and proper hepatic artery.
Result
Waveforms of the hepatic vein were classified into triphasic, biphasic and flat patterns. Flat waveform was rare and appeared in only 3% cases. There was no correlation between liver dysfunction and patterns of waveforms. Inflow, particularly to the right lobe, was significantly elevated in cases associated with the non-triphasic waveforms.
Conclusion
This study shows that the flat waveforms have no diagnostic value. Role of hepatic blood flow seems to be important suggesting hemodynamic changes rather than liver dysfunction as a plausible cause of change in waveforms.
Keywords: Hepatic vein waveform, Liver cirrhosis, Doppler ultrasound
Introduction
There are several studies regarding changes in waveforms of the hepatic vein (HV) in parenchymal liver disease with conflicting results. This may be attributed to the application of various respiratory maneuvers while obtaining the waveforms. The large degree of overlap in the waveforms between various types of parenchymal liver diseases makes the interpretation of waveform difficult. Of the hepatic causes, changes in liver parenchyma have been pointed out as most probable factor that brings about the change in waveforms. However, there has also been report of changes in waveform in study population without liver and cardiovascular disease [1].
Arterial and portal blood is conveyed to the liver, emptied into the sinusoids of hepatic lobules that again converge to open into the inferior venacava via the hepatic veins. Blood flow is principally regulated in the sinusoids by complex neural and humoral mechanisms, the details of which are yet to be clearly understood. Nodule formation in liver cirrhosis (LC) distorts the normal architecture of the liver and subsequent changes in the intrahepatic resistance to the blood flow are observed. Liver cirrhosis is often complicated by the development of various degree of portal hypertension. Furthermore, intrahepatic shunting vessels often complicate it. Changes in hepatic inflow expectedly cause modification in hepatic venous outflow and change in waveforms can be anticipated. However, the change would be absent or minimum in normal liver because of preserved autoregulation.
In this study, we aimed to reevaluate the significance of Doppler waveform of hepatic vein in LC, as there have been conflicting reports on role of it as a diagnostic tool in the chronic parenchymal liver diseases. It is proposed that dampening in phasic oscillation is dependent on grades of liver function. However, our preliminary study showed no direct correlations. We have used the Doppler flowmetry to measure the hepatic inflow that we assumed as a factor responsible for alteration of HV waveforms in cirrhotic patients.
Materials and methods
One hundred and thirty-five consecutive patients of LC referred to our department between January 2006 and December 2008 for Doppler examination were enrolled in this prospectively designed study. Patients with portal vein thrombosis (n = 10), hepatofugal portal blood flow due to large portosytemic shunts (n = 4) and insufficient visualization of hepatic artery (n = 1) were excluded from the study. Remaining 120 patients (78 men, 42 women, mean age 58 ± 8 years) were studied. The diagnosis of cirrhosis was based on histopathology and/or imaging diagnosis along with clinical and biochemistry parameters. The severity of LC was assessed by Child-Pugh scoring system [2]. Sixty age and sex matched non-cirrhotic controls (31 women, 29 men, mean age 52 ± 12 years) served as control. Controls consisted of 60 non-ulcer dyspepsia patients. Cardiac disease and respiratory diseases, which may cause changes in the Doppler waveform of HV, were ruled out in all in study population.
The instrument used in this study was a pulsed Doppler flowmeter with a 3.75 MHz convex and sector probe. The instrument is equipped with software to calculate the time-averaged velocity from the velocity spectral display after placement of the calipers. The sample width was selected to cover almost entire vessel diameter. Pulse repetition frequency was adjusted so as not to surpass the limit of the displayed maximum velocity. The angle of insonation was always maintained <60. Internal diameter of the vessels was measured manually from the B mode images.
Each subject was examined after overnight fasting in supine position after a rest of 15 min to avoid any influence of food, posture and exercise. Right hepatic vein (RHV) was approached from right intercostals space. The reason behind choosing the RHV over other is that the middle and left hepatic veins join each other before draining to the inferior venacava in about 85% cases [3]. Waveforms of HV were obtained by positioning the sample volume within 2–3 cm from the opening into the inferior venacava during quiet, normal respiration. Doppler waveforms were divided into three types. The waveforms were considered triphasic when there were two hepatofugal or antegrade phases (related to atrial and ventricular diastole) and a short phase of hepatopetal or retrograde flow (caused by the pressure increase in the right atrium at atrial systole) (Fig. 1). Biphasic waveforms lacked negative waves and showed oscillation of positive waves (Fig. 2). Flat waveforms were those without any phasic oscillation (Fig. 3).
Fig. 1.
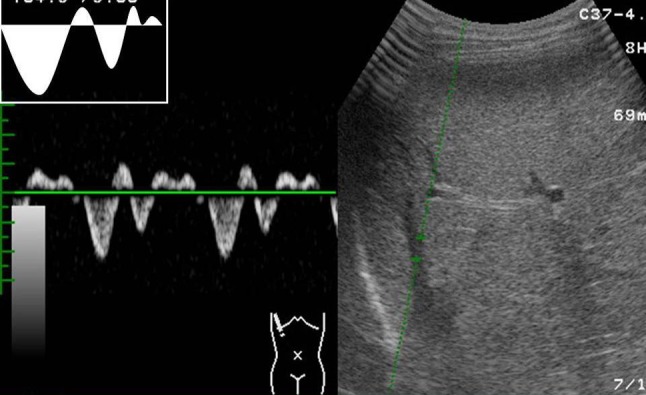
Waveform tracing showing triphasic waveform. There are both positive and negative oscillations
Fig. 2.
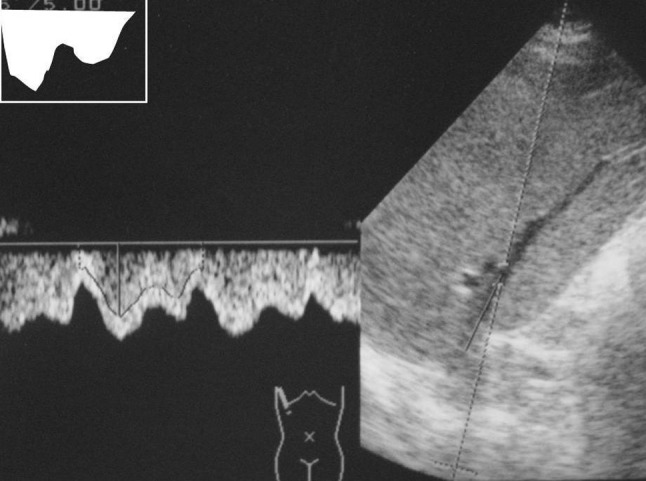
Waveform tracing showing biphasic waveform. There are no negative oscillations
Fig. 3.
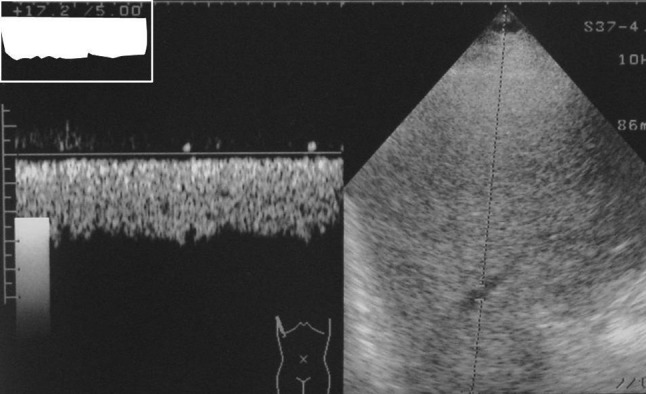
Waveform tracing showing flat waveform. There is no oscillation
The portal vein was assessed at about middle of the portal trunk by approaching from epigastrium with probe placed slight obliquely. The right portal vein was approached from right intercostals spaces. The hepatic artery was examined similarly to the portal trunk as it runs almost parallel with portal vein before entering into the hepatic hilum. At this position, gastroduodenal arteries are expected to have branched from common hepatic artery. Mean velocity and flow of portal trunk and right portal vein were calculated by instrument after obtaining Doppler waveforms. Mean velocity of hepatic artery was calculated by the instrument after manual tracing of the spectral display. Hepatic artery flow was calculated by the formula Q = Vmean X A. The area of cross section (A) was computed from the formula πd2/4. Total hepatic flow was calculated as sum of hepatic artery flow and portal flow. Due to the inability of Doppler to measure flow precisely in right hepatic artery, combined flow of right portal vein and hepatic artery was taken under consideration as inflow to the right lobe of the liver. Help of ECG tracing was taken to determine a complete cardiac cycle in case of flat wave forms.
Doppler examinations were done by two authors (S K C and S P C) who were unaware of clinical or biochemical status of the study population. Three readings were taken for each vessel and mean of three was noted as final reading. Informed, written consent was obtained from all the patients and controls. The study was approved by Institutional review board. The statistical analyses were done using SPSS ver. 10.0 (SPSS Inc., Chicago, IL, USA). All the measurements are expressed in mean ± standard deviation. To compare means, Student’s t test and ANOVA were used. p values < 0.05 were considered significant.
Results
Etiology of LC in patients is given in Table 1. Alcohol topped the list followed by viral causes. The severity of LC as assessed by Child-Pugh scoring system was class A in 54, B in 35 and C in 31 patients.
Table 1.
Etiology of liver cirrhosis
| Causes of liver cirrhosis | No. of patients |
|---|---|
| Alcoholic liver disease | 31 |
| Viral hepatitis | |
| Hepatitis B virus (HBV) | 12 |
| Hepatitis C virus (HCV) | 6 |
| HCV + HBV | 2 |
| Primary biliary cirrhosis | 2 |
| Autoimmune hepatitis | 2 |
| Wilson’s disease | 2 |
| Hemochromatosis | 1 |
| Cryptogenic (? NASH) | 2 |
All the controls showed triphasic waveforms. Among cirrhotic patients, triphasic pattern was observed in 60 (50%), biphasic in 56 (46.7%) and flat in 4 (3.3%) patients. Types of the waveforms according to the grade of liver function are shown in Table 2. The result showed that the appearance of waveform is independent on degree of severity of liver function as graded by Child-Pugh score. Flat waveform was very rare, appearing only in four occasions. There was no difference in waveform patterns in relation to different etiologies of LC. There was no intra-observer variability regarding tracing of the hepatic vein waveforms.
Table 2.
Patterns of hepatic vein waveforms in controls and patients
| Non-cirrhotic control | Liver cirrhosis | |||
|---|---|---|---|---|
| A (n = 54) | B (n = 35) | C (n = 31) | ||
| Triphasic | 60 | 32 (59.3%) | 19 (54.2%) | 9 (29%) |
| Biphasic | 0 | 20 (37%) | 15 (42.9%) | 21 (67.8%) |
| Flat | 0 | 2 (3.7%) | 1 (2.9%) | 1 (3.2%) |
Table 3 summarizes the results of hemodynamic data in study populations. All inflows to the liver were significantly higher in cirrhotic than in non-cirrhotic controls. Considering triphasic as normal waveform, LC patients were divided into two groups according to the waveforms. The cases having triphasic waveforms were grouped into “triphasic group” while those having biphasic and flat waveforms were grouped into “non-triphasic group”. Results of hemodynamic data are compared as shown in Table 4. All the inflows to liver, namely portal flow (621 ± 219 vs. 698 ± 196 ml/min, p < 0.046), hepatic artery flow (254 ± 151 vs. 365 ± 206 ml/min, p < 0.001) and total hepatic flow (883 ± 276 vs. 1067 ± 265 ml/min, p < 0.0001) were increased in non-triphasic group. Combined flow of right portal vein and hepatic artery, which we took as inflow to right lobe, was significantly increased in non-triphasic group than triphasic group (561 ± 220 vs. 770 ± 237 ml/min, p < 0.0001). The intra-observer variability was 10% in hepatic artery, 8% in right portal vein and 6% in portal trunk.
Table 3.
Summary of hemodynamic data in control and patients
| Control | Liver cirrhosis | P | |
|---|---|---|---|
| PBF | 513 ± 115 | 662 ± 214 | <0.0001 |
| RPBF | 300 ± 91 | 362 ± 142 | <0.006 |
| HAF | 186 ± 83 | 304 ± 185 | <0.0001 |
| THF | 698 ± 162 | 973 ± 282 | <0.0001 |
| RPBF + HAF | 486 ± 122 | 652 ± 245 | <0.0001 |
All values are expressed in mean ± standard deviation in ml/min
PBF portal blood flow, RPBF right portal blood flow, HAF hepatic arterial flow, THF total hepatic flow, RPBF + HAF combined flow of right portal vein and hepatic artery
Table 4.
Summary of hemodynamic data in patients
| Triphasic group | Non-triphasic group | p | |
|---|---|---|---|
| PBF | 621 ± 219 | 698 ± 196 | <0.046 |
| RPBF | 316 ± 128 | 415 ± 139 | <0.0001 |
| HAF | 254 ± 151 | 365 ± 206 | <0.001 |
| THF | 883 ± 276 | 1,067 ± 265 | <0.0001 |
| RPBF + HAF | 561 ± 220 | 770 ± 237 | <0.0001 |
All values are expressed in mean ± standard deviation in ml/min
PBF portal blood flow, RPBF right portal blood flow, HAF hepatic arterial flow, THF total hepatic flow, RPBF + HAF combined flow of right portal vein and hepatic artery
Discussion
There are two negative waves and one positive wave of hepatic vein (HV) in healthy human when studied by Doppler giving it a triphasic appearance [4]. The phasicity is caused by the changes in cardiac cycle, predominantly the change in right atrial pressure [5]. Its correlation with electrocardiographic tracing further advocates cardiac origin. More detailed observation shows that it consists of large antegrade systolic and diastolic waves, and small retrograde v, a, and rarely c waves [6]. The waveform is modified in patients with tricuspid regurgitation [6, 7], hepatic congestion secondary to right heart failure [8] Budd–Chiari syndrome [9–11] and chronic parenchymal liver diseases [8, 9, 12, 13]. It is widely regarded that the waveform becomes flat when hepatocellular function is impaired. Some studies even suggest that flattening of the hepatic waveform can be used as diagnostic tool for chronic parenchymal liver disease [8, 9, 13].
Our study showed that the appearance of flat waveform of HV in cirrhotic patients is independent to liver dysfunction. Only four patients showed flat waveform and half of the patients were A by Child-Pugh scoring. Our result is comparable to a study carried out in Japanese patients [14]. However, change of waveform to biphasic from triphasic seems suggestive of some changes in the liver parenchyma as only cirrhotic patients showed change from triphasic to biphasic or flat waveform. Although the phasicity is cardiac in origin, respiratory motion can alter the HV waveforms and its components [5]. With Valsalva maneuver and suspended respiration, the negative oscillation disappeared in few cases and it may be the reason of discrepancy in findings among many studies. This may be the reason why 7/75 (9.33%) subjects of Shapiro et al. [1] showed flat waveform even without liver or cardiac disease. Changes in the right atrial pressure with respiratory maneuvers may be a probable cause. However, it was seen in only certain cases and the reason is not well understood why it occurs in some patients only. In another study by Pedersen et al. [15], abnormal waveform was found in 17/139 studied patients who were not having any liver disease. Bolondi et al. [8] have reported that the underlying mechanism of the change in the HV waveform may be related to liver fibrosis, which progressively reduces phasic oscillation in HVs. But in our patients, triphasic waveform was seen even in appreciably atrophied liver. Role of different etiologies of LC has not been studied in any studies so far. In another study by Kawanaka et al. in Japan, they found normal or triphasic waveform in 34/103 patients and they have also concluded that the liver parenchyma is not the only factor that causes changes in the waveform [16].
In a Korean study by Kim et al., it was found that there was change in hepatic waveforms in 18/21 patients of liver cirrhosis after administration of 2 mg terlipressin. Since terlipressin acts on different receptors causing hemodynamic changes, it is reasonable to believe that the change in hemodynamics rather than liver function is more responsible for change in hepatic vein waveform in cirrhotic patients [16]. In another study by Kim MY et al. [16], they have found that there is change in dampening index (defined by minimum velocity/maximum HV velocity) after ingestion of propranolol. As this non-selective beta blocker causes hemodynamic changes rather than changes in the liver parenchyma, it should be the hemodynamic factor rather than tissue factor that causes changes in the waveforms. The results of both Korean study support our findings.
Continuous flow of RHV due to increased flow into the right lobe can be the plausible explanation of disappearance of negative waves and decrease in phasic oscillations of HV in the cirrhotic patients. In agreement with other study [17], our study showed that there is increase in total hepatic blood flow in cirrhotic than non-cirrhotic patients. This can be explained by hyperdynamic circulation present in liver cirrhosis [18, 19] and arterialization of the cirrhotic liver [16]. Among cirrhotics, non-triphasic group had increased hepatic inflow and all the indices of inflow were significantly higher. In normal subjects, there is no direct communication between periphery of the portal and HVs. Blood flows from the portal venules into the HV system traversing through sinusoids. However, in pathological condition like liver cirrhosis, a direct communication occurs between the two venous systems [20]. Moreover, it has been hypothesized that functionally inactive pre-existing arterio-venous shunts are opened in a response to intense vasodilatation [21]. These shunts are not easily detected by conventional B mode ultrasound. We assume that the alteration in hemodynamics of portal vein and hepatic artery will have an influence on HV, its flow and waveform when there is development of abnormal communications. There is also deranged autoregulation of sinusoidal flow in cirrhotic liver. Inability to obtain inflow data of right hepatic artery, which would have given more accurate result, may be the pitfall of this study. If there is hypertrophied left lobe, there may be decreased flow in right hepatic artery and vice versa. As atrophy or hypertrophy of one lobe is common in LC, this factor should be considered in future studies. Those cases having flat waveforms were associated with much increased inflow than biphasic waveform. However, due to limited number of cases (only four cases) it is difficult to draw conclusion.
The Doppler flowmetry is relatively accurate and reproducible. It is increasingly being used in clinical practices [22, 23]. We have applied this non-invasive technique to study the inflow into the liver and an attempt has been made to correlate the hemodynamic findings with the Doppler waveform of HV in cirrhotic patients. A change in hepatic flow is expected in chronic liver diseases due to the alteration of hepatic microcirculation, formation of porto-systemic collaterals, splanchnic hyperemia and development of portal hypertension.
In conclusion, HV waveforms are independent of liver functions. To obtain accurate waveforms, it should be acquired during quiet normal respiration. The change that appears in cirrhotic livers is presumably due to the change in hepatic hemodynamics. Changes in hepatic flow coupled with abnormal intrahepatic shunt vessels may be a plausible explanation of alteration in phasic oscillations of HV waveforms.
References
- 1.Shapiro RS, Winsberg F, Maldjian C, Stancato-Pasik A. Variabilty of hepatic vein Doppler tracings in normal subjects. J Ultrasound Med. 1993;12:701–703. doi: 10.7863/jum.1993.12.12.701. [DOI] [PubMed] [Google Scholar]
- 2.Pugh RNH, Murray-Lyon IM, Dawson JL, Pietroni MC, Williams R. Transection of the esophagus for bleeding esophageal varices. Br J Surg. 1973;60:646–649. doi: 10.1002/bjs.1800600817. [DOI] [PubMed] [Google Scholar]
- 3.Nakamura S, Tsuzuki T. Surgical anatomy of the hepatic veins, the inferior vena cava. Surg Gynecol Obstet. 1981;152(1):43–50. [PubMed] [Google Scholar]
- 4.Burns PN. Hemodynamics. In: Taylor KJW, Burns PN, Wells PNT, editors. Clinical applications of Doppler ultrasound. New York: Raven Press; 1988. pp. 46–75. [Google Scholar]
- 5.Abu-Yousef MM. Normal and respiratory variations of the hepatic and portal venous duplex Doppler waveforms with simultaneous electrocardiographic correlation. J Ultrasound Med. 1992;11:263–268. doi: 10.7863/jum.1992.11.6.263. [DOI] [PubMed] [Google Scholar]
- 6.Abu-Yousef MM. Duplex Doppler sonography of the hepatic vein in tricuspid regurgitation. AJR. 1991;156:79–83. doi: 10.2214/ajr.156.1.1898574. [DOI] [PubMed] [Google Scholar]
- 7.Pennestri F, Loperfido F, Salvatori MP, et al. Assessment of tricuspid regurgitation by pulsed Doppler ultrasonography of the hepatic veins. Am J Cardiol. 1984;54:363–368. doi: 10.1016/0002-9149(84)90198-X. [DOI] [PubMed] [Google Scholar]
- 8.Bolondi L, Bassi SL, Gaiani S, Zironi G, Benzi G, Santi V, Barbara L. Liver cirrhosis: changes of Doppler waveform of hepatic veins. Radiology. 1991;78:513–516. doi: 10.1148/radiology.178.2.1987617. [DOI] [PubMed] [Google Scholar]
- 9.Colli A, Cocciolo M, Riva C, Martinez E, Prisco A, Pirola M, Bratina G. Abnormalities of Doppler waveform of the hepatic veins in patients with chronic liver disease: correlation with histologic findings. AJR. 1994;162:833–837. doi: 10.2214/ajr.162.4.8141001. [DOI] [PubMed] [Google Scholar]
- 10.Ohta M, Hashizume M, Tomikawa M, Ueno K, Tanoue K, Sugimachi K. Analysis of hepatic vein waveform by Doppler ultrasonography in 100 patients with portal hypertension. Am J Gastroenterol. 1994;89:170–175. [PubMed] [Google Scholar]
- 11.Chawla Y, Kumar S, Dhiman RK, Suri S, Dilawari JB. Duplex Doppler sonography in patients with Budd-Chiari syndrome. J Gastroenterol Hepatol. 1999;14:904–907. doi: 10.1046/j.1440-1746.1999.01969.x. [DOI] [PubMed] [Google Scholar]
- 12.Herbay AV, Freiling T, Haussinger D. Association between duplex Doppler sonographic flow pattern in right hepatic vein and various liver diseases. J Clin Ultrasound. 1999;29(1):25–30. doi: 10.1002/1097-0096(200101)29:1<25::AID-JCU4>3.0.CO;2-A. [DOI] [PubMed] [Google Scholar]
- 13.Arda K, Ofeli M, Calikoglu U, Olcer T, Cumhur T. Hepatic vein Doppler waveform changes in early stages (Child-Pugh A) chronic parenchymal liver disease. J Clin Ultrasound. 1997;25:15–19. doi: 10.1002/(SICI)1097-0096(199701)25:1<15::AID-JCU3>3.0.CO;2-N. [DOI] [PubMed] [Google Scholar]
- 14.KC S, Matsutani S, Maruyama H, Akike T, Saishi H. Doppler study of hepatic vein in cirrhotic patients: correlation with liver dysfunction and hepatic hemodynamics. World J Gastroenterol. 2006;12(36):5853–5858. doi: 10.3748/wjg.v12.i36.5853. [DOI] [PMC free article] [PubMed] [Google Scholar]
- 15.Pedersen JF, Dakhil AZ, Jensen DB, Sondergaard B, Bytzer P. Abnormal hepatic vein Doppler waveform in patients without liver disease. Br J Radiol. 2005;78(927):242–244. doi: 10.1259/bjr/15227254. [DOI] [PubMed] [Google Scholar]
- 16.Kim MY, Baik SK, Park DH, et al. Damping index of Doppler hepatic vein waveform to assess the severity of portal hypertension, response to propranolol in liver cirrhosis: a prospective nonrandomized study. Liver Int. 2007;27(8):1103–1110. doi: 10.1111/j.1478-3231.2007.01526.x. [DOI] [PubMed] [Google Scholar]
- 17.Zoli M, Magalotti D, Bianchi G, Ghigi G, Orlandini C, Grimaldi M, Marchesini G, Pisi E. Functional hepatic flow, Doppler-assessed total hepatic flow in control subjects, in patients with cirrhosis. J Hepatol. 1995;23(2):129–134. doi: 10.1016/0168-8278(95)80326-2. [DOI] [PubMed] [Google Scholar]
- 18.Kowalski H, Abelmann WH. The cardiac output at rest in Laennec’s cirrhosis. J Clin Invest. 1964;32:1025–1033. doi: 10.1172/JCI102813. [DOI] [PMC free article] [PubMed] [Google Scholar]
- 19.Murray JF, Dawson AM, Sherlock S. Circulatory changes in chronic liver disease. Am J Med. 1958;24:358–367. doi: 10.1016/0002-9343(58)90322-X. [DOI] [PubMed] [Google Scholar]
- 20.Ohnishi K, Chin N, Saito M, et al. Portographic opacification of hepatic veins and (anomalous) anastomosis between the portal and hepatic veins in the cirrhosis: indication of extensive intrahepatic shunts. Am J Gastroenterol. 1986;81:975–978. [PubMed] [Google Scholar]
- 21.Johnson G, Jr, Dart CH, Jr, Peters RM, Macfie JA. Hemodynamic changes with cirrhosis of the liver: control of arteriovenous shunts during operation for esophageal varices. Ann Surg. 1966;163(5):692–703. doi: 10.1097/00000658-196605000-00006. [DOI] [PMC free article] [PubMed] [Google Scholar]
- 22.Zoli M, Marchesini G, Cordiani MR, Pisi P, Brunori A, Trono A, Pisi E. Echo-Doppler measurement of splanchnic blood flow in control and cirrhotic subjects. J Clin Ultrasound. 1986;14:429–435. doi: 10.1002/jcu.1870140605. [DOI] [PubMed] [Google Scholar]
- 23.Barbara L. The value of Doppler US in the study of hepatic hemodynamics. Consensus conference. J Hepatol. 1990;10:353–355. doi: 10.1016/0168-8278(90)90146-I. [DOI] [PubMed] [Google Scholar]