

Asf1b, the necessary Asf1 isoform for proliferation, is predictive of outcome in breast cancer
Anti-silencing function 1 (Asf1) is a H3–H4 chaperone involved in both replication-coupled and replication-independent nucleosome assembly pathways. Here in mammalian cells Asf1b is the physiologically important isoform for cell proliferation and overexpression of Asf1b correlates with prognosis and metastasis status of breast cancer.
Keywords: Asf1b, breast cancer, histones, proliferation
Abstract
Mammalian cells possess two isoforms of the histone H3–H4 chaperone anti-silencing function 1 (Asf1), Asf1a and Asf1b. However to date, whether they have individual physiological roles has remained elusive. Here, we aim to elucidate the functional importance of Asf1 isoforms concerning both basic and applied aspects. First, we reveal a specific proliferation-dependent expression of human Asf1b unparalleled by Asf1a. Strikingly, in cultured cells, both mRNA and protein corresponding to Asf1b decrease upon cell cycle exit. Depletion of Asf1b severely compromises proliferation, leads to aberrant nuclear structures and a distinct transcriptional signature. Second, a major physiological implication is found in the applied context of tissue samples derived from early stage breast tumours in which we examined Asf1a/b levels. We reveal that overexpression of Asf1b mRNA correlate with clinical data and disease outcome. Together, our results highlight a distribution of tasks between the distinct Asf1 isoforms, which emphasizes a specialized function of Asf1b required for proliferation capacity. We discuss the implications of these results for breast cancer diagnosis and prognosis.
Introduction
Our understanding of the molecular basis of cancer has advanced tremendously with the identification of mutations in the genome of tumour cells (Hanahan and Weinberg, 2000). Yet, while numerous studies support a major role for genetic events in breast cancer susceptibility (Stratton and Rahman, 2008), this genetic contribution alone does not explain the clinical complexity and heterogeneity of breast cancers. Reports of abnormal gene expression (mostly gene silencing) in cancer cells (Esteller, 2007; Jones and Baylin, 2007) associated with changes in DNA methylation and aberrant histone post-translational modifications in corresponding promoter regions support the importance of changes in chromatin organization during tumourigenesis. In addition, these kind of approaches can provide useful medical applications as shown with genome-wide changes of specific histone modifications, which are predictive of clinical outcome in specific cancers (Kurdistani, 2007). Thus, to analyze how particular alterations in chromatin organization and histone dynamics occur in cancer offers important avenues for a basic understanding of tumourigenesis leading to possible medical applications.
Histones represent a highly conserved set of proteins, which have a central role in the functional organization of eukaryotic DNA into chromatin. They organize as an octamer comprising (H3–H4–H2A–H2B)2 histones around which about 146 bp of DNA is wrapped to form the basic unit of chromatin, the core nucleosome (Kornberg, 1977). As they exist as variants and can be modified, they provide a large repertoire of information enabling to modulate the chromatin landscape genome wide (Loyola and Almouzni, 2007). During their entire cellular life, these basic proteins are constantly escorted by a class of proteins called histone chaperones which importance came recently in the limelight (De Koning et al, 2007; Eitoku et al, 2008; Ransom et al, 2010). Defined as key actors involved in histone transfer without being part of the final product, the nucleosome (De Koning et al, 2007), histone chaperones are involved in all aspects of histone dynamics including chromatin assembly and disassembly processes (Polo and Almouzni, 2006). Particular histone chaperones have been assigned to promote specific chromatin assembly pathways. For example, the deposition of the H3.1–H4 replicative histones coupled to DNA replication or repair is mainly ensured by chromatin assembly factor 1 (CAF-1), a complex of three polypeptides RbAp48, p60 and p150 in mammals, as part of an assembly line (Smith and Stillman, 1989; Gaillard et al, 1996; Tagami et al, 2004). The H3.3–H4 replacement histones which can assemble independently of DNA synthesis (Ahmad and Henikoff, 2002) involves other chaperones among which Histone Regulator A (HIRA) (Ray-Gallet et al, 2002; Tagami et al, 2004) and accompanying partners (Drane et al, 2010; Goldberg et al, 2010).
In this study, we focus on the histone H3–H4 chaperone anti-silencing function 1 (Asf1) whose importance for S-phase progression has been demonstrated in various organisms (Tyler et al, 1999; Sanematsu et al, 2006; Schulz and Tyler, 2006; Groth et al, 2007). First identified by its ability to derepress transcriptional silencing when overexpressed in yeast (Le et al, 1997), Asf1 has been implicated in transcriptional regulation in yeast (Li et al, 2007; Mousson et al, 2007) and Drosophila (Goodfellow et al, 2007; Moshkin et al, 2009). However, while a single isoform of Asf1 is present in yeast, mammals possess two Asf1 isoforms, called Asf1a and Asf1b. They show a highly conserved N-terminus which provides a binding interface with the H3.1–H4 replicative histones or the H3.3–H4 replacement histones (De Koning et al, 2007), and a less characterized divergent C-terminal part (Supplementary Figure S1A). Both Asf1 isoforms synergize with CAF-1 in the replication-coupled assembly pathway via a direct interaction with the mid-subunit CAF-1 p60 (Tyler et al, 1999; Mello et al, 2002; Tagami et al, 2004). Collectively, the two human Asf1 isoforms have also been implicated in buffering the transient overload of replicative histone H3.1 that accumulates during replication stress (Groth et al, 2005), as well as in the control of S-phase progression (Groth et al, 2007). In the latter case, human Asf1a and Asf1b, via a histone bridge, interact with the MCM2–7 complex of proteins, the putative helicase that unwinds DNA ahead of the replication fork, and thus are critical for handling histones at replication forks (Groth et al, 2007; Jasencakova et al, 2010). Importantly, under the combined depletion of both Asf1 isoforms, major defects in S-phase progression are observed. Thus, both Asf1a and Asf1b can potentially contribute to the replicative function and possibly substitute for one another. However, this does not exclude the existence of a task distribution in various physiological contexts and different regulatory means to control their use. A hint in this direction is provided by the higher expression of Asf1b in human tissues such as thymus or testis (Umehara and Horikoshi, 2003). Intriguingly, in yeast depleted of endogenous Asf1, the introduction of human Asf1a is best able to rescue defects in the DNA damage response, while human Asf1b best compensates for the growth defects and the sensitivity to replicational stress (Tamburini et al, 2005). In mammalian cells, Asf1a interacts specifically with HIRA connecting this particular isoform with the replication-independent assembly pathway (Daganzo et al, 2003; Tagami et al, 2004; Tang et al, 2006). Furthermore, Asf1a is required for senescence-associated cell cycle exit together with HIRA (Zhang et al, 2005). Taken together, these data emphasize common molecular properties of Asf1 isoforms in order to handle H3–H4 histone pools, yet, they also reveal a potential for distinct functions and for distribution of tasks between the two Asf1 isoforms in different physiological contexts.
One particular physiological context highly relevant in human disease such as breast cancer is proliferation. The example of CAF-1 p60 as a proliferation marker with diagnostic value in breast cancer (Polo et al, 2004), underlines that histone chaperones represent appealing candidates for identifying tumour cells with a high-replicative potential. In addition, they might represent new classifiers that could provide better guidelines for the administration of adjuvant chemotherapy in such a complex disease that is breast cancer.
Here, we investigate the specific task distribution of the two human Asf1 isoforms, Asf1a and Asf1b, in relation to cell proliferation and tumourigenesis. We used model cell lines, to study the expression pattern and the impact of the specific depletion of Asf1 isoforms in relation to proliferation. As a further means to explore the physiological relevance of our results, we analysed a selection of breast tumour samples for which a long-term patient follow-up was available. Taken together, we reveal here a distribution of the tasks between each Asf1 isoform and assign a key role for Asf1b in proliferation. Furthermore, we demonstrate that Asf1b can be used as a new proliferation marker, which is relevant for both the diagnosis and the prognosis in breast cancer and is potentially a new target for drug discovery in breast cancer.
Results
Asf1a and Asf1b levels in proliferating and non-proliferating cells
To examine the expression of Asf1 isoforms in distinct proliferating states, we used specific antibodies that we developed against full-length Asf1a or the C-terminal region of Asf1b, and which recognize only one or the other isoform (Supplementary Figure S1; Supplementary Table SI). Importantly, while their distinct migration on SDS–PAGE enables to distinguish Asf1a and Asf1b (Sillje and Nigg, 2001), for immunofluorescence studies the use of these antibodies was essential to specifically assess the presence of Asf1a or Asf1b in single cells. We first analysed the expression of Asf1a and Asf1b during the cell cycle in synchronized HeLa cells (Supplementary Figure S2A). While we detected a slight increase in the levels of Asf1b at the RNA level as shown by quantitative RT–PCR during the cell cycle (Supplementary Figure S2B), western blot analysis revealed that Asf1a and Asf1b are expressed at comparable levels during all stages of the cell cycle as previously reported (Supplementary Figure S2C) (Sillje and Nigg, 2001). This indicates that Asf1a and Asf1b may also function in other phases of the cell cycle and are not restricted to S phase (Corpet and Almouzni, 2009; Ransom et al, 2010).
Given the absence of significant variation in total extracts during the cell cycle while there is a differential expression of Asf1 isoforms in human tissues (Umehara and Horikoshi, 2003), we investigated the levels of Asf1 isoforms in non-cycling cells. To address this issue, we used various model cell lines in which a transient cell cycle exit can be induced in a controlled manner. With an anti-estrogen treatment, MCF7 breast carcinoma cells enter in quiescence (Carroll et al, 2000). Under these conditions and using cyclin A and the histone chaperone CAF-1 p60 as cell cycle controls (Polo et al, 2004), we observed a dramatic decrease in the levels of Asf1b protein (Figure 1A, western blot analysis), as in Polo et al (2004). Our quantification by chemiluminescence revealed a downregulation of Asf1b of at least five-fold in quiescent cells. In contrast, we only observed a minor decrease of Asf1a. We further confirmed these results by immunofluorescence microscopy using our specific antibodies (Figure 1A, immunofluorescence).
Figure 1.

Expression of Asf1b depends on the cycling status of cells. (A) (Left upper panel) Western blot analysis of total cell extracts from non-treated asynchronous (AS) and quiescent (G0) MCF7 breast cancer cells. Increasing amounts (X) of total cell extracts are loaded. We revealed Asf1a and Asf1b with a mix of the specific Asf1 antibodies (Supplementary Figure S1; Supplementary Table SI). We use CAF-1 p60 and cyclin A as markers for cell proliferation. α-Tubulin is a loading control. M: molecular weight marker. (Left lower panel) Asf1a and Asf1b mRNA levels in proliferating (AS) and quiescent (G0) MCF7 cells as determined by quantitative RT–PCR. We normalized levels to the reference gene RPLPO (de Cremoux et al, 2004) and set levels in proliferating cells to 100%. The error bars represent s.d. from two independent experiments. (Right panel) Specific expression of Asf1a, Asf1b and the largest subunit of CAF-1 (p150) revealed by immunofluorescence in MCF7 cells AS or G0. DAPI stains nuclei. Scale bar is 20 μm. (B) (Upper panel) Western blot analysis of total cell extracts from non-treated AS and G0 BJ primary foreskin fibroblasts and from primary IMR90 human diploid fibroblasts young (PD27), old (PD72) and senescent (PD80) performed as in A. (Lower panel) Asf1a and Asf1b mRNA levels in proliferating AS and G0 BJ primary fibroblasts or in young, old and senescent IMR90 human diploid primary fibroblasts as determined by quantitative RT–PCR performed as in A. The error bars represent s.d. from three and two independent experiments, respectively. (C) Flow cytometry analysis of the cell cycle distribution of MCF7 and BJ cells AS or G0.
We then examined the mRNA levels of Asf1a and Asf1b in asynchronous or quiescent cells by quantitative RT–PCR. While Asf1a mRNA levels remained stable upon quiescent induction, Asf1b mRNA levels drop (about seven-fold) in quiescence, revealing an important regulatory impact on Asf1b expression at the RNA level (transcription activity and/or RNA stability) (Figure 1A, quantitative RT–PCR). We then induced quiescence by serum starvation in a human primary fibroblast cell line (BJ) (verified by flow cytometry, Figure 1C), and found similar results (Figure 1B). The same trend was found in the U-2-OS osteosarcoma cell line (Supplementary Figure S3A and B). Thus, in various cell lines we could extend the validity of our results. Further, we chose replicative senescence, a permanent cell cycle arrest, considered as critical given the role of senescence in tumour suppression (de Lange, 1998; Adams, 2007; Bartek et al, 2007). We found that Asf1b isoform, at both the protein and mRNA levels in IMR90 human diploid primary fibroblasts at early passages (young, PD30) or later passages (old, PD72 and senescent, PD80), directly reflects the replication capacity of the cells showing a major downregulation in senescent cells (about five-fold) while Asf1a expression was only mildly affected (Figure 1B). We conclude that Asf1b, in contrast to Asf1a, is a specific marker for discriminating between cycling and non-cycling cells, whether transiently or permanently arrested.
Expression pattern of Asf1 isoforms upon cell cycle entry
We then examined how and when Asf1b is re-expressed upon release from G0 in MCF7 cells. We monitored cell cycle progression both by flow cytometry and by the expression of the known cell cycle regulator cyclin A, or the proliferation markers CAF-1 p60 or p150 (Supplementary Figure S3C, E–F) (Polo et al, 2004). Western blotting revealed that, during release from G0, re-expression of Asf1b correlated with the reappearance of cyclin A (Supplementary Figure S3C). Remarkably, the changes observed at the protein level paralleled those changes observed at the mRNA level as measured by quantitative RT–PCR (Supplementary Figure S3D). We obtained similar results in BJ primary foreskin cells released from G0 (data not shown). By microscopy, we also found that the number of cells positive for Asf1b increased after release from quiescence and corresponded to cells expressing CAF-1 p150 (Supplementary Figure S3E). Together, our data demonstrate that Asf1b is expressed in a manner dependent on the cycling status.
Asf1b correlates with the proliferation status of breast cancer cell lines
As tumoral cells often show a high proliferation rate, we examined the expression of Asf1 isoforms in human tumoral mammary cell lines, relative to normal cells. For this, we used mammary cells derived from the same patient: Hs578T tumoral and Hs578Bst normal cells which provide a direct comparison between cells of similar origin (Hackett et al, 1977). Hs578T tumoral and Hs578Bst normal cells contain 25 and 13% of cells in S phase, respectively (Figure 2A). Western blot analysis of total cell extracts revealed a marked increase of about 5.5-fold in the levels of Asf1b protein in tumoral versus normal cells as quantified by chemiluminescence (Figure 2B). Quantitative RT–PCR analysis revealed a 2.8-fold increase in the levels of Asf1b mRNA in tumoral mammary cells indicating that Asf1b protein expression is regulated at least in part at the level of transcription (Figure 2C). We further confirmed this overexpression of Asf1b at the mRNA level in a series of breast cancer cell lines (e.g., MDA-MB-231) in which we found a range of 3–20-fold increase in Asf1b mRNA levels in tumoral cells compared to normal mammary cells (data not shown). In contrast, Asf1a protein or mRNA levels did not vary significantly. Interestingly, expression of Asf1b paralleled the proliferative status of mammary cells as assessed by CAF-1 p60 in western blot (Figure 2B) or CAF-1 p150 staining in immunofluorescence (Figure 2D). A closer analysis by immunofluorescence microscopy revealed that, in individual cells, Asf1b staining perfectly matched CAF-1 p150 staining, while in contrast, Asf1a did not (Figure 2D and E). We thus conclude that Asf1b expression directly correlates with the proliferative status of mammary cells and is overexpressed in highly proliferative tumoral cells.
Figure 2.

Asf1b levels reflect the proliferating status of breast cell lines. (A) Flow cytometry analysis of the breast cancer cell line Hs578T (T) and the non-tumoral mammary cell line Hs578Bst (Bst), which are derived from the same patient (Hackett et al, 1977), in order to assess polyploidy. Tumoral (T) and normal (Bst) cells contain 25 and 13% of cells in S phase, respectively (De Koning et al, 2009). (B) Western blot analysis of total extracts from tumoral (T) and normal (Bst) mammary cell lines. We revealed Asf1(a+b) with a mix of the specific Asf1 antibodies and CAF-1 p60 is shown for comparison. Increasing amounts of cell extracts (X) are loaded. Memcode is a loading control. M: molecular weight marker. The percentage of cells in S phase (A) and the percentage of CAF-1 positive cells (+) (E) are indicated below the western blot. (C) Quantitative RT–PCR analysis of Asf1a and Asf1b mRNA levels in tumoral (T) and normal (Bst) mammary cell lines. We normalized levels to the reference gene RPLPO and set levels in normal cells to 100%. Error bars represent s.d. from three independent experiments. (D) Specific expression of Asf1a, Asf1b and CAF-1 p150 revealed by immunofluorescence analysis of tumoral (T) and normal (Bst) mammary cell lines. Total levels of each protein are visualized, as cells were not pre-extracted before fixation. DAPI stains nuclei. Scale bar is 10 μm. (E) Histograms show quantitative analysis of the proportion of positive cells for Asf1a or Asf1b staining in tumoral (T) and normal (Bst) mammary cell lines. Within these cells, we indicated the proportion of CAF-1 p150 positive (+) or negative (−) cells. These histograms underscore the tight correlation between Asf1b and CAF-1 expression both dependent on proliferation. Numbers represent the mean of three independent experiments.
Asf1a versus Asf1b depletion: distinct effects on cellular fate
To investigate potential different requirements for each Asf1 isoform in relation to proliferation, we decided to knock down Asf1a and Asf1b, individually or together by RNA interference. We first verified the specific depletion of one or the other isoform by western blot in human U-2-OS cells. While a single band corresponding to Asf1b or Asf1a remained visible after the single depletion of Asf1a or Asf1b, respectively, the two bands corresponding to Asf1a and Asf1b isoforms disappeared in the double knockdown as seen by western blot analysis (Figure 3A). Importantly, while knockdown of both isoforms produced a strong accumulation of cells in S phase as shown previously (Groth et al, 2005, 2007), cell cycle profiles by FACS analysis did not change significantly after depletion of Asf1a or Asf1b alone at 48 h of siRNA (Figure 3A).
Figure 3.

Distinct effects of Asf1a and Asf1b depletions. (A) (Left panel) Western blot analysis of total extracts from human U-2-OS cells showing the specific depletion of Asf1a, Asf1b or Asf1(a+b) for 48 h by siRNA treatment. Increasing amounts (X) of total cell extracts are loaded and α-Tubulin serves as a loading control. A mix of the specific Asf1 antibodies reveals Asf1a and Asf1b. M: molecular weight marker. (Right panel) Flow cytometry analysis of the cell cycle distribution of the cells shown in the left panel. (B) mRNA extracted from human U-2-OS cells treated as in A were hybridized to Affymetrix HG-U133-Plus2 oligonucleotide microarrays. mRNA expression levels of Asf1a and Asf1b obtained from the Affymetrix hybridization are expressed as a log2 (fold change) relative to the control siRNA depletion. Error bars represents data from two independent experiments. (C) Venn diagram showing the overlap between the significantly (P<0.05) differentially expressed genes determined in each siRNA condition indicated (siAsf1a, siAsf1b and siAsf1(a+b)) versus the control siRNA. Numbers indicate the quantity of genes overlapping between two conditions. (D) Gene ontology (GO) analysis of differentially expressed genes after the specific knockdown of Asf1a or Asf1b or Asf1(a+b) (see Supplementary data for details). Histogram bars represent the −log(P-value) for each significant GO term. Terms for which the test resulted in a −log(P-value) equal to 3.5 (P-value <5.10−4) as shown by the dashed line were considered to be significantly overrepresented for the given list. Numbers in brackets indicate the number of significant genes found in the list of differentially expressed genes for the given GO category. Arrows indicate if the genes are upregulated or downregulated in the indicated siRNA relative to the control siRNA.
We also examined the impact of each Asf1 isoform on transcription genome wide. Using RNA extracted from our cells depleted of the different Asf1 isoforms, we performed a transcriptome analysis on a GeneChip Human Genome U133 Plus 2.0 Array (Affymetrix). Depletion of Asf1a, Asf1b or Asf1(a+b) was effectively detected under our hybridization conditions (Figure 3B) and by quantitative RT–PCR (Supplementary Figure S4A). We observed that Asf1b depletion led to a slight but reproducible 2.2-fold upregulation of Asf1a relative to the mock depletion, suggesting a potential compensating mechanism (Figure 3B). In contrast, Asf1a depletion did not significantly alter Asf1b levels. The changes observed by the Affymetrix microarray analysis were reproduced by quantitative RT–PCR in three independent experiments for a set of selected genes, and with another independent set of siRNAs against Asf1 isoforms (Supplementary Figure S4A and B). Remarkably, our Venn diagram showed that while the highest proportion of affected genes (2151) is shared between the three different siRNA conditions, Asf1b has the highest contribution to the overall changes observed in Asf1(a+b) depletion (Figure 3C). This is consistent with the heatmap representation of the differentially expressed genes (Supplementary Figure S4C). We then performed a gene ontology (GO) analysis on the differentially expressed genes. Each of our siRNA conditions affected various functional classes of genes further emphasizing a clear distinct transcriptional signature for Asf1a and Asf1b. The class of genes linked to S phase stood out in Asf1b depletion, supporting the importance of Asf1b in cell proliferation (Figure 3D).
We then investigated in closer details the effects of Asf1a/b depletion at the cellular level, in the U-2-OS model cell line (Supplementary Figure S5), and in two breast cancer cell lines: Hs578T cells (Figure 4; Supplementary Figure S6) and MDA-MB-231 cells (Supplementary Figure S7) in which we could obtain a significant depletion of Asf1 isoforms (Supplementary Figures S6 and S7A, B). Intriguingly, Asf1b depletion alone led to a remarkable and reproducible increase in the number of aberrant nuclear structures including altered nuclear morphology (3–10 times more than in the control siRNA) and micronuclei formation in all cell lines studied (Figure 4A and B; Supplementary Figures S5A, B and S7C). In addition, Asf1b depletion also increased the number of internuclear DNA bridges (Figure 4C; Supplementary Figure S7C). Quantification of the number of altered nuclei as well as the number of micronuclei in U-2-OS cells depleted with two independent sets of siRNA confirmed the specificity of the phenotype observed upon Asf1b depletion only (Supplementary Figure S5B). The expression pattern of lamin A, a marker of the nuclear periphery, was specifically altered in Asf1b-depleted cells suggesting the presence of an abnormal nuclear lamina in the lobulated nuclei, not observed upon Asf1a depletion (Figure 4C; Supplementary Figure S5C). We then assayed the ability of cells depleted of the different Asf1 isoforms to undergo ‘unlimited' division by performing a colony formation assay (Franken et al, 2006) on mammary tumoral Hs578T cells transfected with control, Asf1a, Asf1b or Asf1(a+b) siRNAs. In this assay, a decrease in the number of colonies reflects either impaired proliferation or increase in cell death, or both. We observed a striking difference in the number of colonies obtained after the single Asf1 isoform depletions underscoring a distinct impact of Asf1a and Asf1b on proliferation (Figure 4D). Asf1b-depleted cells formed fewer colonies than the control cells, suggesting that the absence of Asf1b prevented continued proliferation. We confirmed these results in U-2-OS cells (Supplementary Figure S5D) and MDA-MB-231 cells (Supplementary Figure S7D). Importantly, given the decrease in a number of genes required for proliferation in Asf1b-depleted cells, but not Asf1a, in our transcriptomic data (data not shown), the effects observed upon Asf1b depletion most likely reflect an acute effect on proliferation leading to cell death as a consequence. This is further supported by our transcriptomic data in which we could not find any bias towards genes involved in cell death in Asf1b-depleted cells. Collectively, our depletion analysis underscored distinct functions of Asf1 isoforms with an ultimate importance of Asf1b for proliferation.
Figure 4.

Asf1b depletion impairs proliferation. (A) Immunofluorescence analysis of human Hs578T cells showing the specific depletion of Asf1a, Asf1b or Asf1(a+b) for 48 h by RNA interference. DAPI stains nuclei. Scale bar is 10 μm. (B) Histograms show quantitative analysis of the proportion of aberrant nuclear structures in Hs578T cells treated as in A. The mean percentage of altered nuclei (lobulated) and the percentage of micronucleated cells after 48 h of siRNA treatment are plotted. Error bars represent s.d. from four independent experiments. (C) (Left panel) Immunofluorescence analysis of Lamin A staining in Hs578T cells treated as in A. Arrowheads mark DNA bridges. DAPI stains nuclei. Scale bar is 10 μm. (Right panel) Histograms show quantitative analysis of the proportion of DNA bridges in Hs578T cells treated as in A. Error bars represent s.d. from two independent experiments. (D) Colony formation assay for Hs578T cells treated with two independent sets of siRNAs against Asf1 isoforms. The mean surviving fraction (%) is indicated in the histograms. Error bars represent data from three independent experiments.
Asf1b correlates with proliferation in breast tumour samples
To assess the relevance of our findings connecting Asf1b with proliferation in a physiological context, we analysed a selection of cryopreserved breast carcinoma samples collected in 1995 at the Institut Curie. Supplementary Table SIIA provides the patients' and tumour characteristics. We focussed on node-negative and metastasis-free invasive breast carcinoma of a size that permitted primary conservative tumourectomy (median 18 mm; range 6–50 mm). The standard treatment received by the patients at the Institut Curie for such localized breast cancers was tumour excision with radiotherapy. However, adjuvant systemic therapy can increase the chance of long-term survival and determining which patients with localized breast cancers would benefit from these treatments is a current challenge (Sotiriou and Piccart, 2007). Thus, new classifiers could provide better guidelines for the administration of adjuvant chemotherapy. We therefore measured Asf1a, Asf1b, CAF-1 p60 and CAF-1 p150 mRNA expression levels by quantitative RT–PCR in 86 breast tumour samples and normalized the expression levels to the known reference gene RPLPO (de Cremoux et al, 2004). For statistical analysis, we only kept data that fulfilled our amplification quality criteria.
First, we studied the correlation between the levels of each Asf1 isoform and that of another proliferation marker such as CAF-1 subunits (Polo et al, 2004) or Ki67 (Schonk et al, 1989). Asf1a levels only weakly correlated with that of Asf1b, CAF-1 p60 or CAF-1 p150 and did not correlate with Ki67. In contrast, Asf1b levels significantly correlated with p60 (r=0.7; P<10−9), p150 (r=0.6; P<10−10) and Ki67 (r=0.5; P<10−6), which again demonstrated its important link with cell proliferation (Supplementary Table SIIB; Supplementary Figure S8A). We then investigated the correlation of Asf1a, Asf1b, CAF-1 or Ki67 levels with clinical parameters to evaluate a potential diagnostic value. We found a high significant positive correlation of Asf1b levels, but not Asf1a, with the tumour size (P=0.0063), the number of mitotic cells (P<10−5), and the grade of the tumour (P<10−5) (Figure 5A). Notably, the correlation of Asf1b with the mitotic index and the tumour grade proved even stronger than the other proliferative markers p60 and Ki67 (Figure 5A). Supplementary Table SIIB summarizes all correlations. Taken together, our observations put forward Asf1b as a new proliferation marker of clinical interest and prompted us to examine its prognostic value in the context of breast cancer.
Figure 5.

Asf1b levels correlate with proliferation and have a prognostic value in breast cancer patients. (A) Box plots representing logarithmic expression levels of Asf1a, Asf1b, CAF-1 p60 and Ki67 mRNAs, according to the indicated clinico-pathological factors in breast cancer samples with a >10 years patient follow-up. Boxes represent the 25–75th percentile, brackets: range; black line: median; black dots: outliers. Below each graph the P-values determined by a Kruskal–Wallis test are indicated. Red colour together with an asterisk * indicates a significant P-value (P<0.05). (B) Univariate Kaplan–Meier curves of the disease free interval (interval before the occurrence of local recurrence, regional lymph node recurrence, controlateral breast cancer or metastasis) and the occurrence of metastasis (metastasis-free interval) in patients expressing low (Asf1b ⩽0.7) or high (Asf1b >0.7) levels of Asf1b. Red colour together with an asterisk * indicates a significant P-value (P<0.05). The number of patients at risk at each time point is indicated below each graphic (see also Supplementary Figures S8 and S10).
Asf1b has a prognostic value in breast cancer
We first investigated the relationships between Asf1b levels and disease outcome, as determined by the disease free interval, the overall survival and the occurrence of metastasis. As Asf1a did not show a significant correlation with any of the clinical markers studied, it was not included in the analysis. We determined a cutoff value of 0.7 for Asf1b mRNA levels which divided patients into two groups: one with low Asf1b levels (67% of patients with Asf1b ⩽0.7), and the second with high Asf1b levels (>0.7) which was significantly associated with disease progression (P=0.017, relative risk (RR)=2.3 (1.1–4.8)) in univariate analysis (Figure 5B). Moreover, higher Asf1b levels significantly associated with an increased occurrence of distant metastasis (P=0.0002, RR=7.8 (2.1–28.3)) (Figure 5B) and a shorter overall survival (P=0.01, RR=6.3 (1.3–31.3)) (data not shown) further underlining the prognostic value of Asf1b. At 10 years, 98% (93–100) of the patients with low Asf1b expression had not developed metastasis compared to 66% (50–87) of the patients with high Asf1b levels. Importantly, we validated these results in another independent set of 71 breast carcinoma samples collected in 1996 at the Institut Curie (see Materials and methods; Supplementary Figure S8B). In univariate analysis, high expression levels of Asf1b significantly associated with an increased risk of metastasis (P=0.014, RR=5.41 (1.2–25.4)) and a shorter DFI (P=0.036, RR=2.7 (1.03–6.9)) (Supplementary Figure S8C) underscoring the highly significant prognostic value of Asf1b.
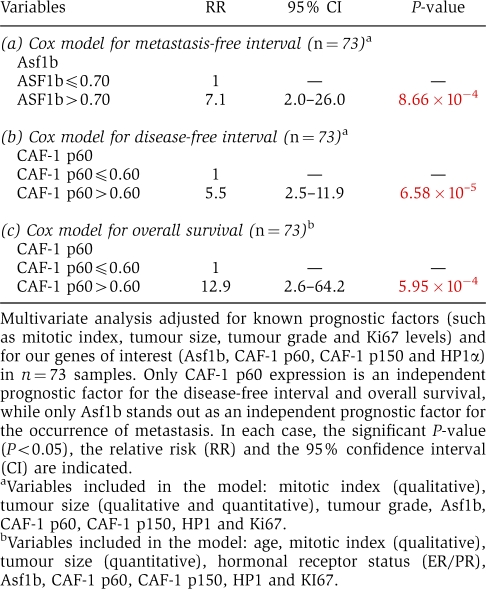
Next, we compared the prognostic value of Asf1b with CAF-1 p60, CAF-1 p150 and HP1α (De Koning et al, 2009) in multivariate analysis adjusted for known prognostic factors and for our genes of interest. We found that only high CAF-1 p60 expression was an independent prognostic factor for disease progression (P<10−4, RR=5.5 (2.5–11.9)) and decreased overall survival (P<10−3, RR=12.9 (2.6–64.2)) (Table I). Our observations thus confirm that CAF-1 is not only of interest for diagnosis (Polo et al, 2004) but also show its relevance for the prognosis of breast cancer. Notably, Asf1b stood out as the only independent prognostic factor for the metastasis-free interval (P<10−3). High Asf1b levels are associated with a higher risk of developing distant metastasis (RR=7.1 (2.0–26.0)) (Table I). In the set of tumour samples from 1996, we found menopausal status (P=0.013, RR=4.2 (1.4–12.8)) and Asf1b mRNA levels (P=0.024, RR=5.7 (1.3–25.7)) as independent prognostic markers for metastasis-free interval (Supplementary Table SIII), therefore confirming data obtained in the first series of tumour samples. Interestingly, together with menopausal status, Asf1b expression levels also significantly predicted disease progression (Supplementary Table SIII). Thus, we demonstrate for the first time on two independent sets of data that Asf1b is a new proliferation marker of prognostic value in breast cancer that is highly predictive for the occurrence of metastasis.
Table 1. Multivariate analysis in patients of 1995.
 |
Asf1 levels in breast tumour subtypes
In breast cancer, expression-profiling studies have helped to distinguish different subtypes of tumours according to a specific expression profile (Sotiriou and Piccart, 2007) defining the following molecular classes: luminal-A cancers and luminal-B cancers, which are predominantly estrogen receptor (ER) positive; basal-like cancers, which mostly correspond to ER-negative, progesterone receptor-negative and HER2-negative tumours; and HER2-overexpressing cancers corresponding to tumours with amplification of the ERBB2 gene. Importantly, these molecular subgroups have distinct clinical outcomes and responses to therapy, with the basal-like tumours and HER2-positive tumours having a more aggressive clinical picture (Sotiriou and Piccart, 2007). Taking advantage of an available transcriptome database derived from breast tumour samples of cryopreserved tissues selected from the Institut Curie, we examined Asf1 levels in specific subtypes of breast tumours. Asf1a mRNA levels were similar in normal breast samples, luminal tumours (luminal and micropapillary) and basal-like (BLC) subtypes, and only significantly increased in the medullary basal-like (MBC) subtype which has an inflammatory stroma (Figure 6). In contrast, Asf1b mRNA levels were low in normal breast tissue and significantly increased in all breast tumour subtypes (Figure 6). Interestingly, although we did not find a genetic-signature specific for a particular breast cancer subtype, we found the highest expression levels for Asf1b in the BLC and MBC subgroups, corresponding to the basal-like highly proliferative tumours (Figure 6). Thus, Asf1b expression levels showed a clear association with the proliferation rate and aggressiveness of distinct breast cancer subtypes.
Figure 6.

Asf1b levels in specific breast tumour subtypes compared to normal tissue. Asf1a and Asf1b mRNA expression levels in different subtypes of breast cancer were analysed from available transcriptomic data selected from the Institut Curie Human Tumor database. BLC (basal-like cancers) (n=17) and MBC (medullary basal-like cancers) (n=19) are basal-like subtypes of breast tumours with MBC tumours characterized by an inflammatory stroma. LUMINAL (n=23) groups breast subtypes from the Luminal A and Luminal B category. MICRO (micropapillary cancers) (n=22) indicates breast subtypes belonging to the Luminal B subtype. NORMAL (n=6) corresponds to normal breast tissue. Comparisons of the expression levels of Asf1a and Asf1b between sample groups were performed using two-sample Wilcoxon rank-sum tests. Boxes represent the 25–75th percentile, brackets: range; black line: median; black dots: outliers. Significant P-values of these tests (<0.05) were corrected for multiple testing using the Bonferroni method. NS: non-significant.
Discussion
While yeast presents a single form of the Asf1 histone H3–H4 chaperone, in many multicellular organisms, including plants or mammals, there are two distinct isoforms whose specific individual functions have remained unexplored. Here, we investigated their respective implication in cell proliferation. In cultured cells, we reveal a unique proliferation-dependent expression pattern of Asf1b, not shared by Asf1a, that enables to distinguish tumoral from non-tumoral derived breast cancer cells. Depletion of Asf1b shows the prominent role of this isoform for cell proliferation, with a distinct transcriptional impact genome-wide and cellular abnormalities reminiscent of mitotic defects. Moreover, using a selection of samples from early stage breast tumours derived from patients, we demonstrate for the first time the clinical relevance of Asf1b as a proliferation marker of prognostic value in early stage breast cancers.
A distribution of the tasks between Asf1 isoforms for distinct proliferation status
Using various model cell lines, we found that the two Asf1 isoforms are expressed in a distinct manner. While Asf1a levels remain unchanged in cycling, quiescent or senescent cells, Asf1b levels directly reflect the proliferation capacity of the cells at both the protein and RNA levels in model and breast mammary cell lines. Asf1 isoforms share molecular and biochemical properties as histone H3–H4 chaperones, as exemplified by their overlapping functions during replication (Figure 3A and C) (Groth et al, 2005, 2007), yet, their expression is uniquely regulated. In this respect, the fact that Asf1b is a direct transcriptional target of E2F1 (Hayashi et al, 2007) proved interesting but it might not be sufficient to explain the proliferation-dependent regulation of Asf1b, given that both Asf1a and Asf1b can also be regulated at the protein level by phosphorylation (Pilyugin et al, 2009). Future investigations should address which additional aspects impart on this regulation. Remarkably, when exploring data from the Gene Expression Omnibus database (GEO, NCBI) we found that the proliferation-dependent expression of human Asf1b was conserved in other human cell types, such as in the human T98G glioblastoma cancer cells arrested by serum deprivation (GEO accession number GDS911), it is thus a general property throughout multiple cell types. Notably, this also extends to other organisms such as mouse (GDS575), thus opening avenues for genetic studies in this model system. Interestingly, the levels of Asf1 isoforms also vary in a distinct manner upon differentiation (GDS586), as another form of cell cycle exit. Taken together, our study shows that the specific regulation of Asf1a and Asf1b levels can serve as a means for a distribution of the tasks between the two Asf1 isoforms in different physiological contexts important in multicellular organisms.
Functional importance of Asf1 isoforms
Our genome-wide transcriptome analysis coupled with the analysis of the effects caused by the depletion of Asf1 isoforms shows that, while Asf1a and Asf1b can partly compensate for each other (Figure 3A and C), these two isoforms have a distinct role in mammalian cells. The relatively small effects observed in the transcriptome analysis compared to depletion of transcription factors, suggests that Asf1 isoforms may have an auxiliary role in transcriptional regulation. Their main function would rather lie in regulating the dynamics of the histone pool with potential specificities and regulations depending on cellular context.
The role of Asf1a, as the only Asf1 isoform remaining when no DNA replication occurs, as observed in quiescent or aged cells, may relate to the particular Asf1a–HIRA interaction (Tang et al, 2006). Indeed, the specific cooperation of Asf1a with HIRA for histone H3.3 deposition in a replication-independent manner underlines its possible functions outside DNA replication (Tagami et al, 2004; Mousson et al, 2007). Another role for Asf1a to consider relates to gene silencing, as suggested by the recent finding of mouse Asf1a, but not Asf1b, in a screen for genes required for Ras-mediated epigenetic silencing of genes (Gazin et al, 2007). This would be consistent with a role for the hAsf1a–HIRA complex in the repression of proliferation-promoting genes, such as the cyclin A gene. This would occur by formation of condensed chromatin (SAHF) at such genes (Zhang et al, 2005). The fact that ectopic expression of hAsf1a in human primary fibroblasts induces senescence, a known tumour suppression process (Zhang et al, 2005; Adams, 2007) is consistent with this hypothesis. Taken together, this places Asf1a as an important player when cells exit from the proliferation cycle in situations such as senescence.
In contrast, Asf1b appears to be most critical for proliferation in various cell lines including breast cancer cells (Figure 4; Supplementary Figure S7) and U-2-OS cells (Supplementary Figure S5). One can hypothesize that, in proliferating cells, Asf1b would be best able to handle the pool of replicative histone H3.1 thereby acting as the prominent histone acceptor/donor during DNA replication. This would be consistent with a major contribution of Asf1b to the defects observed upon knockdown of both Asf1 isoforms (Figure 3C; Supplementary S4C) and with the late appearance of damage signal upon its depletion possibly as a consequence of impaired chromatin assembly during S phase (Supplementary Figure S9). While we cannot formally exclude that Asf1b could potentially directly upregulate genes related to DNA replication (Figure 3D, list for Asf1b-depleted cells), such transcriptional changes could simply represent an indirect effect enabling to compensate replication defects. Notably, when cells enter into a non-dividing state, the amount of the H3.1 replicative histone variant available drops which leaves a remaining pool of histones consisting mainly of H3.3. Asf1a would then suffice to handle this limited histone pool. While some preferential interactions with a given H3 variant are plausible, structural studies will be needed to explore whether this is dictated by the binding properties of the partners or simply a reflection of availability of given H3 variants. However, we cannot exclude that the effect of Asf1b on proliferation could be due to a specific function of this isoform outside S phase. In this respect, it is intriguing that Asf1b-depleted cells show a marked increase in the number of nuclei with an altered morphology, as well as in the number of micronuclei and internuclear DNA bridges (Figure 4B and C; Supplementary Figures S5B, C and S7C). Such abnormalities, which may result from replication defects, can also be indicative of mitotic defects suggesting that Asf1b could have a role during mitosis that would be crucial for sustained proliferation. Further studies should shed light on this issue.
Having high levels of Asf1b would therefore confer a growth advantage to proliferating cells, in agreement with our observations that Asf1b levels are highly downregulated in primary senescent fibroblasts (Figure 1B). Thus, not only Asf1b is expressed in a proliferation-dependent manner, but also it is required for proliferation, potentially during and outside S phase, which is relevant for cancer progression.
Asf1b as a marker of diagnostic and prognostic value for breast cancer
Using samples from a first series of breast tumours, we demonstrate for the first time the clinical relevance of Asf1b as a new prognostic factor predictive of disease outcome in breast cancer. Our analysis extended to a second independent set of patient samples collected in 1996 (Supplementary Figure S8B and C; Supplementary Table SIII), as well as our analysis of published transcriptomic data of the Oncomine database (Rhodes et al, 2004) (Supplementary Figure S10A), further confirms the high prognostic value of Asf1b in breast cancer. In addition, Asf1b levels also identify the aggressivity of breast tumour subtypes, with a higher expression in basal-like cancers (Figure 6). Multivariate analyses demonstrate that Asf1b levels predict the occurrence of metastasis better than any current standard prognostic markers, while CAF-1 p60 proved here to be another prognostic factor with a better prediction value for the disease free interval and survival rates, consistent with recent data (Staibano et al, 2009; Mascolo et al, 2010; Polo et al, 2010). Furthermore, we found that beside a significant and consistent overexpression in breast cancers, Asf1b stands out in other types of malignancies, such as skin, liver, ovarian and lung (Supplementary Figure S10B). Asf1b was also found in a ‘cervical cancer proliferation cluster' of 163 highly correlated transcripts, which were overexpressed in cervical tumours with an unfavourable disease outcome (Rosty et al, 2005). In contrast, Asf1a was not retrieved as a significant gene in these studies. Our results therefore lead us to propose that Asf1b represents a new proliferation marker of interest in a wide range of cancers, which can be used as a classifier with a powerful prognostic value for metastasis occurrence. While we did not find any obvious evidence for a misregulation of genes involved in metastasis in our transcriptome analysis of Asf1b-depleted cells (data not shown), future studies should aim at determining if the strong prognostic value of Asf1b for metastasis occurrence could be due to its effect on the invasion capacity of cells.
Interestingly, proliferation genes are present in several gene expression prognostic signatures such as MammaPrint (van 't Veer et al, 2002) or the genomic-grade signature (Sotiriou et al, 2006), which offer improved prognostic tools that can better predict clinical outcome than the traditional clinical standards. It is thus not surprising that Asf1b belongs to a set of co-expressed proliferative genes with prognosis value in breast cancer (Wirapati et al, 2008). Remarkably, while most genes of this proliferation module are directly related to progression through cell cycle such as cyclins, replication factors and aurora kinases, Asf1b stands out as an interesting proliferation marker related to chromatin organization and histone dynamics. One could envisage that high Asf1b levels would confer an important chromatin plasticity, as an essential parameter to promote the survival of cancer cells in a selective environment. This distinct function at a chromatin level places Asf1b as an original prognostic marker adding further information complementary to the one brought by previously known prognostic markers. Thus, the combination of Asf1b with other selected markers related to chromatin organization such as HP1α (De Koning et al, 2009), and CAF-1 p60 may have a stronger clinical value in the most aggressive breast cancer subtypes such as basal-like tumours.
In conclusion, our study enables to ascribe to the distinct Asf1 isoforms specific roles associated with different proliferation states. Assuming that in all instances these roles involve histone handling, the proliferative role of Asf1b could predominantly participate in histone dynamics during replication while Asf1a would rather connect to transcription/silencing or senescence. The proliferative role of Asf1b culminates with a validation as a new proliferation marker of interest both in the context of model cell lines and tumour samples. Furthermore, the high Asf1b expression correlating with increased rates of disease progression and metastasis occurrence in small breast cancer, defines Asf1b as a new prognostic factor of clinical value. Future work should explore how to exploit these findings that highlight Asf1b as an attractive target for cancer treatment.
Materials and methods
Cell lines and cell culture
We used DMEM medium (GIBCO) for U-2-OS osteosarcoma (gift from J Bartek, Copenhagen), HeLa cervical carcinoma (gift from M Bornens, Paris), MCF7 and MDA-MB-231 breast adenocarcinoma cancer cell lines, MEMα medium (GIBCO) for BJ primary foreskin fibroblasts (CRL-2522, ATCC), RPMI medium (GIBCO) supplemented with 10 mg/ml insulin (Sigma) for Hs478T breast cancer cells (gift from O Delattre, Paris) (Hackett et al, 1977), and DMEM medium (GIBCO) containing 30 ng/ml epidermal growth factor (TEBU) for Hs478Bst healthy mammary cells (ATCC) (Hackett et al, 1977). All media contain 10% FCS (Eurobio) and 10 mg/ml penicillin and streptomycin (GIBCO). We used Glutamax-DMEM (Invitrogen) supplemented with 15% FCS to grow early passage (PD25) IMR90 human primary fibroblasts (ATCC) at 7.5% CO2 and 3% O2. To obtain old (PD72) and senescent (PD80) cells, we passaged cells in a 1:4 regimen for additional population doublings where the new PD was calculated as PD=PD at plating+[ln (#harvested/#seeded)/ln2]. We counted cells with the Z1 Coulter Particule Counter (Beckman coulter).
Antibodies
We raised antibodies against full-length Asf1a (#28 134) and against the C-terminal part (aa 156–202) of Asf1b (#18 143) (Supplementary data) and confirmed specificity by western blotting and immunofluorescence microscopy (Supplementary Figure S1). As Asf1a and Asf1b migrate at different positions (Sillje and Nigg, 2001), we used a mix of the specific Asf1 antibodies for simultaneous detection of the two isoforms by western blotting. For immunofluorescence studies, we used either highly purified Asf1a (#28 134) or Asf1b (#18 143) antibodies from sera (Agrobio). Supplementary Table SI compiles all primary antibodies.
siRNA and transfections
We transfected U-2-OS, Hs578T and MDA-MB-231 cells in an antibiotics-free medium for 48 h with 100 nM siRNA using Oligofectamine reagent (Invitrogen) and optimem 1 medium (GIBCO) according to the manufacturer's instructions. We used siRNA sequences (oligo set #1 and oligo set #2) against Asf1a, Asf1b and siControl (siCon) (Dharmacon) as in Groth et al (2005, 2007) or siRNAs against Asf1a and Asf1b together at a final concentration of 50 nM each for the double depletion of Asf1(a+b).
Colony formation assay
We transfected U-2-OS, Hs578T or MDA-MB-231 cells with siRNAs against Asf1a, Asf1b, or Asf1(a+b) or with a control siRNA as above. Twenty-four hours after transfection, we plated 1000–2000 cells as a single-cell suspension in 6 cm dishes, allowed cells to grow under normal conditions for 11–12 days before staining with 0.1% Coomassie Brilliant Blue R-250 (Bio-Rad) dissolved in 50% methanol, 15% acetic acid and counted colonies using an automatic counting colony counter pen. We determined the mean plating efficiency and the surviving fraction as in Franken et al (2006).
Western blotting
For total extracts, we processed lysed cells in Laemmli sample buffer 1 × (62.5 mM Tris–HCl pH=6.8, 10% glycerol, 2% SDS, 0.002% bromophenol blue and 100 mM DTT) as in Martini et al (1998). We used Memcode Protein Stain Kit (Thermo Scientific) to detect proteins transferred onto nitrocellulose membranes. Supplementary Table SI lists primary antibodies. We used secondary antibodies conjugated with Horseradish peroxidase (Interchim) and revealed signal by chemiluminescence substrate from Pierce (SuperSignal West Pico or SuperSignal West Femto).
Immunofluorescence microscopy
Cells grown on coverslips, fixed in 2% paraformaldehyde and permeabilized in PBS containing 0.2% Triton X-100, were processed as in Martini et al (1998). See Supplementary data for detailed information.
RNA extraction and quantitative RT–PCR
We used the RNeasy mini kit (QIAGEN) for total RNA extraction for transcriptome analysis and the miRNeasy mini kit (QIAGEN) for RNA extraction from frozen breast cancer samples (De Koning et al, 2009). We performed reverse transcription and quantitative RT–PCR as described in Supplementary data.
Transcriptomic data analysis
In two independent experiments, we prepared mRNAs using U-2-OS cells treated with control, Asf1a, Asf1b or Asf1(a+b) siRNAs for 48 h, and hybridized them on Affymetrix HG-U133-Plus2 oligonucleotide microarrays. We determined differentially expressed genes using the Bioconductor package limma (Smyth, 2004) (see Supplementary data). We drew a Venn diagram using the lists of differentially expressed genes (upregulated and downregulated) determined against the control siRNA with a P-value of 0.05. We used the statistical software R (2.5.0 version) to visualize gene expression values.
Breast tumour samples and statistics
We used samples from patients with breast tumour classified as non-palpable (T0) or small (T1–T2), lymph node negative (N0) and metastasis free (M0), selected at the Institut Curie Biological Resources Center and treated with primary conservative tumorectomy. In total, 92 patients diagnosed in 1995 (first set) and 71 patients diagnosed in 1996 (second set) granted permission to use their sample and data for research purposes. We used the first sets of patients for analysis and the second independent set for validation of the first series of results. Supplementary Table SIIA and Supplementary Figure S8B provide patient's and tumour characteristics. For the two sets of tumours, we selected RNA extracted from 86 and 71 cryofrozen tissue, respectively, of sufficient quality for further analysis by quantitative RT–PCR and then carried out statistical analyses. See Supplementary data for details.
Supplementary Material
Acknowledgments
We thank all members of the UMR218 for help and discussion. Adam Cook, Dominique Ray-Gallet and Jean-Pierre Quivy for critical reading of the manuscript, Haniya Rehman for performing Q-PCR on the set of patient samples from 1996, Nicolas Servant for help with the transcriptome analysis, Anne-Vincent Salomon and Nadège Gruel for help with patient samples and for access to the Institut Curie databases of transcriptomes from breast cancer tumours. This work was supported by la Ligue Nationale contre le Cancer (Equipe labellisée Ligue 2010), PIC Programs, the European Commission Network of Excellence Epigenome (LSHG-CT-2004-503433), the European Commission ITN FP7-PEOPLE-2007 ‘Image DDR' and FP7-PEOPLE-2008 ‘Nucleosome 4D', ACI-2007-Cancéropôle IdF ‘Breast cancer and Epigenetics', ANR ‘ECenS' ANR-09-BLAN-0257-01, INCa ‘GepiG' and ERC Advanced Grant 2009-AdG_20090506. AC was funded by University Pierre et Marie Curie (UPMC) and Association pour la Recherche sur le Cancer (ARC).
The expression data has been submitted to the ArrayExpress microarray data repository (accession: E-MEXP-2671).
Footnotes
The authors declare that they have no conflict of interest.
References
- Adams PD (2007) Remodeling of chromatin structure in senescent cells and its potential impact on tumor suppression and aging. Gene 397: 84–93 [DOI] [PMC free article] [PubMed] [Google Scholar]
- Ahmad K, Henikoff S (2002) The histone variant H3.3 marks active chromatin by replication-independent nucleosome assembly. Mol Cell 9: 1191–1200 [DOI] [PubMed] [Google Scholar]
- Bartek J, Bartkova J, Lukas J (2007) DNA damage signalling guards against activated oncogenes and tumour progression. Oncogene 26: 7773–7779 [DOI] [PubMed] [Google Scholar]
- Carroll JS, Prall OW, Musgrove EA, Sutherland RL (2000) A pure estrogen antagonist inhibits cyclin E-Cdk2 activity in MCF-7 breast cancer cells and induces accumulation of p130-E2F4 complexes characteristic of quiescence. J Biol Chem 275: 38221–38229 [DOI] [PubMed] [Google Scholar]
- Corpet A, Almouzni G (2009) Making copies of chromatin: the challenge of nucleosomal organization and epigenetic information. Trends Cell Biol 19: 29–41 [DOI] [PubMed] [Google Scholar]
- Daganzo SM, Erzberger JP, Lam WM, Skordalakes E, Zhang R, Franco AA, Brill SJ, Adams PD, Berger JM, Kaufman PD (2003) Structure and function of the conserved core of histone deposition protein Asf1. Curr Biol 13: 2148–2158 [DOI] [PubMed] [Google Scholar]
- de Cremoux P, Bieche I, Tran-Perennou C, Vignaud S, Boudou E, Asselain B, Lidereau R, Magdelenat H, Becette V, Sigal-Zafrani B, Spyratos F (2004) Inter-laboratory quality control for hormone-dependent gene expression in human breast tumors using real-time reverse transcription-polymerase chain reaction. Endocr Relat Cancer 11: 489–495 [DOI] [PubMed] [Google Scholar]
- De Koning L, Corpet A, Haber JE, Almouzni G (2007) Histone chaperones: an escort network regulating histone traffic. Nat Struct Mol Biol 14: 997–1007 [DOI] [PubMed] [Google Scholar]
- De Koning L, Savignoni A, Boumendil C, Rehman H, Asselain B, Sastre-Garau X, Almouzni G (2009) Heterochromatin protein 1alpha: a hallmark of cell proliferation relevant to clinical oncology. EMBO Mol Med 1: 178–191 [DOI] [PMC free article] [PubMed] [Google Scholar]
- de Lange T (1998) Telomeres and senescence: ending the debate. Science 279: 334–335 [DOI] [PubMed] [Google Scholar]
- Drane P, Ouararhni K, Depaux A, Shuaib M, Hamiche A (2010) The death-associated protein DAXX is a novel histone chaperone involved in the replication-independent deposition of H3.3. Genes Dev 24: 1253–1265 [DOI] [PMC free article] [PubMed] [Google Scholar]
- Eitoku M, Sato L, Senda T, Horikoshi M (2008) Histone chaperones: 30 years from isolation to elucidation of the mechanisms of nucleosome assembly and disassembly. Cell Mol Life Sci 65: 414–444 [DOI] [PMC free article] [PubMed] [Google Scholar]
- Esteller M (2007) Epigenetic gene silencing in cancer: the DNA hypermethylome. Hum Mol Genet 16(Spec No 1): R50–R59 [DOI] [PubMed] [Google Scholar]
- Franken NA, Rodermond HM, Stap J, Haveman J, van Bree C (2006) Clonogenic assay of cells in vitro. Nat Protoc 1: 2315–2319 [DOI] [PubMed] [Google Scholar]
- Gaillard PH, Martini EM, Kaufman PD, Stillman B, Moustacchi E, Almouzni G (1996) Chromatin assembly coupled to DNA repair: a new role for chromatin assembly factor I. Cell 86: 887–896 [DOI] [PubMed] [Google Scholar]
- Gazin C, Wajapeyee N, Gobeil S, Virbasius CM, Green MR (2007) An elaborate pathway required for Ras-mediated epigenetic silencing. Nature 449: 1073–1077 [DOI] [PMC free article] [PubMed] [Google Scholar]
- Goldberg AD, Banaszynski LA, Noh KM, Lewis PW, Elsaesser SJ, Stadler S, Dewell S, Law M, Guo X, Li X, Wen D, Chapgier A, DeKelver RC, Miller JC, Lee YL, Boydston EA, Holmes MC, Gregory PD, Greally JM, Rafii S et al. (2010) Distinct factors control histone variant H3.3 localization at specific genomic regions. Cell 140: 678–691 [DOI] [PMC free article] [PubMed] [Google Scholar]
- Goodfellow H, Krejci A, Moshkin Y, Verrijzer CP, Karch F, Bray SJ (2007) Gene-specific targeting of the histone chaperone asf1 to mediate silencing. Dev Cell 13: 593–600 [DOI] [PubMed] [Google Scholar]
- Groth A, Corpet A, Cook AJ, Roche D, Bartek J, Lukas J, Almouzni G (2007) Regulation of replication fork progression through histone supply and demand. Science 318: 1928–1931 [DOI] [PubMed] [Google Scholar]
- Groth A, Ray-Gallet D, Quivy JP, Lukas J, Bartek J, Almouzni G (2005) Human Asf1 regulates the flow of S phase histones during replicational stress. Mol Cell 17: 301–311 [DOI] [PubMed] [Google Scholar]
- Hackett AJ, Smith HS, Springer EL, Owens RB, Nelson-Rees WA, Riggs JL, Gardner MB (1977) Two syngeneic cell lines from human breast tissue: the aneuploid mammary epithelial (Hs578T) and the diploid myoepithelial (Hs578Bst) cell lines. J Natl Cancer Inst 58: 1795–1806 [DOI] [PubMed] [Google Scholar]
- Hanahan D, Weinberg RA (2000) The hallmarks of cancer. Cell 100: 57–70 [DOI] [PubMed] [Google Scholar]
- Hayashi R, Goto Y, Tanaka R, Oonogi K, Hisasue M, Yoshida K (2007) Transcriptional regulation of human chromatin assembly factor ASF1. DNA Cell Biol 26: 91–99 [DOI] [PubMed] [Google Scholar]
- Jasencakova Z, Scharf AN, Ask K, Corpet A, Imhof A, Almouzni G, Groth A (2010) Replication stress interferes with histone recycling and predeposition marking of new histones. Mol Cell 37: 736–743 [DOI] [PubMed] [Google Scholar]
- Jones PA, Baylin SB (2007) The epigenomics of cancer. Cell 128: 683–692 [DOI] [PMC free article] [PubMed] [Google Scholar]
- Kornberg RD (1977) Structure of chromatin. Annu Rev Biochem 46: 931–954 [DOI] [PubMed] [Google Scholar]
- Kurdistani SK (2007) Histone modifications as markers of cancer prognosis: a cellular view. Br J Cancer 97: 1–5 [DOI] [PMC free article] [PubMed] [Google Scholar]
- Le S, Davis C, Konopka JB, Sternglanz R (1997) Two new S-phase-specific genes from Saccharomyces cerevisiae. Yeast 13: 1029–1042 [DOI] [PubMed] [Google Scholar]
- Li B, Carey M, Workman JL (2007) The role of chromatin during transcription. Cell 128: 707–719 [DOI] [PubMed] [Google Scholar]
- Loyola A, Almouzni G (2007) Marking histone H3 variants: how, when and why? Trends Biochem Sci 32: 425–433 [DOI] [PubMed] [Google Scholar]
- Martini E, Roche DM, Marheineke K, Verreault A, Almouzni G (1998) Recruitment of phosphorylated chromatin assembly factor 1 to chromatin after UV irradiation of human cells. J Cell Biol 143: 563–575 [DOI] [PMC free article] [PubMed] [Google Scholar]
- Mascolo M, Vecchione ML, Ilardi G, Scalvenzi M, Molea G, Di Benedetto M, Nugnes L, Siano M, De Rosa G, Staibano S (2010) Overexpression of chromatin assembly factor-1/p60 helps to predict the prognosis of melanoma patients. BMC Cancer 10: 63. [DOI] [PMC free article] [PubMed] [Google Scholar]
- Mello JA, Sillje HH, Roche DM, Kirschner DB, Nigg EA, Almouzni G (2002) Human Asf1 and CAF-1 interact and synergize in a repair-coupled nucleosome assembly pathway. EMBO Rep 3: 329–334 [DOI] [PMC free article] [PubMed] [Google Scholar]
- Moshkin YM, Kan TW, Goodfellow H, Bezstarosti K, Maeda RK, Pilyugin M, Karch F, Bray SJ, Demmers JA, Verrijzer CP (2009) Histone chaperones ASF1 and NAP1 differentially modulate removal of active histone marks by LID-RPD3 complexes during NOTCH silencing. Mol Cell 35: 782–793 [DOI] [PubMed] [Google Scholar]
- Mousson F, Ochsenbein F, Mann C (2007) The histone chaperone Asf1 at the crossroads of chromatin and DNA checkpoint pathways. Chromosoma 116: 79–93 [DOI] [PubMed] [Google Scholar]
- Pilyugin M, Demmers J, Verrijzer CP, Karch F, Moshkin YM (2009) Phosphorylation-mediated control of histone chaperone ASF1 levels by Tousled-like kinases. PLoS ONE 4: e8328. [DOI] [PMC free article] [PubMed] [Google Scholar]
- Polo SE, Almouzni G (2006) Chromatin assembly: a basic recipe with various flavours. Curr Opin Genet Dev 16: 104–111 [DOI] [PubMed] [Google Scholar]
- Polo SE, Theocharis SE, Grandin L, Gambotti L, Antoni G, Savignoni A, Asselain B, Patsouris E, Almouzni G (2010) Clinical significance and prognostic value of chromatin assembly factor-1 overexpression in human solid tumours. Histopathology 57: 716–724 [DOI] [PubMed] [Google Scholar]
- Polo SE, Theocharis SE, Klijanienko J, Savignoni A, Asselain B, Vielh P, Almouzni G (2004) Chromatin assembly factor-1, a marker of clinical value to distinguish quiescent from proliferating cells. Cancer Res 64: 2371–2381 [DOI] [PubMed] [Google Scholar]
- Ransom M, Dennehey BK, Tyler JK (2010) Chaperoning histones during DNA replication and repair. Cell 140: 183–195 [DOI] [PMC free article] [PubMed] [Google Scholar]
- Ray-Gallet D, Quivy JP, Scamps C, Martini EM, Lipinski M, Almouzni G (2002) HIRA is critical for a nucleosome assembly pathway independent of DNA synthesis. Mol Cell 9: 1091–1100 [DOI] [PubMed] [Google Scholar]
- Rhodes DR, Yu J, Shanker K, Deshpande N, Varambally R, Ghosh D, Barrette T, Pandey A, Chinnaiyan AM (2004) ONCOMINE: a cancer microarray database and integrated data-mining platform. Neoplasia 6: 1–6 [DOI] [PMC free article] [PubMed] [Google Scholar]
- Rosty C, Sheffer M, Tsafrir D, Stransky N, Tsafrir I, Peter M, de Cremoux P, de La Rochefordiere A, Salmon R, Dorval T, Thiery JP, Couturier J, Radvanyi F, Domany E, Sastre-Garau X (2005) Identification of a proliferation gene cluster associated with HPV E6/E7 expression level and viral DNA load in invasive cervical carcinoma. Oncogene 24: 7094–7104 [DOI] [PubMed] [Google Scholar]
- Sanematsu F, Takami Y, Barman HK, Fukagawa T, Ono T, Shibahara K, Nakayama T (2006) Asf1 is required for viability and chromatin assembly during DNA replication in vertebrate cells. J Biol Chem 281: 13817–13827 [DOI] [PubMed] [Google Scholar]
- Schonk DM, Kuijpers HJ, van Drunen E, van Dalen CH, Geurts van Kessel AH, Verheijen R, Ramaekers FC (1989) Assignment of the gene(s) involved in the expression of the proliferation-related Ki-67 antigen to human chromosome 10. Hum Genet 83: 297–299 [DOI] [PubMed] [Google Scholar]
- Schulz LL, Tyler JK (2006) The histone chaperone ASF1 localizes to active DNA replication forks to mediate efficient DNA replication. FASEB J 20: 488–490 [DOI] [PubMed] [Google Scholar]
- Sillje HH, Nigg EA (2001) Identification of human Asf1 chromatin assembly factors as substrates of Tousled-like kinases. Curr Biol 11: 1068–1073 [DOI] [PubMed] [Google Scholar]
- Smith S, Stillman B (1989) Purification and characterization of CAF-I, a human cell factor required for chromatin assembly during DNA replication in vitro. Cell 58: 15–25 [DOI] [PubMed] [Google Scholar]
- Smyth GK (2004) Linear models and empirical bayes methods for assessing differential expression in microarray experiments. Stat Appl Genet Mol Biol 3: Article3. [DOI] [PubMed] [Google Scholar]
- Sotiriou C, Piccart MJ (2007) Taking gene-expression profiling to the clinic: when will molecular signatures become relevant to patient care? Nat Rev Cancer 7: 545–553 [DOI] [PubMed] [Google Scholar]
- Sotiriou C, Wirapati P, Loi S, Harris A, Fox S, Smeds J, Nordgren H, Farmer P, Praz V, Haibe-Kains B, Desmedt C, Larsimont D, Cardoso F, Peterse H, Nuyten D, Buyse M, Van de Vijver MJ, Bergh J, Piccart M, Delorenzi M (2006) Gene expression profiling in breast cancer: understanding the molecular basis of histologic grade to improve prognosis. J Natl Cancer Inst 98: 262–272 [DOI] [PubMed] [Google Scholar]
- Staibano S, Mascolo M, Mancini FP, Kisslinger A, Salvatore G, Di Benedetto M, Chieffi P, Altieri V, Prezioso D, Ilardi G, De Rosa G, Tramontano D (2009) Overexpression of chromatin assembly factor-1 (CAF-1) p60 is predictive of adverse behaviour of prostatic cancer. Histopathology 54: 580–589 [DOI] [PubMed] [Google Scholar]
- Stratton MR, Rahman N (2008) The emerging landscape of breast cancer susceptibility. Nat Genet 40: 17–22 [DOI] [PubMed] [Google Scholar]
- Tagami H, Ray-Gallet D, Almouzni G, Nakatani Y (2004) Histone H3.1 and H3.3 complexes mediate nucleosome assembly pathways dependent or independent of DNA synthesis. Cell 116: 51–61 [DOI] [PubMed] [Google Scholar]
- Tamburini BA, Carson JJ, Adkins MW, Tyler JK (2005) Functional conservation and specialization among eukaryotic anti-silencing function 1 histone chaperones. Eukaryot Cell 4: 1583–1590 [DOI] [PMC free article] [PubMed] [Google Scholar]
- Tang Y, Poustovoitov MV, Zhao K, Garfinkel M, Canutescu A, Dunbrack R, Adams PD, Marmorstein R (2006) Structure of a human ASF1a-HIRA complex and insights into specificity of histone chaperone complex assembly. Nat Struct Mol Biol 13: 921–929 [DOI] [PMC free article] [PubMed] [Google Scholar]
- Tyler JK, Adams CR, Chen SR, Kobayashi R, Kamakaka RT, Kadonaga JT (1999) The RCAF complex mediates chromatin assembly during DNA replication and repair. Nature 402: 555–560 [DOI] [PubMed] [Google Scholar]
- Umehara T, Horikoshi M (2003) Transcription initiation factor IID-interactive histone chaperone CIA-II implicated in mammalian spermatogenesis. J Biol Chem 278: 35660–35667 [DOI] [PubMed] [Google Scholar]
- van 't Veer LJ, Dai H, van de Vijver MJ, He YD, Hart AA, Mao M, Peterse HL, van der Kooy K, Marton MJ, Witteveen AT, Schreiber GJ, Kerkhoven RM, Roberts C, Linsley PS, Bernards R, Friend SH (2002) Gene expression profiling predicts clinical outcome of breast cancer. Nature 415: 530–536 [DOI] [PubMed] [Google Scholar]
- Wirapati P, Sotiriou C, Kunkel S, Farmer P, Pradervand S, Haibe-Kains B, Desmedt C, Ignatiadis M, Sengstag T, Schutz F, Goldstein DR, Piccart M, Delorenzi M (2008) Meta-analysis of gene expression profiles in breast cancer: toward a unified understanding of breast cancer subtyping and prognosis signatures. Breast Cancer Res 10: R65. [DOI] [PMC free article] [PubMed] [Google Scholar]
- Zhang R, Poustovoitov MV, Ye X, Santos HA, Chen W, Daganzo SM, Erzberger JP, Serebriiskii IG, Canutescu AA, Dunbrack RL, Pehrson JR, Berger JM, Kaufman PD, Adams PD (2005) Formation of MacroH2A-containing senescence-associated heterochromatin foci and senescence driven by ASF1a and HIRA. Dev Cell 8: 19–30 [DOI] [PubMed] [Google Scholar]
Associated Data
This section collects any data citations, data availability statements, or supplementary materials included in this article.