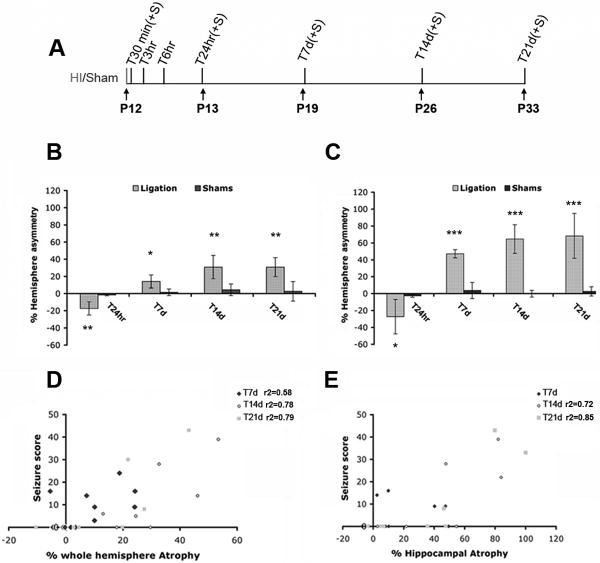
Figure 1. Experimental layout of perinatal ischemia in P12 mice, time-course of injury, and correlation of the acute seizure score with the extent of injury following stroke.
(A) For the acute analysis we selected T30 min, T3hr, T6hr and T24hr to detect early molecular changes. T7days, T14days and T21 days were used to monitor the long term effects of neonatal stroke. (For each time-point we utilized n=10 ligated mice. n=4 shams were used at the time points indicated with +S). (B and C) Mean ipsilateral percent hemispheric (B) and hippocampal (C) asymmetry, compared to shams for each time-point analyzed, shows a negative value at T24hr, representing swelling, followed by a progressive brain atrophy following ischemia (see positive percent asymmetry at T7d-T21d). (*: p<0.05, ** : p<0.01, *** : p< 0.001). (D) Plots representing the correlations between acute seizure scores and percent hemispheric atrophy for animals sacrificed at T7d (P19) (r2=0.58, p=0.01), T14d (P26) (r2=0.78, p<0.01) and T21d (P33) (r2=0.79, p<0.01) after ligation. (E) Plots representing the correlations between acute seizure score and severity of hippocampal atrophy at T7d (P19, no linear correlation), T14d (P26; r2=0.72, p=0.01) and at T21d (P33; r2=0.85, p<0.01) following stroke at P12.

