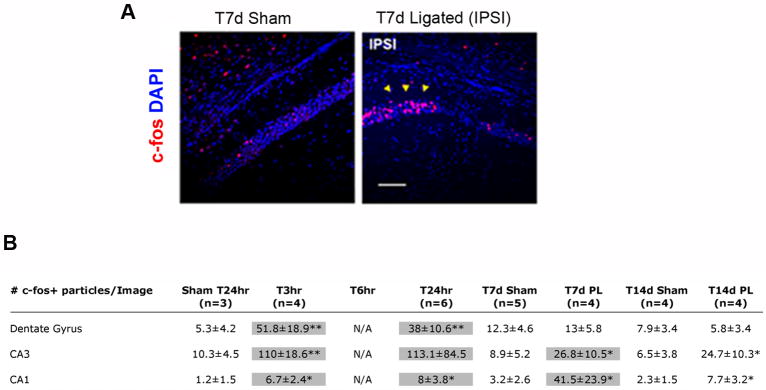
Figure 3. Time course of c-fos expression in ipsilateral hippocampus at acute and later time-points after ischemic injury at P12.
(A) C-fos immunolabeling of T7d (P19) mouse coronal sections reveals that in the ipsilateral hippocampus c-fos expression is ectopically induced in CA1 regions neighboring areas of cell-death (yellow arrows on c-fos/DAPI panel), as compared to P19 sham controls. (B) Table summarizing the time course of appearance of c-fos immunoreactive cells in the hippocampal regions CA1, CA3 and DG. Highlighted boxes indicate regions with elevated apoptosis and Notch-2 expression. (Scale bar in A is 50μm; *: p<0.05, ** : p<0.01, *** : p< 0.001).

